
Key Insights
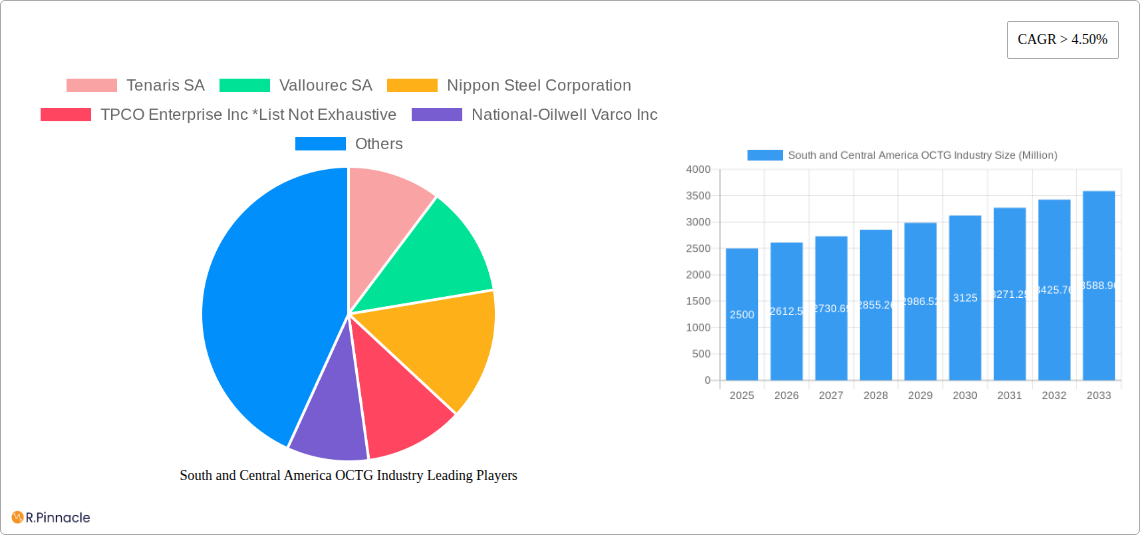
The South and Central American Oil Country Tubular Goods (OCTG) market presents a compelling investment opportunity, driven by sustained growth in the region's oil and gas exploration and production activities. While precise market figures for South and Central America are not explicitly provided, we can extrapolate a reasonable estimate based on the global CAGR of >4.50% and regional economic trends. Considering the significant oil reserves and ongoing investments in infrastructure development across countries like Brazil, Colombia, and Argentina, the South and Central American OCTG market is experiencing robust growth. This growth is further fueled by the increasing demand for premium grade OCTG, reflecting a focus on enhanced well performance and longevity. The preference for seamless and electric resistance welded (ERW) OCTG, catering to diverse well conditions, also contributes to the market's dynamism. Major players like Tenaris SA and Vallourec SA are strategically positioned to capitalize on this expansion, alongside regional players. However, challenges remain, including price volatility in raw materials (steel) and potential regulatory hurdles impacting project timelines.
Despite these constraints, the long-term outlook for the South and Central American OCTG market remains positive. Government initiatives aimed at boosting energy independence and attracting foreign investments are creating a favorable environment. The rising adoption of advanced drilling technologies and an increasing focus on deepwater exploration will likely drive further demand for high-quality OCTG in the forecast period (2025-2033). While political and economic stability varies across the region, the overall trend suggests a consistently expanding market. The segmentation within the market, primarily based on manufacturing process (seamless vs. ERW) and grade (premium vs. API), offers various opportunities for specialized players to establish a strong market position. The continued development of new oil and gas fields and ongoing investment in existing infrastructure will be key drivers of market growth in the coming years.
South and Central America OCTG Industry Report: 2019-2033
This comprehensive report provides an in-depth analysis of the South and Central America Oil Country Tubular Goods (OCTG) industry, offering invaluable insights for industry professionals, investors, and strategic decision-makers. The study period covers 2019-2033, with a base year of 2025 and a forecast period of 2025-2033. The report leverages extensive market research to deliver actionable intelligence, encompassing market size, segmentation, growth drivers, challenges, opportunities, and competitive landscape analysis.
South and Central America OCTG Industry Market Structure & Innovation Trends
This section analyzes the competitive landscape, innovation drivers, and regulatory influences shaping the South and Central America OCTG market. The market is moderately concentrated, with key players including Tenaris SA, Vallourec SA, Nippon Steel Corporation, TPCO Enterprise Inc, National-Oilwell Varco Inc, and ArcelorMittal SA (list not exhaustive). These companies hold a combined market share of approximately xx%, indicating some fragmentation.
- Market Concentration: The Herfindahl-Hirschman Index (HHI) for the market is estimated at xx, suggesting a moderately competitive environment.
- Innovation Drivers: Demand for high-performance OCTG products, particularly premium grade materials designed for harsh operating conditions, drives innovation. Technological advancements in manufacturing processes (seamless and ERW) are also key.
- Regulatory Framework: Government regulations related to safety, environmental protection, and local content requirements significantly influence market dynamics. Variations in regulations across different countries in the region contribute to complexities.
- Product Substitutes: While limited, alternative materials and technologies are emerging, posing a potential, albeit currently minor, threat.
- End-User Demographics: The primary end-users are oil and gas exploration and production companies, with varying levels of activity across the region.
- M&A Activities: Over the historical period (2019-2024), the total value of M&A deals in the South and Central American OCTG sector reached approximately $xx Million. These activities have reshaped the market structure and strengthened the presence of certain players.
South and Central America OCTG Industry Market Dynamics & Trends
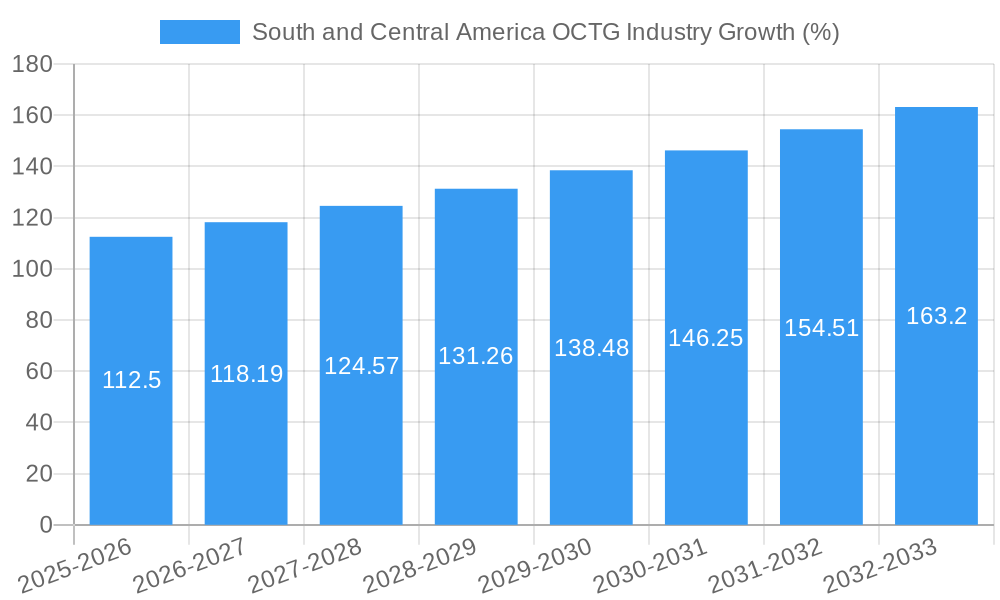
The South and Central American OCTG market is projected to experience significant growth during the forecast period (2025-2033). Several factors fuel this expansion, including:
- Increasing Oil and Gas Exploration and Production: Exploration activities across the region drive demand, particularly in countries with abundant reserves and supportive government policies. This growth is further bolstered by rising global energy demand.
- Technological Disruptions: Advancements in manufacturing techniques lead to enhanced product quality and efficiency, thus positively impacting market growth. The adoption of advanced materials and coatings enhances the performance and lifespan of OCTG products.
- Consumer Preferences: The preference for premium grade OCTG materials for enhanced durability and reliability fuels demand for higher-quality products and propels the market towards a higher value segment.
- Competitive Dynamics: Intense competition among major players leads to continuous improvements in product quality, cost-effectiveness, and customer service. Strategic alliances and partnerships are also shaping the competitive landscape.
The Compound Annual Growth Rate (CAGR) for the South and Central American OCTG market is projected to be xx% from 2025-2033. Market penetration for premium grade OCTG is expected to increase from xx% in 2025 to xx% in 2033.
Dominant Regions & Segments in South and Central America OCTG Industry
The report identifies Brazil and Mexico as the dominant regions within the South and Central American OCTG market, driven by their substantial oil and gas reserves, robust infrastructure, and ongoing investments in exploration and production.
- Brazil: Key growth drivers include government initiatives to boost domestic oil and gas production, along with the country’s significant offshore oil and gas reserves.
- Mexico: Energy reforms and increased private sector participation in the oil and gas industry have fueled growth in the Mexican market.
By Manufacturing Process:
- Seamless: The seamless segment holds a larger market share due to its superior strength and durability compared to ERW pipes.
- Electric Resistance Welded (ERW): The ERW segment is cost-effective and suitable for specific applications, maintaining a significant presence in the market.
By Grade:
- Premium Grade: The premium grade segment displays faster growth due to increasing demand for higher-performance OCTG products suited for complex well conditions.
- API Grade: The API grade segment remains substantial, catering to standard well applications.
South and Central America OCTG Industry Product Innovations
Significant advancements in material science and manufacturing processes have led to the development of high-strength, corrosion-resistant, and lighter OCTG products. These innovations enhance operational efficiency, reduce costs, and improve the safety of drilling operations. The increased use of advanced coatings and enhanced joining techniques are also key trends, catering to the need for reliable performance in challenging environments. The market is shifting towards higher-grade materials, offering better strength and longevity.
Report Scope & Segmentation Analysis
This report segments the South and Central American OCTG market by manufacturing process (seamless and ERW) and grade (premium and API). Both segments exhibit significant growth potential, driven by factors previously discussed. The seamless segment is projected to reach $xx Million by 2033, while the ERW segment is estimated to reach $xx Million. The premium grade segment is forecasted to demonstrate a higher CAGR compared to API grade, largely due to increasing demand for enhanced wellbore integrity. Competitive dynamics within each segment vary, reflecting diverse technological capabilities and product specialization among market players.
Key Drivers of South and Central America OCTG Industry Growth
The growth of the South and Central American OCTG industry is driven by several key factors, including:
- Rising energy demand: Global energy demand necessitates increased oil and gas production.
- Significant oil and gas reserves: The region possesses vast untapped resources, fueling exploration and production activities.
- Government initiatives: Supportive government policies and regulations encourage investment in the oil and gas sector.
- Technological advancements: Innovations in OCTG technology enhance performance and operational efficiency.
Challenges in the South and Central America OCTG Industry Sector
The South and Central American OCTG industry faces certain challenges including:
- Price volatility: Fluctuations in oil and gas prices directly impact demand for OCTG products.
- Infrastructure limitations: Inadequate infrastructure in some regions hinders efficient transportation and logistics.
- Geopolitical risks: Political instability and regulatory uncertainties can negatively impact investment and production.
Emerging Opportunities in South and Central America OCTG Industry
Emerging opportunities include:
- Growth of unconventional resources: Exploitation of shale gas and tight oil presents significant opportunities for OCTG providers.
- Adoption of new technologies: Demand for enhanced oil recovery (EOR) techniques and advanced drilling technologies fuels growth.
- Focus on sustainability: Increasing focus on environmentally friendly drilling practices and waste management creates opportunities for sustainable OCTG solutions.
Leading Players in the South and Central America OCTG Industry Market
- Tenaris SA
- Vallourec SA
- Nippon Steel Corporation
- TPCO Enterprise Inc
- National-Oilwell Varco Inc
- ArcelorMittal SA
Key Developments in South and Central America OCTG Industry
- 2022 Q3: Tenaris announces a new facility expansion in Brazil, increasing production capacity.
- 2023 Q1: Vallourec secures a major contract for premium OCTG supplies in Mexico.
- 2024 Q2: New regulations regarding OCTG material standards come into effect in several South American countries.
Future Outlook for South and Central America OCTG Industry Market
The future outlook for the South and Central American OCTG market remains positive, driven by sustained oil and gas exploration and production activities. Further technological advancements and increasing investment in infrastructure will fuel continued growth. Strategic partnerships and mergers and acquisitions will likely continue to shape the competitive landscape. The market is expected to witness a steady expansion in the coming years, with significant opportunities for both established and emerging players.
South and Central America OCTG Industry Segmentation
-
1. Manufacturing Process
- 1.1. Seamless
- 1.2. Electric Resistance Welded
-
2. Grade
- 2.1. Premium Grade
- 2.2. API Grade
-
3. Geography
- 3.1. Brazil
- 3.2. Argentina
- 3.3. Venezuela
- 3.4. Rest of South and Central America
South and Central America OCTG Industry Segmentation By Geography
- 1. Brazil
- 2. Argentina
- 3. Venezuela
- 4. Rest of South and Central America
South and Central America OCTG Industry REPORT HIGHLIGHTS
| Aspects | Details |
|---|---|
| Study Period | 2019-2033 |
| Base Year | 2024 |
| Estimated Year | 2025 |
| Forecast Period | 2025-2033 |
| Historical Period | 2019-2024 |
| Growth Rate | CAGR of > 4.50% from 2019-2033 |
| Segmentation |
|
Table of Contents
- 1. Introduction
- 1.1. Research Scope
- 1.2. Market Segmentation
- 1.3. Research Methodology
- 1.4. Definitions and Assumptions
- 2. Executive Summary
- 2.1. Introduction
- 3. Market Dynamics
- 3.1. Introduction
- 3.2. Market Drivers
- 3.2.1. 4.; Proven Shale Gas Reserves 4.; Technological Advancement in Horizontal Drilling and Hydraulic Fracturing
- 3.3. Market Restrains
- 3.3.1. 4.; High Exploration Cost
- 3.4. Market Trends
- 3.4.1. Premium Grade Segment is Expected to Witness Significant Demand
- 4. Market Factor Analysis
- 4.1. Porters Five Forces
- 4.2. Supply/Value Chain
- 4.3. PESTEL analysis
- 4.4. Market Entropy
- 4.5. Patent/Trademark Analysis
- 5. Global South and Central America OCTG Industry Analysis, Insights and Forecast, 2019-2031
- 5.1. Market Analysis, Insights and Forecast - by Manufacturing Process
- 5.1.1. Seamless
- 5.1.2. Electric Resistance Welded
- 5.2. Market Analysis, Insights and Forecast - by Grade
- 5.2.1. Premium Grade
- 5.2.2. API Grade
- 5.3. Market Analysis, Insights and Forecast - by Geography
- 5.3.1. Brazil
- 5.3.2. Argentina
- 5.3.3. Venezuela
- 5.3.4. Rest of South and Central America
- 5.4. Market Analysis, Insights and Forecast - by Region
- 5.4.1. Brazil
- 5.4.2. Argentina
- 5.4.3. Venezuela
- 5.4.4. Rest of South and Central America
- 5.1. Market Analysis, Insights and Forecast - by Manufacturing Process
- 6. Brazil South and Central America OCTG Industry Analysis, Insights and Forecast, 2019-2031
- 6.1. Market Analysis, Insights and Forecast - by Manufacturing Process
- 6.1.1. Seamless
- 6.1.2. Electric Resistance Welded
- 6.2. Market Analysis, Insights and Forecast - by Grade
- 6.2.1. Premium Grade
- 6.2.2. API Grade
- 6.3. Market Analysis, Insights and Forecast - by Geography
- 6.3.1. Brazil
- 6.3.2. Argentina
- 6.3.3. Venezuela
- 6.3.4. Rest of South and Central America
- 6.1. Market Analysis, Insights and Forecast - by Manufacturing Process
- 7. Argentina South and Central America OCTG Industry Analysis, Insights and Forecast, 2019-2031
- 7.1. Market Analysis, Insights and Forecast - by Manufacturing Process
- 7.1.1. Seamless
- 7.1.2. Electric Resistance Welded
- 7.2. Market Analysis, Insights and Forecast - by Grade
- 7.2.1. Premium Grade
- 7.2.2. API Grade
- 7.3. Market Analysis, Insights and Forecast - by Geography
- 7.3.1. Brazil
- 7.3.2. Argentina
- 7.3.3. Venezuela
- 7.3.4. Rest of South and Central America
- 7.1. Market Analysis, Insights and Forecast - by Manufacturing Process
- 8. Venezuela South and Central America OCTG Industry Analysis, Insights and Forecast, 2019-2031
- 8.1. Market Analysis, Insights and Forecast - by Manufacturing Process
- 8.1.1. Seamless
- 8.1.2. Electric Resistance Welded
- 8.2. Market Analysis, Insights and Forecast - by Grade
- 8.2.1. Premium Grade
- 8.2.2. API Grade
- 8.3. Market Analysis, Insights and Forecast - by Geography
- 8.3.1. Brazil
- 8.3.2. Argentina
- 8.3.3. Venezuela
- 8.3.4. Rest of South and Central America
- 8.1. Market Analysis, Insights and Forecast - by Manufacturing Process
- 9. Rest of South and Central America South and Central America OCTG Industry Analysis, Insights and Forecast, 2019-2031
- 9.1. Market Analysis, Insights and Forecast - by Manufacturing Process
- 9.1.1. Seamless
- 9.1.2. Electric Resistance Welded
- 9.2. Market Analysis, Insights and Forecast - by Grade
- 9.2.1. Premium Grade
- 9.2.2. API Grade
- 9.3. Market Analysis, Insights and Forecast - by Geography
- 9.3.1. Brazil
- 9.3.2. Argentina
- 9.3.3. Venezuela
- 9.3.4. Rest of South and Central America
- 9.1. Market Analysis, Insights and Forecast - by Manufacturing Process
- 10. North America South and Central America OCTG Industry Analysis, Insights and Forecast, 2019-2031
- 10.1. Market Analysis, Insights and Forecast - By Country/Sub-region
- 10.1.1 United States
- 10.1.2 Canada
- 10.1.3 Mexico
- 11. Europe South and Central America OCTG Industry Analysis, Insights and Forecast, 2019-2031
- 11.1. Market Analysis, Insights and Forecast - By Country/Sub-region
- 11.1.1 Germany
- 11.1.2 United Kingdom
- 11.1.3 France
- 11.1.4 Spain
- 11.1.5 Italy
- 11.1.6 Spain
- 11.1.7 Belgium
- 11.1.8 Netherland
- 11.1.9 Nordics
- 11.1.10 Rest of Europe
- 12. Asia Pacific South and Central America OCTG Industry Analysis, Insights and Forecast, 2019-2031
- 12.1. Market Analysis, Insights and Forecast - By Country/Sub-region
- 12.1.1 China
- 12.1.2 Japan
- 12.1.3 India
- 12.1.4 South Korea
- 12.1.5 Southeast Asia
- 12.1.6 Australia
- 12.1.7 Indonesia
- 12.1.8 Phillipes
- 12.1.9 Singapore
- 12.1.10 Thailandc
- 12.1.11 Rest of Asia Pacific
- 13. South America South and Central America OCTG Industry Analysis, Insights and Forecast, 2019-2031
- 13.1. Market Analysis, Insights and Forecast - By Country/Sub-region
- 13.1.1 Brazil
- 13.1.2 Argentina
- 13.1.3 Peru
- 13.1.4 Chile
- 13.1.5 Colombia
- 13.1.6 Ecuador
- 13.1.7 Venezuela
- 13.1.8 Rest of South America
- 14. North America South and Central America OCTG Industry Analysis, Insights and Forecast, 2019-2031
- 14.1. Market Analysis, Insights and Forecast - By Country/Sub-region
- 14.1.1 United States
- 14.1.2 Canada
- 14.1.3 Mexico
- 15. MEA South and Central America OCTG Industry Analysis, Insights and Forecast, 2019-2031
- 15.1. Market Analysis, Insights and Forecast - By Country/Sub-region
- 15.1.1 United Arab Emirates
- 15.1.2 Saudi Arabia
- 15.1.3 South Africa
- 15.1.4 Rest of Middle East and Africa
- 16. Competitive Analysis
- 16.1. Global Market Share Analysis 2024
- 16.2. Company Profiles
- 16.2.1 Tenaris SA
- 16.2.1.1. Overview
- 16.2.1.2. Products
- 16.2.1.3. SWOT Analysis
- 16.2.1.4. Recent Developments
- 16.2.1.5. Financials (Based on Availability)
- 16.2.2 Vallourec SA
- 16.2.2.1. Overview
- 16.2.2.2. Products
- 16.2.2.3. SWOT Analysis
- 16.2.2.4. Recent Developments
- 16.2.2.5. Financials (Based on Availability)
- 16.2.3 Nippon Steel Corporation
- 16.2.3.1. Overview
- 16.2.3.2. Products
- 16.2.3.3. SWOT Analysis
- 16.2.3.4. Recent Developments
- 16.2.3.5. Financials (Based on Availability)
- 16.2.4 TPCO Enterprise Inc *List Not Exhaustive
- 16.2.4.1. Overview
- 16.2.4.2. Products
- 16.2.4.3. SWOT Analysis
- 16.2.4.4. Recent Developments
- 16.2.4.5. Financials (Based on Availability)
- 16.2.5 National-Oilwell Varco Inc
- 16.2.5.1. Overview
- 16.2.5.2. Products
- 16.2.5.3. SWOT Analysis
- 16.2.5.4. Recent Developments
- 16.2.5.5. Financials (Based on Availability)
- 16.2.6 ArcelorMittal SA
- 16.2.6.1. Overview
- 16.2.6.2. Products
- 16.2.6.3. SWOT Analysis
- 16.2.6.4. Recent Developments
- 16.2.6.5. Financials (Based on Availability)
- 16.2.1 Tenaris SA
List of Figures
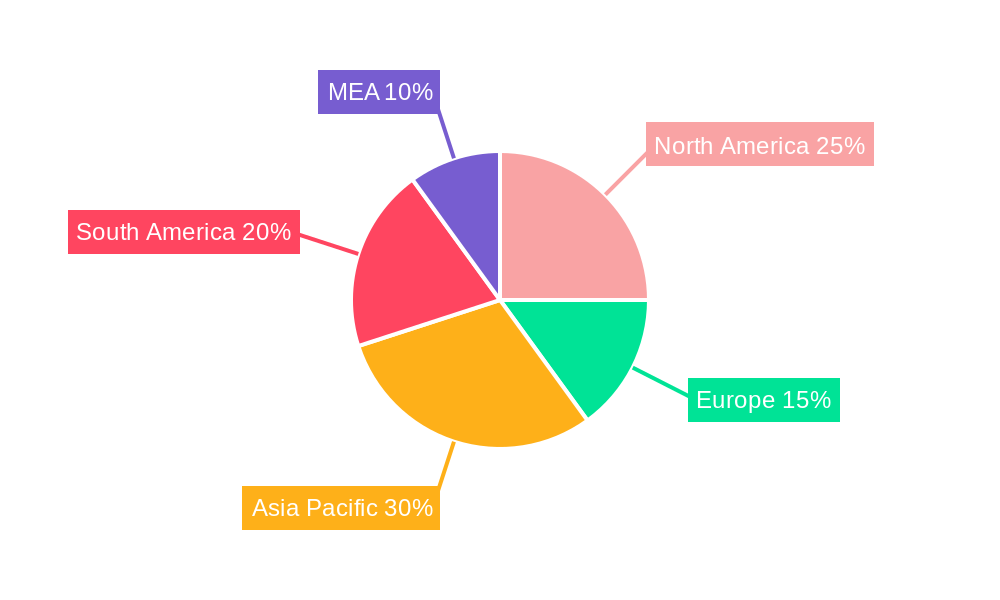
- Figure 1: Global South and Central America OCTG Industry Revenue Breakdown (Million, %) by Region 2024 & 2032
- Figure 2: North America South and Central America OCTG Industry Revenue (Million), by Country 2024 & 2032
- Figure 3: North America South and Central America OCTG Industry Revenue Share (%), by Country 2024 & 2032
- Figure 4: Europe South and Central America OCTG Industry Revenue (Million), by Country 2024 & 2032
- Figure 5: Europe South and Central America OCTG Industry Revenue Share (%), by Country 2024 & 2032
- Figure 6: Asia Pacific South and Central America OCTG Industry Revenue (Million), by Country 2024 & 2032
- Figure 7: Asia Pacific South and Central America OCTG Industry Revenue Share (%), by Country 2024 & 2032
- Figure 8: South America South and Central America OCTG Industry Revenue (Million), by Country 2024 & 2032
- Figure 9: South America South and Central America OCTG Industry Revenue Share (%), by Country 2024 & 2032
- Figure 10: North America South and Central America OCTG Industry Revenue (Million), by Country 2024 & 2032
- Figure 11: North America South and Central America OCTG Industry Revenue Share (%), by Country 2024 & 2032
- Figure 12: MEA South and Central America OCTG Industry Revenue (Million), by Country 2024 & 2032
- Figure 13: MEA South and Central America OCTG Industry Revenue Share (%), by Country 2024 & 2032
- Figure 14: Brazil South and Central America OCTG Industry Revenue (Million), by Manufacturing Process 2024 & 2032
- Figure 15: Brazil South and Central America OCTG Industry Revenue Share (%), by Manufacturing Process 2024 & 2032
- Figure 16: Brazil South and Central America OCTG Industry Revenue (Million), by Grade 2024 & 2032
- Figure 17: Brazil South and Central America OCTG Industry Revenue Share (%), by Grade 2024 & 2032
- Figure 18: Brazil South and Central America OCTG Industry Revenue (Million), by Geography 2024 & 2032
- Figure 19: Brazil South and Central America OCTG Industry Revenue Share (%), by Geography 2024 & 2032
- Figure 20: Brazil South and Central America OCTG Industry Revenue (Million), by Country 2024 & 2032
- Figure 21: Brazil South and Central America OCTG Industry Revenue Share (%), by Country 2024 & 2032
- Figure 22: Argentina South and Central America OCTG Industry Revenue (Million), by Manufacturing Process 2024 & 2032
- Figure 23: Argentina South and Central America OCTG Industry Revenue Share (%), by Manufacturing Process 2024 & 2032
- Figure 24: Argentina South and Central America OCTG Industry Revenue (Million), by Grade 2024 & 2032
- Figure 25: Argentina South and Central America OCTG Industry Revenue Share (%), by Grade 2024 & 2032
- Figure 26: Argentina South and Central America OCTG Industry Revenue (Million), by Geography 2024 & 2032
- Figure 27: Argentina South and Central America OCTG Industry Revenue Share (%), by Geography 2024 & 2032
- Figure 28: Argentina South and Central America OCTG Industry Revenue (Million), by Country 2024 & 2032
- Figure 29: Argentina South and Central America OCTG Industry Revenue Share (%), by Country 2024 & 2032
- Figure 30: Venezuela South and Central America OCTG Industry Revenue (Million), by Manufacturing Process 2024 & 2032
- Figure 31: Venezuela South and Central America OCTG Industry Revenue Share (%), by Manufacturing Process 2024 & 2032
- Figure 32: Venezuela South and Central America OCTG Industry Revenue (Million), by Grade 2024 & 2032
- Figure 33: Venezuela South and Central America OCTG Industry Revenue Share (%), by Grade 2024 & 2032
- Figure 34: Venezuela South and Central America OCTG Industry Revenue (Million), by Geography 2024 & 2032
- Figure 35: Venezuela South and Central America OCTG Industry Revenue Share (%), by Geography 2024 & 2032
- Figure 36: Venezuela South and Central America OCTG Industry Revenue (Million), by Country 2024 & 2032
- Figure 37: Venezuela South and Central America OCTG Industry Revenue Share (%), by Country 2024 & 2032
- Figure 38: Rest of South and Central America South and Central America OCTG Industry Revenue (Million), by Manufacturing Process 2024 & 2032
- Figure 39: Rest of South and Central America South and Central America OCTG Industry Revenue Share (%), by Manufacturing Process 2024 & 2032
- Figure 40: Rest of South and Central America South and Central America OCTG Industry Revenue (Million), by Grade 2024 & 2032
- Figure 41: Rest of South and Central America South and Central America OCTG Industry Revenue Share (%), by Grade 2024 & 2032
- Figure 42: Rest of South and Central America South and Central America OCTG Industry Revenue (Million), by Geography 2024 & 2032
- Figure 43: Rest of South and Central America South and Central America OCTG Industry Revenue Share (%), by Geography 2024 & 2032
- Figure 44: Rest of South and Central America South and Central America OCTG Industry Revenue (Million), by Country 2024 & 2032
- Figure 45: Rest of South and Central America South and Central America OCTG Industry Revenue Share (%), by Country 2024 & 2032
List of Tables
- Table 1: Global South and Central America OCTG Industry Revenue Million Forecast, by Region 2019 & 2032
- Table 2: Global South and Central America OCTG Industry Revenue Million Forecast, by Manufacturing Process 2019 & 2032
- Table 3: Global South and Central America OCTG Industry Revenue Million Forecast, by Grade 2019 & 2032
- Table 4: Global South and Central America OCTG Industry Revenue Million Forecast, by Geography 2019 & 2032
- Table 5: Global South and Central America OCTG Industry Revenue Million Forecast, by Region 2019 & 2032
- Table 6: Global South and Central America OCTG Industry Revenue Million Forecast, by Country 2019 & 2032
- Table 7: United States South and Central America OCTG Industry Revenue (Million) Forecast, by Application 2019 & 2032
- Table 8: Canada South and Central America OCTG Industry Revenue (Million) Forecast, by Application 2019 & 2032
- Table 9: Mexico South and Central America OCTG Industry Revenue (Million) Forecast, by Application 2019 & 2032
- Table 10: Global South and Central America OCTG Industry Revenue Million Forecast, by Country 2019 & 2032
- Table 11: Germany South and Central America OCTG Industry Revenue (Million) Forecast, by Application 2019 & 2032
- Table 12: United Kingdom South and Central America OCTG Industry Revenue (Million) Forecast, by Application 2019 & 2032
- Table 13: France South and Central America OCTG Industry Revenue (Million) Forecast, by Application 2019 & 2032
- Table 14: Spain South and Central America OCTG Industry Revenue (Million) Forecast, by Application 2019 & 2032
- Table 15: Italy South and Central America OCTG Industry Revenue (Million) Forecast, by Application 2019 & 2032
- Table 16: Spain South and Central America OCTG Industry Revenue (Million) Forecast, by Application 2019 & 2032
- Table 17: Belgium South and Central America OCTG Industry Revenue (Million) Forecast, by Application 2019 & 2032
- Table 18: Netherland South and Central America OCTG Industry Revenue (Million) Forecast, by Application 2019 & 2032
- Table 19: Nordics South and Central America OCTG Industry Revenue (Million) Forecast, by Application 2019 & 2032
- Table 20: Rest of Europe South and Central America OCTG Industry Revenue (Million) Forecast, by Application 2019 & 2032
- Table 21: Global South and Central America OCTG Industry Revenue Million Forecast, by Country 2019 & 2032
- Table 22: China South and Central America OCTG Industry Revenue (Million) Forecast, by Application 2019 & 2032
- Table 23: Japan South and Central America OCTG Industry Revenue (Million) Forecast, by Application 2019 & 2032
- Table 24: India South and Central America OCTG Industry Revenue (Million) Forecast, by Application 2019 & 2032
- Table 25: South Korea South and Central America OCTG Industry Revenue (Million) Forecast, by Application 2019 & 2032
- Table 26: Southeast Asia South and Central America OCTG Industry Revenue (Million) Forecast, by Application 2019 & 2032
- Table 27: Australia South and Central America OCTG Industry Revenue (Million) Forecast, by Application 2019 & 2032
- Table 28: Indonesia South and Central America OCTG Industry Revenue (Million) Forecast, by Application 2019 & 2032
- Table 29: Phillipes South and Central America OCTG Industry Revenue (Million) Forecast, by Application 2019 & 2032
- Table 30: Singapore South and Central America OCTG Industry Revenue (Million) Forecast, by Application 2019 & 2032
- Table 31: Thailandc South and Central America OCTG Industry Revenue (Million) Forecast, by Application 2019 & 2032
- Table 32: Rest of Asia Pacific South and Central America OCTG Industry Revenue (Million) Forecast, by Application 2019 & 2032
- Table 33: Global South and Central America OCTG Industry Revenue Million Forecast, by Country 2019 & 2032
- Table 34: Brazil South and Central America OCTG Industry Revenue (Million) Forecast, by Application 2019 & 2032
- Table 35: Argentina South and Central America OCTG Industry Revenue (Million) Forecast, by Application 2019 & 2032
- Table 36: Peru South and Central America OCTG Industry Revenue (Million) Forecast, by Application 2019 & 2032
- Table 37: Chile South and Central America OCTG Industry Revenue (Million) Forecast, by Application 2019 & 2032
- Table 38: Colombia South and Central America OCTG Industry Revenue (Million) Forecast, by Application 2019 & 2032
- Table 39: Ecuador South and Central America OCTG Industry Revenue (Million) Forecast, by Application 2019 & 2032
- Table 40: Venezuela South and Central America OCTG Industry Revenue (Million) Forecast, by Application 2019 & 2032
- Table 41: Rest of South America South and Central America OCTG Industry Revenue (Million) Forecast, by Application 2019 & 2032
- Table 42: Global South and Central America OCTG Industry Revenue Million Forecast, by Country 2019 & 2032
- Table 43: United States South and Central America OCTG Industry Revenue (Million) Forecast, by Application 2019 & 2032
- Table 44: Canada South and Central America OCTG Industry Revenue (Million) Forecast, by Application 2019 & 2032
- Table 45: Mexico South and Central America OCTG Industry Revenue (Million) Forecast, by Application 2019 & 2032
- Table 46: Global South and Central America OCTG Industry Revenue Million Forecast, by Country 2019 & 2032
- Table 47: United Arab Emirates South and Central America OCTG Industry Revenue (Million) Forecast, by Application 2019 & 2032
- Table 48: Saudi Arabia South and Central America OCTG Industry Revenue (Million) Forecast, by Application 2019 & 2032
- Table 49: South Africa South and Central America OCTG Industry Revenue (Million) Forecast, by Application 2019 & 2032
- Table 50: Rest of Middle East and Africa South and Central America OCTG Industry Revenue (Million) Forecast, by Application 2019 & 2032
- Table 51: Global South and Central America OCTG Industry Revenue Million Forecast, by Manufacturing Process 2019 & 2032
- Table 52: Global South and Central America OCTG Industry Revenue Million Forecast, by Grade 2019 & 2032
- Table 53: Global South and Central America OCTG Industry Revenue Million Forecast, by Geography 2019 & 2032
- Table 54: Global South and Central America OCTG Industry Revenue Million Forecast, by Country 2019 & 2032
- Table 55: Global South and Central America OCTG Industry Revenue Million Forecast, by Manufacturing Process 2019 & 2032
- Table 56: Global South and Central America OCTG Industry Revenue Million Forecast, by Grade 2019 & 2032
- Table 57: Global South and Central America OCTG Industry Revenue Million Forecast, by Geography 2019 & 2032
- Table 58: Global South and Central America OCTG Industry Revenue Million Forecast, by Country 2019 & 2032
- Table 59: Global South and Central America OCTG Industry Revenue Million Forecast, by Manufacturing Process 2019 & 2032
- Table 60: Global South and Central America OCTG Industry Revenue Million Forecast, by Grade 2019 & 2032
- Table 61: Global South and Central America OCTG Industry Revenue Million Forecast, by Geography 2019 & 2032
- Table 62: Global South and Central America OCTG Industry Revenue Million Forecast, by Country 2019 & 2032
- Table 63: Global South and Central America OCTG Industry Revenue Million Forecast, by Manufacturing Process 2019 & 2032
- Table 64: Global South and Central America OCTG Industry Revenue Million Forecast, by Grade 2019 & 2032
- Table 65: Global South and Central America OCTG Industry Revenue Million Forecast, by Geography 2019 & 2032
- Table 66: Global South and Central America OCTG Industry Revenue Million Forecast, by Country 2019 & 2032
Frequently Asked Questions
1. What is the projected Compound Annual Growth Rate (CAGR) of the South and Central America OCTG Industry?
The projected CAGR is approximately > 4.50%.
2. Which companies are prominent players in the South and Central America OCTG Industry?
Key companies in the market include Tenaris SA, Vallourec SA, Nippon Steel Corporation, TPCO Enterprise Inc *List Not Exhaustive, National-Oilwell Varco Inc, ArcelorMittal SA.
3. What are the main segments of the South and Central America OCTG Industry?
The market segments include Manufacturing Process, Grade, Geography.
4. Can you provide details about the market size?
The market size is estimated to be USD XX Million as of 2022.
5. What are some drivers contributing to market growth?
4.; Proven Shale Gas Reserves 4.; Technological Advancement in Horizontal Drilling and Hydraulic Fracturing.
6. What are the notable trends driving market growth?
Premium Grade Segment is Expected to Witness Significant Demand.
7. Are there any restraints impacting market growth?
4.; High Exploration Cost.
8. Can you provide examples of recent developments in the market?
N/A
9. What pricing options are available for accessing the report?
Pricing options include single-user, multi-user, and enterprise licenses priced at USD 4750, USD 5250, and USD 8750 respectively.
10. Is the market size provided in terms of value or volume?
The market size is provided in terms of value, measured in Million.
11. Are there any specific market keywords associated with the report?
Yes, the market keyword associated with the report is "South and Central America OCTG Industry," which aids in identifying and referencing the specific market segment covered.
12. How do I determine which pricing option suits my needs best?
The pricing options vary based on user requirements and access needs. Individual users may opt for single-user licenses, while businesses requiring broader access may choose multi-user or enterprise licenses for cost-effective access to the report.
13. Are there any additional resources or data provided in the South and Central America OCTG Industry report?
While the report offers comprehensive insights, it's advisable to review the specific contents or supplementary materials provided to ascertain if additional resources or data are available.
14. How can I stay updated on further developments or reports in the South and Central America OCTG Industry?
To stay informed about further developments, trends, and reports in the South and Central America OCTG Industry, consider subscribing to industry newsletters, following relevant companies and organizations, or regularly checking reputable industry news sources and publications.
Methodology
Step 1 - Identification of Relevant Samples Size from Population Database


Step 2 - Approaches for Defining Global Market Size (Value, Volume* & Price*)

Note*: In applicable scenarios
Step 3 - Data Sources
Primary Research
- Web Analytics
- Survey Reports
- Research Institute
- Latest Research Reports
- Opinion Leaders
Secondary Research
- Annual Reports
- White Paper
- Latest Press Release
- Industry Association
- Paid Database
- Investor Presentations

Step 4 - Data Triangulation
Involves using different sources of information in order to increase the validity of a study
These sources are likely to be stakeholders in a program - participants, other researchers, program staff, other community members, and so on.
Then we put all data in single framework & apply various statistical tools to find out the dynamic on the market.
During the analysis stage, feedback from the stakeholder groups would be compared to determine areas of agreement as well as areas of divergence


