
Key Insights
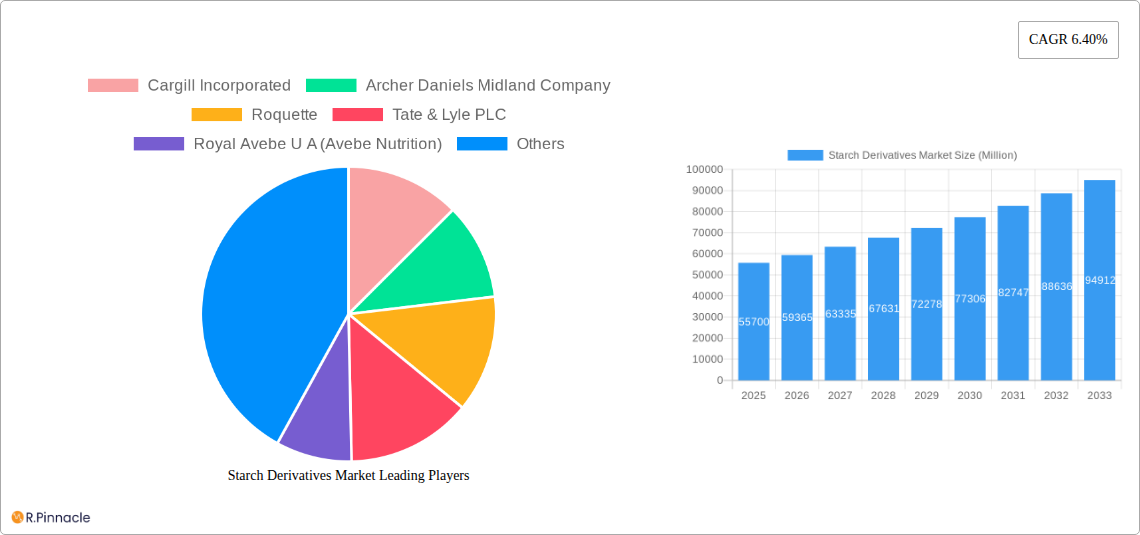
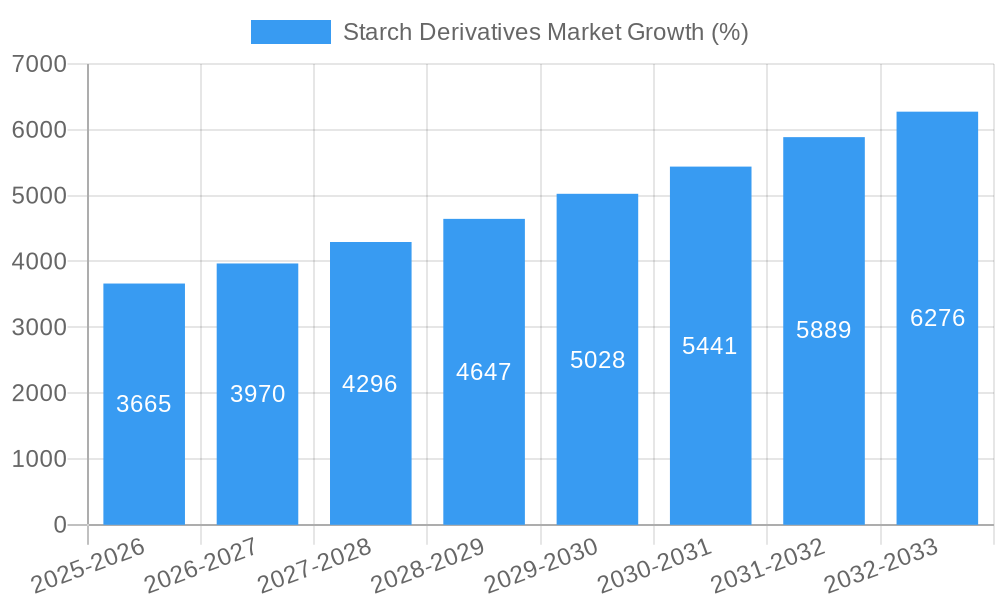
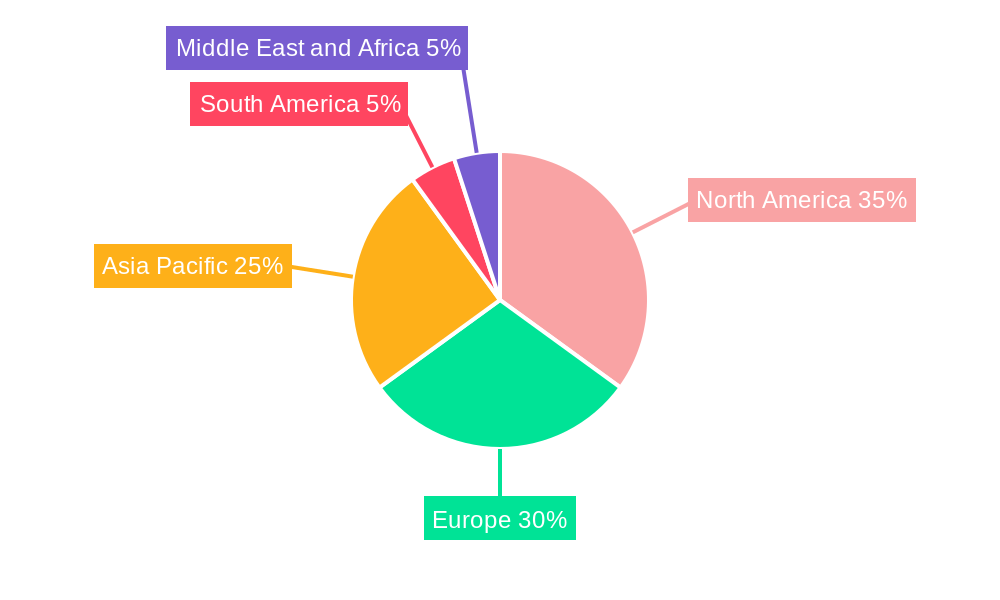
The global starch derivatives market, currently valued at approximately $55.7 billion (2025 estimate), is projected to experience robust growth, exhibiting a Compound Annual Growth Rate (CAGR) of 6.40% from 2025 to 2033. This expansion is fueled by several key factors. Increasing demand from the food and beverage industry, driven by the rising global population and changing dietary preferences, is a major driver. The use of starch derivatives as thickening agents, stabilizers, and sweeteners in processed foods and beverages continues to escalate. Furthermore, the growing pharmaceutical and cosmetic industries are contributing significantly to market growth, as starch derivatives find applications in drug delivery systems and personal care products. Advancements in starch modification technologies, leading to the development of novel products with enhanced functionalities, are also fueling market expansion. The corn-based segment is expected to dominate the source-based market, due to its widespread availability and cost-effectiveness. However, increasing demand for sustainably sourced starch derivatives is driving growth in the cassava and potato segments. Geographical analysis indicates that North America and Europe currently hold significant market shares, but the Asia-Pacific region is poised for substantial growth driven by rapid economic development and rising consumption in developing economies.
Competitive pressures within the market are intense, with several large multinational companies including Cargill, ADM, Roquette, and Tate & Lyle holding significant market shares. However, smaller, specialized players are also contributing to innovation and diversification within the market. While the market faces challenges such as fluctuating raw material prices and increasing regulatory scrutiny related to food safety and sustainability, the overall outlook remains positive. Continued growth in key application segments, coupled with ongoing technological advancements, is expected to drive substantial market expansion throughout the forecast period. The market is expected to see increased consolidation through mergers and acquisitions, as larger players seek to enhance their market share and product portfolios.
Starch Derivatives Market: A Comprehensive Report (2019-2033)
This comprehensive report provides an in-depth analysis of the global Starch Derivatives Market, offering valuable insights for industry professionals, investors, and stakeholders. Covering the period from 2019 to 2033, with a focus on 2025, this report meticulously examines market dynamics, key players, and future growth prospects. The study period is 2019-2033, with 2025 as the base and estimated year, and 2025-2033 as the forecast period. The historical period covered is 2019-2024.
Starch Derivatives Market Structure & Innovation Trends
This section delves into the competitive landscape of the starch derivatives market, analyzing market concentration, innovation drivers, regulatory frameworks, product substitutes, end-user demographics, and M&A activities. The market is moderately consolidated, with key players such as Cargill, ADM, and Roquette holding significant market share. However, the presence of numerous smaller players creates a dynamic competitive environment.
- Market Concentration: The top 5 players account for approximately xx% of the global market share in 2025, indicating a moderately concentrated market.
- Innovation Drivers: Growing demand for sustainable and functional ingredients, coupled with advancements in starch modification technologies, are driving innovation. This includes the development of novel starch derivatives with enhanced properties for various applications.
- Regulatory Frameworks: Stringent food safety regulations and increasing focus on sustainable sourcing are shaping market dynamics. Compliance with these regulations is crucial for market participation.
- Product Substitutes: Competitors from other sectors, such as synthetic polymers and other natural polymers, present challenges, requiring continuous product innovation and competitive pricing strategies.
- End-User Demographics: The food and beverage industry remains a dominant end-user segment, with significant growth expected in the pharmaceutical and bioethanol sectors.
- M&A Activities: The market has witnessed significant M&A activity in recent years, with deal values exceeding xx Million in 2024. These activities are driven by players seeking to expand their product portfolios and market reach.
Starch Derivatives Market Dynamics & Trends
This section explores the key factors driving market growth, technological disruptions, consumer preferences, and competitive dynamics. The global Starch Derivatives market is expected to witness robust growth, driven by increasing demand from various end-use industries. Factors such as rising disposable incomes, changing dietary habits, and the growing popularity of convenience foods are contributing to market expansion.
The market is experiencing a CAGR of xx% during the forecast period (2025-2033). Market penetration of starch derivatives in novel applications is also increasing, particularly in the bio-based materials and pharmaceutical sectors. Technological advancements in starch modification, enabling the creation of customized derivatives with specific functionalities, further propel market growth. Competitive dynamics are characterized by both intense rivalry among established players and the emergence of new entrants. Pricing strategies, product differentiation, and investments in R&D play a crucial role in determining market share.
Dominant Regions & Segments in Starch Derivatives Market
This section analyzes the leading regions and segments within the Starch Derivatives market. The market is geographically diverse, with strong presence across various regions.
By Type:
- Maltodextrin: The largest segment by type, driven by its wide applications in the food and beverage industry as a sweetener and thickening agent.
- Modified Starch: This segment is witnessing significant growth due to advancements in modification techniques and the development of value-added products.
- Glucose Syrups: Another major segment, primarily used in the food and beverage sector.
- Others: This includes smaller segments, like Cyclodextrins, and Hydrolysates. These segments have niche applications, and their growth rates are relatively modest but with notable potential.
By Source:
- Corn: The dominant source of starch derivatives, owing to its high starch content and cost-effectiveness.
- Potato: This segment is witnessing increasing demand due to the production of functional starch-based products.
- Other Sources: This include sources like wheat, cassava, and tapioca, offering diverse opportunities.
By Application:
- Food and Beverage: This is the dominant application segment, owing to the widespread use of starch derivatives as thickeners, stabilizers, and sweeteners.
- Feed: The animal feed industry is also a substantial consumer of starch derivatives, due to their nutritional value.
- Other Industrial Applications: This includes applications in paper, textiles, and pharmaceuticals.
Key drivers for dominance include:
- Favorable economic policies: Government support for agricultural production and food processing industries in certain regions contributes to the growth.
- Well-developed infrastructure: Efficient transportation networks facilitate the movement of raw materials and finished products, reducing costs.
Starch Derivatives Market Product Innovations
Recent product innovations focus on developing starch derivatives with enhanced functionality, such as improved solubility, viscosity, and stability. This includes the development of novel starch derivatives for specific applications, e.g., biodegradable films in packaging and high-performance materials in the pharmaceutical sector. These innovations are driven by technological advancements in starch modification and a growing demand for high-value, functional ingredients. Improved processing technologies also contribute to cost-effectiveness and enhanced product quality, driving market competitiveness.
Report Scope & Segmentation Analysis
This report comprehensively covers the starch derivatives market, segmented by type (maltodextrin, cyclodextrin, glucose syrups, hydrolysates, modified starch, others), source (corn, wheat, cassava, potato, other sources), and application (food and beverage, feed, paper industry, pharmaceutical industry, bioethanol, cosmetics, other industrial applications). Each segment's growth projections, market sizes, and competitive dynamics are analyzed in detail. Growth is expected to be driven primarily by increasing demand in the food and beverage and pharmaceutical sectors, with emerging opportunities in bio-based materials and bioplastics.
Key Drivers of Starch Derivatives Market Growth
Key growth drivers include:
- Rising demand for processed foods.
- Increasing use in various industries.
- Technological advancements in starch modification.
- Growing focus on sustainable and renewable materials.
- Favourable government policies.
Challenges in the Starch Derivatives Market Sector
Challenges faced by this sector include:
- Fluctuations in raw material prices, particularly corn.
- Stringent food safety regulations.
- Competition from synthetic alternatives.
- Supply chain disruptions.
Emerging Opportunities in Starch Derivatives Market
Emerging opportunities lie in:
- Bio-based plastics and packaging.
- Novel applications in pharmaceuticals and cosmetics.
- Development of high-value, functional starch derivatives.
- Expansion into emerging markets.
Leading Players in the Starch Derivatives Market Market
- Cargill Incorporated
- Archer Daniels Midland Company
- Roquette
- Tate & Lyle PLC
- Royal Avebe U A (Avebe Nutrition)
- Tereos S A
- Ingredion Incorporated
- Beneo
- Cumberland Packing Corp
- Glycom
Key Developments in Starch Derivatives Market Industry
- 2023 Q3: Cargill announces investment in new starch processing facilities.
- 2022 Q4: Archer Daniels Midland acquires a biotech company specializing in starch modification.
- 2021 Q2: Roquette expands its focus on sustainable starch production and biopolymer applications.
Future Outlook for Starch Derivatives Market Market
The Starch Derivatives market is poised for continued growth, fueled by increasing demand from key sectors, technological innovations, and the growing focus on sustainable and renewable resources. Strategic partnerships and investments in R&D are likely to play a significant role in shaping the future competitive landscape. The development of novel starch derivatives with tailored functionalities will open new avenues for growth. Focus on sustainability and circular economy principles will also drive innovation and growth in the coming years.
Starch Derivatives Market Segmentation
-
1. Type
- 1.1. Maltodextrin
- 1.2. Cyclodextrin
- 1.3. Glucose Syrups
- 1.4. Hydrolysates
- 1.5. Modified Starch
- 1.6. Others
-
2. Source
- 2.1. Corn
- 2.2. Wheat
- 2.3. Cassava
- 2.4. Potato
- 2.5. Other Sources
-
3. Application
- 3.1. Food and Beverage
- 3.2. Feed
- 3.3. Paper Industry
- 3.4. Pharmaceutical Industry
- 3.5. Bioethanol
- 3.6. Cosmetics
- 3.7. Other Industrial Applications
Starch Derivatives Market Segmentation By Geography
-
1. North America
- 1.1. United States
- 1.2. Canada
- 1.3. Mexico
- 1.4. Rest of North America
-
2. Europe
- 2.1. Spain
- 2.2. United Kingdom
- 2.3. France
- 2.4. Germany
- 2.5. Russia
- 2.6. Italy
- 2.7. Rest of Europe
-
3. Asia Pacific
- 3.1. China
- 3.2. Japan
- 3.3. India
- 3.4. Singapore
- 3.5. Australia
- 3.6. Rest of Asia Pacific
-
4. South America
- 4.1. Brazil
- 4.2. Argentina
- 4.3. Rest of South America
-
5. Middle East and Africa
- 5.1. South Africa
- 5.2. United Arab Emirates
- 5.3. Saudi Arabia
- 5.4. Rest of Middle East
Starch Derivatives Market REPORT HIGHLIGHTS
| Aspects | Details |
|---|---|
| Study Period | 2019-2033 |
| Base Year | 2024 |
| Estimated Year | 2025 |
| Forecast Period | 2025-2033 |
| Historical Period | 2019-2024 |
| Growth Rate | CAGR of 6.40% from 2019-2033 |
| Segmentation |
|
Table of Contents
- 1. Introduction
- 1.1. Research Scope
- 1.2. Market Segmentation
- 1.3. Research Methodology
- 1.4. Definitions and Assumptions
- 2. Executive Summary
- 2.1. Introduction
- 3. Market Dynamics
- 3.1. Introduction
- 3.2. Market Drivers
- 3.2.1. Inclination Towards Fitness and Increasing Intake of Plant-based Protein; Increase in Consumer Inclination Towards Meat Substitutes
- 3.3. Market Restrains
- 3.3.1. Gluten-Intolerance Among the Population Hindering the Market
- 3.4. Market Trends
- 3.4.1. Modified Starch is Strongly Accelerating the Overall Market For Starch Derivatives
- 4. Market Factor Analysis
- 4.1. Porters Five Forces
- 4.2. Supply/Value Chain
- 4.3. PESTEL analysis
- 4.4. Market Entropy
- 4.5. Patent/Trademark Analysis
- 5. Global Starch Derivatives Market Analysis, Insights and Forecast, 2019-2031
- 5.1. Market Analysis, Insights and Forecast - by Type
- 5.1.1. Maltodextrin
- 5.1.2. Cyclodextrin
- 5.1.3. Glucose Syrups
- 5.1.4. Hydrolysates
- 5.1.5. Modified Starch
- 5.1.6. Others
- 5.2. Market Analysis, Insights and Forecast - by Source
- 5.2.1. Corn
- 5.2.2. Wheat
- 5.2.3. Cassava
- 5.2.4. Potato
- 5.2.5. Other Sources
- 5.3. Market Analysis, Insights and Forecast - by Application
- 5.3.1. Food and Beverage
- 5.3.2. Feed
- 5.3.3. Paper Industry
- 5.3.4. Pharmaceutical Industry
- 5.3.5. Bioethanol
- 5.3.6. Cosmetics
- 5.3.7. Other Industrial Applications
- 5.4. Market Analysis, Insights and Forecast - by Region
- 5.4.1. North America
- 5.4.2. Europe
- 5.4.3. Asia Pacific
- 5.4.4. South America
- 5.4.5. Middle East and Africa
- 5.1. Market Analysis, Insights and Forecast - by Type
- 6. North America Starch Derivatives Market Analysis, Insights and Forecast, 2019-2031
- 6.1. Market Analysis, Insights and Forecast - by Type
- 6.1.1. Maltodextrin
- 6.1.2. Cyclodextrin
- 6.1.3. Glucose Syrups
- 6.1.4. Hydrolysates
- 6.1.5. Modified Starch
- 6.1.6. Others
- 6.2. Market Analysis, Insights and Forecast - by Source
- 6.2.1. Corn
- 6.2.2. Wheat
- 6.2.3. Cassava
- 6.2.4. Potato
- 6.2.5. Other Sources
- 6.3. Market Analysis, Insights and Forecast - by Application
- 6.3.1. Food and Beverage
- 6.3.2. Feed
- 6.3.3. Paper Industry
- 6.3.4. Pharmaceutical Industry
- 6.3.5. Bioethanol
- 6.3.6. Cosmetics
- 6.3.7. Other Industrial Applications
- 6.1. Market Analysis, Insights and Forecast - by Type
- 7. Europe Starch Derivatives Market Analysis, Insights and Forecast, 2019-2031
- 7.1. Market Analysis, Insights and Forecast - by Type
- 7.1.1. Maltodextrin
- 7.1.2. Cyclodextrin
- 7.1.3. Glucose Syrups
- 7.1.4. Hydrolysates
- 7.1.5. Modified Starch
- 7.1.6. Others
- 7.2. Market Analysis, Insights and Forecast - by Source
- 7.2.1. Corn
- 7.2.2. Wheat
- 7.2.3. Cassava
- 7.2.4. Potato
- 7.2.5. Other Sources
- 7.3. Market Analysis, Insights and Forecast - by Application
- 7.3.1. Food and Beverage
- 7.3.2. Feed
- 7.3.3. Paper Industry
- 7.3.4. Pharmaceutical Industry
- 7.3.5. Bioethanol
- 7.3.6. Cosmetics
- 7.3.7. Other Industrial Applications
- 7.1. Market Analysis, Insights and Forecast - by Type
- 8. Asia Pacific Starch Derivatives Market Analysis, Insights and Forecast, 2019-2031
- 8.1. Market Analysis, Insights and Forecast - by Type
- 8.1.1. Maltodextrin
- 8.1.2. Cyclodextrin
- 8.1.3. Glucose Syrups
- 8.1.4. Hydrolysates
- 8.1.5. Modified Starch
- 8.1.6. Others
- 8.2. Market Analysis, Insights and Forecast - by Source
- 8.2.1. Corn
- 8.2.2. Wheat
- 8.2.3. Cassava
- 8.2.4. Potato
- 8.2.5. Other Sources
- 8.3. Market Analysis, Insights and Forecast - by Application
- 8.3.1. Food and Beverage
- 8.3.2. Feed
- 8.3.3. Paper Industry
- 8.3.4. Pharmaceutical Industry
- 8.3.5. Bioethanol
- 8.3.6. Cosmetics
- 8.3.7. Other Industrial Applications
- 8.1. Market Analysis, Insights and Forecast - by Type
- 9. South America Starch Derivatives Market Analysis, Insights and Forecast, 2019-2031
- 9.1. Market Analysis, Insights and Forecast - by Type
- 9.1.1. Maltodextrin
- 9.1.2. Cyclodextrin
- 9.1.3. Glucose Syrups
- 9.1.4. Hydrolysates
- 9.1.5. Modified Starch
- 9.1.6. Others
- 9.2. Market Analysis, Insights and Forecast - by Source
- 9.2.1. Corn
- 9.2.2. Wheat
- 9.2.3. Cassava
- 9.2.4. Potato
- 9.2.5. Other Sources
- 9.3. Market Analysis, Insights and Forecast - by Application
- 9.3.1. Food and Beverage
- 9.3.2. Feed
- 9.3.3. Paper Industry
- 9.3.4. Pharmaceutical Industry
- 9.3.5. Bioethanol
- 9.3.6. Cosmetics
- 9.3.7. Other Industrial Applications
- 9.1. Market Analysis, Insights and Forecast - by Type
- 10. Middle East and Africa Starch Derivatives Market Analysis, Insights and Forecast, 2019-2031
- 10.1. Market Analysis, Insights and Forecast - by Type
- 10.1.1. Maltodextrin
- 10.1.2. Cyclodextrin
- 10.1.3. Glucose Syrups
- 10.1.4. Hydrolysates
- 10.1.5. Modified Starch
- 10.1.6. Others
- 10.2. Market Analysis, Insights and Forecast - by Source
- 10.2.1. Corn
- 10.2.2. Wheat
- 10.2.3. Cassava
- 10.2.4. Potato
- 10.2.5. Other Sources
- 10.3. Market Analysis, Insights and Forecast - by Application
- 10.3.1. Food and Beverage
- 10.3.2. Feed
- 10.3.3. Paper Industry
- 10.3.4. Pharmaceutical Industry
- 10.3.5. Bioethanol
- 10.3.6. Cosmetics
- 10.3.7. Other Industrial Applications
- 10.1. Market Analysis, Insights and Forecast - by Type
- 11. North America Starch Derivatives Market Analysis, Insights and Forecast, 2019-2031
- 11.1. Market Analysis, Insights and Forecast - By Country/Sub-region
- 11.1.1 United States
- 11.1.2 Canada
- 11.1.3 Mexico
- 11.1.4 Rest of North America
- 12. Europe Starch Derivatives Market Analysis, Insights and Forecast, 2019-2031
- 12.1. Market Analysis, Insights and Forecast - By Country/Sub-region
- 12.1.1 Spain
- 12.1.2 United Kingdom
- 12.1.3 France
- 12.1.4 Germany
- 12.1.5 Russia
- 12.1.6 Italy
- 12.1.7 Rest of Europe
- 13. Asia Pacific Starch Derivatives Market Analysis, Insights and Forecast, 2019-2031
- 13.1. Market Analysis, Insights and Forecast - By Country/Sub-region
- 13.1.1 China
- 13.1.2 Japan
- 13.1.3 India
- 13.1.4 Singapore
- 13.1.5 Australia
- 13.1.6 Rest of Asia Pacific
- 14. South America Starch Derivatives Market Analysis, Insights and Forecast, 2019-2031
- 14.1. Market Analysis, Insights and Forecast - By Country/Sub-region
- 14.1.1 Brazil
- 14.1.2 Argentina
- 14.1.3 Rest of South America
- 15. Middle East and Africa Starch Derivatives Market Analysis, Insights and Forecast, 2019-2031
- 15.1. Market Analysis, Insights and Forecast - By Country/Sub-region
- 15.1.1 South Africa
- 15.1.2 United Arab Emirates
- 15.1.3 Saudi Arabia
- 15.1.4 Rest of Middle East
- 16. Competitive Analysis
- 16.1. Global Market Share Analysis 2024
- 16.2. Company Profiles
- 16.2.1 Cargill Incorporated
- 16.2.1.1. Overview
- 16.2.1.2. Products
- 16.2.1.3. SWOT Analysis
- 16.2.1.4. Recent Developments
- 16.2.1.5. Financials (Based on Availability)
- 16.2.2 Archer Daniels Midland Company
- 16.2.2.1. Overview
- 16.2.2.2. Products
- 16.2.2.3. SWOT Analysis
- 16.2.2.4. Recent Developments
- 16.2.2.5. Financials (Based on Availability)
- 16.2.3 Roquette
- 16.2.3.1. Overview
- 16.2.3.2. Products
- 16.2.3.3. SWOT Analysis
- 16.2.3.4. Recent Developments
- 16.2.3.5. Financials (Based on Availability)
- 16.2.4 Tate & Lyle PLC
- 16.2.4.1. Overview
- 16.2.4.2. Products
- 16.2.4.3. SWOT Analysis
- 16.2.4.4. Recent Developments
- 16.2.4.5. Financials (Based on Availability)
- 16.2.5 Royal Avebe U A (Avebe Nutrition)
- 16.2.5.1. Overview
- 16.2.5.2. Products
- 16.2.5.3. SWOT Analysis
- 16.2.5.4. Recent Developments
- 16.2.5.5. Financials (Based on Availability)
- 16.2.6 Tereos S A*List Not Exhaustive
- 16.2.6.1. Overview
- 16.2.6.2. Products
- 16.2.6.3. SWOT Analysis
- 16.2.6.4. Recent Developments
- 16.2.6.5. Financials (Based on Availability)
- 16.2.7 Ingredion Incorporated
- 16.2.7.1. Overview
- 16.2.7.2. Products
- 16.2.7.3. SWOT Analysis
- 16.2.7.4. Recent Developments
- 16.2.7.5. Financials (Based on Availability)
- 16.2.8 Beneo
- 16.2.8.1. Overview
- 16.2.8.2. Products
- 16.2.8.3. SWOT Analysis
- 16.2.8.4. Recent Developments
- 16.2.8.5. Financials (Based on Availability)
- 16.2.9 Cumberland Packing Corp
- 16.2.9.1. Overview
- 16.2.9.2. Products
- 16.2.9.3. SWOT Analysis
- 16.2.9.4. Recent Developments
- 16.2.9.5. Financials (Based on Availability)
- 16.2.10 Glycom
- 16.2.10.1. Overview
- 16.2.10.2. Products
- 16.2.10.3. SWOT Analysis
- 16.2.10.4. Recent Developments
- 16.2.10.5. Financials (Based on Availability)
- 16.2.1 Cargill Incorporated
List of Figures
- Figure 1: Global Starch Derivatives Market Revenue Breakdown (Million, %) by Region 2024 & 2032
- Figure 2: Global Starch Derivatives Market Volume Breakdown (K Tons, %) by Region 2024 & 2032
- Figure 3: North America Starch Derivatives Market Revenue (Million), by Country 2024 & 2032
- Figure 4: North America Starch Derivatives Market Volume (K Tons), by Country 2024 & 2032
- Figure 5: North America Starch Derivatives Market Revenue Share (%), by Country 2024 & 2032
- Figure 6: North America Starch Derivatives Market Volume Share (%), by Country 2024 & 2032
- Figure 7: Europe Starch Derivatives Market Revenue (Million), by Country 2024 & 2032
- Figure 8: Europe Starch Derivatives Market Volume (K Tons), by Country 2024 & 2032
- Figure 9: Europe Starch Derivatives Market Revenue Share (%), by Country 2024 & 2032
- Figure 10: Europe Starch Derivatives Market Volume Share (%), by Country 2024 & 2032
- Figure 11: Asia Pacific Starch Derivatives Market Revenue (Million), by Country 2024 & 2032
- Figure 12: Asia Pacific Starch Derivatives Market Volume (K Tons), by Country 2024 & 2032
- Figure 13: Asia Pacific Starch Derivatives Market Revenue Share (%), by Country 2024 & 2032
- Figure 14: Asia Pacific Starch Derivatives Market Volume Share (%), by Country 2024 & 2032
- Figure 15: South America Starch Derivatives Market Revenue (Million), by Country 2024 & 2032
- Figure 16: South America Starch Derivatives Market Volume (K Tons), by Country 2024 & 2032
- Figure 17: South America Starch Derivatives Market Revenue Share (%), by Country 2024 & 2032
- Figure 18: South America Starch Derivatives Market Volume Share (%), by Country 2024 & 2032
- Figure 19: Middle East and Africa Starch Derivatives Market Revenue (Million), by Country 2024 & 2032
- Figure 20: Middle East and Africa Starch Derivatives Market Volume (K Tons), by Country 2024 & 2032
- Figure 21: Middle East and Africa Starch Derivatives Market Revenue Share (%), by Country 2024 & 2032
- Figure 22: Middle East and Africa Starch Derivatives Market Volume Share (%), by Country 2024 & 2032
- Figure 23: North America Starch Derivatives Market Revenue (Million), by Type 2024 & 2032
- Figure 24: North America Starch Derivatives Market Volume (K Tons), by Type 2024 & 2032
- Figure 25: North America Starch Derivatives Market Revenue Share (%), by Type 2024 & 2032
- Figure 26: North America Starch Derivatives Market Volume Share (%), by Type 2024 & 2032
- Figure 27: North America Starch Derivatives Market Revenue (Million), by Source 2024 & 2032
- Figure 28: North America Starch Derivatives Market Volume (K Tons), by Source 2024 & 2032
- Figure 29: North America Starch Derivatives Market Revenue Share (%), by Source 2024 & 2032
- Figure 30: North America Starch Derivatives Market Volume Share (%), by Source 2024 & 2032
- Figure 31: North America Starch Derivatives Market Revenue (Million), by Application 2024 & 2032
- Figure 32: North America Starch Derivatives Market Volume (K Tons), by Application 2024 & 2032
- Figure 33: North America Starch Derivatives Market Revenue Share (%), by Application 2024 & 2032
- Figure 34: North America Starch Derivatives Market Volume Share (%), by Application 2024 & 2032
- Figure 35: North America Starch Derivatives Market Revenue (Million), by Country 2024 & 2032
- Figure 36: North America Starch Derivatives Market Volume (K Tons), by Country 2024 & 2032
- Figure 37: North America Starch Derivatives Market Revenue Share (%), by Country 2024 & 2032
- Figure 38: North America Starch Derivatives Market Volume Share (%), by Country 2024 & 2032
- Figure 39: Europe Starch Derivatives Market Revenue (Million), by Type 2024 & 2032
- Figure 40: Europe Starch Derivatives Market Volume (K Tons), by Type 2024 & 2032
- Figure 41: Europe Starch Derivatives Market Revenue Share (%), by Type 2024 & 2032
- Figure 42: Europe Starch Derivatives Market Volume Share (%), by Type 2024 & 2032
- Figure 43: Europe Starch Derivatives Market Revenue (Million), by Source 2024 & 2032
- Figure 44: Europe Starch Derivatives Market Volume (K Tons), by Source 2024 & 2032
- Figure 45: Europe Starch Derivatives Market Revenue Share (%), by Source 2024 & 2032
- Figure 46: Europe Starch Derivatives Market Volume Share (%), by Source 2024 & 2032
- Figure 47: Europe Starch Derivatives Market Revenue (Million), by Application 2024 & 2032
- Figure 48: Europe Starch Derivatives Market Volume (K Tons), by Application 2024 & 2032
- Figure 49: Europe Starch Derivatives Market Revenue Share (%), by Application 2024 & 2032
- Figure 50: Europe Starch Derivatives Market Volume Share (%), by Application 2024 & 2032
- Figure 51: Europe Starch Derivatives Market Revenue (Million), by Country 2024 & 2032
- Figure 52: Europe Starch Derivatives Market Volume (K Tons), by Country 2024 & 2032
- Figure 53: Europe Starch Derivatives Market Revenue Share (%), by Country 2024 & 2032
- Figure 54: Europe Starch Derivatives Market Volume Share (%), by Country 2024 & 2032
- Figure 55: Asia Pacific Starch Derivatives Market Revenue (Million), by Type 2024 & 2032
- Figure 56: Asia Pacific Starch Derivatives Market Volume (K Tons), by Type 2024 & 2032
- Figure 57: Asia Pacific Starch Derivatives Market Revenue Share (%), by Type 2024 & 2032
- Figure 58: Asia Pacific Starch Derivatives Market Volume Share (%), by Type 2024 & 2032
- Figure 59: Asia Pacific Starch Derivatives Market Revenue (Million), by Source 2024 & 2032
- Figure 60: Asia Pacific Starch Derivatives Market Volume (K Tons), by Source 2024 & 2032
- Figure 61: Asia Pacific Starch Derivatives Market Revenue Share (%), by Source 2024 & 2032
- Figure 62: Asia Pacific Starch Derivatives Market Volume Share (%), by Source 2024 & 2032
- Figure 63: Asia Pacific Starch Derivatives Market Revenue (Million), by Application 2024 & 2032
- Figure 64: Asia Pacific Starch Derivatives Market Volume (K Tons), by Application 2024 & 2032
- Figure 65: Asia Pacific Starch Derivatives Market Revenue Share (%), by Application 2024 & 2032
- Figure 66: Asia Pacific Starch Derivatives Market Volume Share (%), by Application 2024 & 2032
- Figure 67: Asia Pacific Starch Derivatives Market Revenue (Million), by Country 2024 & 2032
- Figure 68: Asia Pacific Starch Derivatives Market Volume (K Tons), by Country 2024 & 2032
- Figure 69: Asia Pacific Starch Derivatives Market Revenue Share (%), by Country 2024 & 2032
- Figure 70: Asia Pacific Starch Derivatives Market Volume Share (%), by Country 2024 & 2032
- Figure 71: South America Starch Derivatives Market Revenue (Million), by Type 2024 & 2032
- Figure 72: South America Starch Derivatives Market Volume (K Tons), by Type 2024 & 2032
- Figure 73: South America Starch Derivatives Market Revenue Share (%), by Type 2024 & 2032
- Figure 74: South America Starch Derivatives Market Volume Share (%), by Type 2024 & 2032
- Figure 75: South America Starch Derivatives Market Revenue (Million), by Source 2024 & 2032
- Figure 76: South America Starch Derivatives Market Volume (K Tons), by Source 2024 & 2032
- Figure 77: South America Starch Derivatives Market Revenue Share (%), by Source 2024 & 2032
- Figure 78: South America Starch Derivatives Market Volume Share (%), by Source 2024 & 2032
- Figure 79: South America Starch Derivatives Market Revenue (Million), by Application 2024 & 2032
- Figure 80: South America Starch Derivatives Market Volume (K Tons), by Application 2024 & 2032
- Figure 81: South America Starch Derivatives Market Revenue Share (%), by Application 2024 & 2032
- Figure 82: South America Starch Derivatives Market Volume Share (%), by Application 2024 & 2032
- Figure 83: South America Starch Derivatives Market Revenue (Million), by Country 2024 & 2032
- Figure 84: South America Starch Derivatives Market Volume (K Tons), by Country 2024 & 2032
- Figure 85: South America Starch Derivatives Market Revenue Share (%), by Country 2024 & 2032
- Figure 86: South America Starch Derivatives Market Volume Share (%), by Country 2024 & 2032
- Figure 87: Middle East and Africa Starch Derivatives Market Revenue (Million), by Type 2024 & 2032
- Figure 88: Middle East and Africa Starch Derivatives Market Volume (K Tons), by Type 2024 & 2032
- Figure 89: Middle East and Africa Starch Derivatives Market Revenue Share (%), by Type 2024 & 2032
- Figure 90: Middle East and Africa Starch Derivatives Market Volume Share (%), by Type 2024 & 2032
- Figure 91: Middle East and Africa Starch Derivatives Market Revenue (Million), by Source 2024 & 2032
- Figure 92: Middle East and Africa Starch Derivatives Market Volume (K Tons), by Source 2024 & 2032
- Figure 93: Middle East and Africa Starch Derivatives Market Revenue Share (%), by Source 2024 & 2032
- Figure 94: Middle East and Africa Starch Derivatives Market Volume Share (%), by Source 2024 & 2032
- Figure 95: Middle East and Africa Starch Derivatives Market Revenue (Million), by Application 2024 & 2032
- Figure 96: Middle East and Africa Starch Derivatives Market Volume (K Tons), by Application 2024 & 2032
- Figure 97: Middle East and Africa Starch Derivatives Market Revenue Share (%), by Application 2024 & 2032
- Figure 98: Middle East and Africa Starch Derivatives Market Volume Share (%), by Application 2024 & 2032
- Figure 99: Middle East and Africa Starch Derivatives Market Revenue (Million), by Country 2024 & 2032
- Figure 100: Middle East and Africa Starch Derivatives Market Volume (K Tons), by Country 2024 & 2032
- Figure 101: Middle East and Africa Starch Derivatives Market Revenue Share (%), by Country 2024 & 2032
- Figure 102: Middle East and Africa Starch Derivatives Market Volume Share (%), by Country 2024 & 2032
List of Tables
- Table 1: Global Starch Derivatives Market Revenue Million Forecast, by Region 2019 & 2032
- Table 2: Global Starch Derivatives Market Volume K Tons Forecast, by Region 2019 & 2032
- Table 3: Global Starch Derivatives Market Revenue Million Forecast, by Type 2019 & 2032
- Table 4: Global Starch Derivatives Market Volume K Tons Forecast, by Type 2019 & 2032
- Table 5: Global Starch Derivatives Market Revenue Million Forecast, by Source 2019 & 2032
- Table 6: Global Starch Derivatives Market Volume K Tons Forecast, by Source 2019 & 2032
- Table 7: Global Starch Derivatives Market Revenue Million Forecast, by Application 2019 & 2032
- Table 8: Global Starch Derivatives Market Volume K Tons Forecast, by Application 2019 & 2032
- Table 9: Global Starch Derivatives Market Revenue Million Forecast, by Region 2019 & 2032
- Table 10: Global Starch Derivatives Market Volume K Tons Forecast, by Region 2019 & 2032
- Table 11: Global Starch Derivatives Market Revenue Million Forecast, by Country 2019 & 2032
- Table 12: Global Starch Derivatives Market Volume K Tons Forecast, by Country 2019 & 2032
- Table 13: United States Starch Derivatives Market Revenue (Million) Forecast, by Application 2019 & 2032
- Table 14: United States Starch Derivatives Market Volume (K Tons) Forecast, by Application 2019 & 2032
- Table 15: Canada Starch Derivatives Market Revenue (Million) Forecast, by Application 2019 & 2032
- Table 16: Canada Starch Derivatives Market Volume (K Tons) Forecast, by Application 2019 & 2032
- Table 17: Mexico Starch Derivatives Market Revenue (Million) Forecast, by Application 2019 & 2032
- Table 18: Mexico Starch Derivatives Market Volume (K Tons) Forecast, by Application 2019 & 2032
- Table 19: Rest of North America Starch Derivatives Market Revenue (Million) Forecast, by Application 2019 & 2032
- Table 20: Rest of North America Starch Derivatives Market Volume (K Tons) Forecast, by Application 2019 & 2032
- Table 21: Global Starch Derivatives Market Revenue Million Forecast, by Country 2019 & 2032
- Table 22: Global Starch Derivatives Market Volume K Tons Forecast, by Country 2019 & 2032
- Table 23: Spain Starch Derivatives Market Revenue (Million) Forecast, by Application 2019 & 2032
- Table 24: Spain Starch Derivatives Market Volume (K Tons) Forecast, by Application 2019 & 2032
- Table 25: United Kingdom Starch Derivatives Market Revenue (Million) Forecast, by Application 2019 & 2032
- Table 26: United Kingdom Starch Derivatives Market Volume (K Tons) Forecast, by Application 2019 & 2032
- Table 27: France Starch Derivatives Market Revenue (Million) Forecast, by Application 2019 & 2032
- Table 28: France Starch Derivatives Market Volume (K Tons) Forecast, by Application 2019 & 2032
- Table 29: Germany Starch Derivatives Market Revenue (Million) Forecast, by Application 2019 & 2032
- Table 30: Germany Starch Derivatives Market Volume (K Tons) Forecast, by Application 2019 & 2032
- Table 31: Russia Starch Derivatives Market Revenue (Million) Forecast, by Application 2019 & 2032
- Table 32: Russia Starch Derivatives Market Volume (K Tons) Forecast, by Application 2019 & 2032
- Table 33: Italy Starch Derivatives Market Revenue (Million) Forecast, by Application 2019 & 2032
- Table 34: Italy Starch Derivatives Market Volume (K Tons) Forecast, by Application 2019 & 2032
- Table 35: Rest of Europe Starch Derivatives Market Revenue (Million) Forecast, by Application 2019 & 2032
- Table 36: Rest of Europe Starch Derivatives Market Volume (K Tons) Forecast, by Application 2019 & 2032
- Table 37: Global Starch Derivatives Market Revenue Million Forecast, by Country 2019 & 2032
- Table 38: Global Starch Derivatives Market Volume K Tons Forecast, by Country 2019 & 2032
- Table 39: China Starch Derivatives Market Revenue (Million) Forecast, by Application 2019 & 2032
- Table 40: China Starch Derivatives Market Volume (K Tons) Forecast, by Application 2019 & 2032
- Table 41: Japan Starch Derivatives Market Revenue (Million) Forecast, by Application 2019 & 2032
- Table 42: Japan Starch Derivatives Market Volume (K Tons) Forecast, by Application 2019 & 2032
- Table 43: India Starch Derivatives Market Revenue (Million) Forecast, by Application 2019 & 2032
- Table 44: India Starch Derivatives Market Volume (K Tons) Forecast, by Application 2019 & 2032
- Table 45: Singapore Starch Derivatives Market Revenue (Million) Forecast, by Application 2019 & 2032
- Table 46: Singapore Starch Derivatives Market Volume (K Tons) Forecast, by Application 2019 & 2032
- Table 47: Australia Starch Derivatives Market Revenue (Million) Forecast, by Application 2019 & 2032
- Table 48: Australia Starch Derivatives Market Volume (K Tons) Forecast, by Application 2019 & 2032
- Table 49: Rest of Asia Pacific Starch Derivatives Market Revenue (Million) Forecast, by Application 2019 & 2032
- Table 50: Rest of Asia Pacific Starch Derivatives Market Volume (K Tons) Forecast, by Application 2019 & 2032
- Table 51: Global Starch Derivatives Market Revenue Million Forecast, by Country 2019 & 2032
- Table 52: Global Starch Derivatives Market Volume K Tons Forecast, by Country 2019 & 2032
- Table 53: Brazil Starch Derivatives Market Revenue (Million) Forecast, by Application 2019 & 2032
- Table 54: Brazil Starch Derivatives Market Volume (K Tons) Forecast, by Application 2019 & 2032
- Table 55: Argentina Starch Derivatives Market Revenue (Million) Forecast, by Application 2019 & 2032
- Table 56: Argentina Starch Derivatives Market Volume (K Tons) Forecast, by Application 2019 & 2032
- Table 57: Rest of South America Starch Derivatives Market Revenue (Million) Forecast, by Application 2019 & 2032
- Table 58: Rest of South America Starch Derivatives Market Volume (K Tons) Forecast, by Application 2019 & 2032
- Table 59: Global Starch Derivatives Market Revenue Million Forecast, by Country 2019 & 2032
- Table 60: Global Starch Derivatives Market Volume K Tons Forecast, by Country 2019 & 2032
- Table 61: South Africa Starch Derivatives Market Revenue (Million) Forecast, by Application 2019 & 2032
- Table 62: South Africa Starch Derivatives Market Volume (K Tons) Forecast, by Application 2019 & 2032
- Table 63: United Arab Emirates Starch Derivatives Market Revenue (Million) Forecast, by Application 2019 & 2032
- Table 64: United Arab Emirates Starch Derivatives Market Volume (K Tons) Forecast, by Application 2019 & 2032
- Table 65: Saudi Arabia Starch Derivatives Market Revenue (Million) Forecast, by Application 2019 & 2032
- Table 66: Saudi Arabia Starch Derivatives Market Volume (K Tons) Forecast, by Application 2019 & 2032
- Table 67: Rest of Middle East Starch Derivatives Market Revenue (Million) Forecast, by Application 2019 & 2032
- Table 68: Rest of Middle East Starch Derivatives Market Volume (K Tons) Forecast, by Application 2019 & 2032
- Table 69: Global Starch Derivatives Market Revenue Million Forecast, by Type 2019 & 2032
- Table 70: Global Starch Derivatives Market Volume K Tons Forecast, by Type 2019 & 2032
- Table 71: Global Starch Derivatives Market Revenue Million Forecast, by Source 2019 & 2032
- Table 72: Global Starch Derivatives Market Volume K Tons Forecast, by Source 2019 & 2032
- Table 73: Global Starch Derivatives Market Revenue Million Forecast, by Application 2019 & 2032
- Table 74: Global Starch Derivatives Market Volume K Tons Forecast, by Application 2019 & 2032
- Table 75: Global Starch Derivatives Market Revenue Million Forecast, by Country 2019 & 2032
- Table 76: Global Starch Derivatives Market Volume K Tons Forecast, by Country 2019 & 2032
- Table 77: United States Starch Derivatives Market Revenue (Million) Forecast, by Application 2019 & 2032
- Table 78: United States Starch Derivatives Market Volume (K Tons) Forecast, by Application 2019 & 2032
- Table 79: Canada Starch Derivatives Market Revenue (Million) Forecast, by Application 2019 & 2032
- Table 80: Canada Starch Derivatives Market Volume (K Tons) Forecast, by Application 2019 & 2032
- Table 81: Mexico Starch Derivatives Market Revenue (Million) Forecast, by Application 2019 & 2032
- Table 82: Mexico Starch Derivatives Market Volume (K Tons) Forecast, by Application 2019 & 2032
- Table 83: Rest of North America Starch Derivatives Market Revenue (Million) Forecast, by Application 2019 & 2032
- Table 84: Rest of North America Starch Derivatives Market Volume (K Tons) Forecast, by Application 2019 & 2032
- Table 85: Global Starch Derivatives Market Revenue Million Forecast, by Type 2019 & 2032
- Table 86: Global Starch Derivatives Market Volume K Tons Forecast, by Type 2019 & 2032
- Table 87: Global Starch Derivatives Market Revenue Million Forecast, by Source 2019 & 2032
- Table 88: Global Starch Derivatives Market Volume K Tons Forecast, by Source 2019 & 2032
- Table 89: Global Starch Derivatives Market Revenue Million Forecast, by Application 2019 & 2032
- Table 90: Global Starch Derivatives Market Volume K Tons Forecast, by Application 2019 & 2032
- Table 91: Global Starch Derivatives Market Revenue Million Forecast, by Country 2019 & 2032
- Table 92: Global Starch Derivatives Market Volume K Tons Forecast, by Country 2019 & 2032
- Table 93: Spain Starch Derivatives Market Revenue (Million) Forecast, by Application 2019 & 2032
- Table 94: Spain Starch Derivatives Market Volume (K Tons) Forecast, by Application 2019 & 2032
- Table 95: United Kingdom Starch Derivatives Market Revenue (Million) Forecast, by Application 2019 & 2032
- Table 96: United Kingdom Starch Derivatives Market Volume (K Tons) Forecast, by Application 2019 & 2032
- Table 97: France Starch Derivatives Market Revenue (Million) Forecast, by Application 2019 & 2032
- Table 98: France Starch Derivatives Market Volume (K Tons) Forecast, by Application 2019 & 2032
- Table 99: Germany Starch Derivatives Market Revenue (Million) Forecast, by Application 2019 & 2032
- Table 100: Germany Starch Derivatives Market Volume (K Tons) Forecast, by Application 2019 & 2032
- Table 101: Russia Starch Derivatives Market Revenue (Million) Forecast, by Application 2019 & 2032
- Table 102: Russia Starch Derivatives Market Volume (K Tons) Forecast, by Application 2019 & 2032
- Table 103: Italy Starch Derivatives Market Revenue (Million) Forecast, by Application 2019 & 2032
- Table 104: Italy Starch Derivatives Market Volume (K Tons) Forecast, by Application 2019 & 2032
- Table 105: Rest of Europe Starch Derivatives Market Revenue (Million) Forecast, by Application 2019 & 2032
- Table 106: Rest of Europe Starch Derivatives Market Volume (K Tons) Forecast, by Application 2019 & 2032
- Table 107: Global Starch Derivatives Market Revenue Million Forecast, by Type 2019 & 2032
- Table 108: Global Starch Derivatives Market Volume K Tons Forecast, by Type 2019 & 2032
- Table 109: Global Starch Derivatives Market Revenue Million Forecast, by Source 2019 & 2032
- Table 110: Global Starch Derivatives Market Volume K Tons Forecast, by Source 2019 & 2032
- Table 111: Global Starch Derivatives Market Revenue Million Forecast, by Application 2019 & 2032
- Table 112: Global Starch Derivatives Market Volume K Tons Forecast, by Application 2019 & 2032
- Table 113: Global Starch Derivatives Market Revenue Million Forecast, by Country 2019 & 2032
- Table 114: Global Starch Derivatives Market Volume K Tons Forecast, by Country 2019 & 2032
- Table 115: China Starch Derivatives Market Revenue (Million) Forecast, by Application 2019 & 2032
- Table 116: China Starch Derivatives Market Volume (K Tons) Forecast, by Application 2019 & 2032
- Table 117: Japan Starch Derivatives Market Revenue (Million) Forecast, by Application 2019 & 2032
- Table 118: Japan Starch Derivatives Market Volume (K Tons) Forecast, by Application 2019 & 2032
- Table 119: India Starch Derivatives Market Revenue (Million) Forecast, by Application 2019 & 2032
- Table 120: India Starch Derivatives Market Volume (K Tons) Forecast, by Application 2019 & 2032
- Table 121: Singapore Starch Derivatives Market Revenue (Million) Forecast, by Application 2019 & 2032
- Table 122: Singapore Starch Derivatives Market Volume (K Tons) Forecast, by Application 2019 & 2032
- Table 123: Australia Starch Derivatives Market Revenue (Million) Forecast, by Application 2019 & 2032
- Table 124: Australia Starch Derivatives Market Volume (K Tons) Forecast, by Application 2019 & 2032
- Table 125: Rest of Asia Pacific Starch Derivatives Market Revenue (Million) Forecast, by Application 2019 & 2032
- Table 126: Rest of Asia Pacific Starch Derivatives Market Volume (K Tons) Forecast, by Application 2019 & 2032
- Table 127: Global Starch Derivatives Market Revenue Million Forecast, by Type 2019 & 2032
- Table 128: Global Starch Derivatives Market Volume K Tons Forecast, by Type 2019 & 2032
- Table 129: Global Starch Derivatives Market Revenue Million Forecast, by Source 2019 & 2032
- Table 130: Global Starch Derivatives Market Volume K Tons Forecast, by Source 2019 & 2032
- Table 131: Global Starch Derivatives Market Revenue Million Forecast, by Application 2019 & 2032
- Table 132: Global Starch Derivatives Market Volume K Tons Forecast, by Application 2019 & 2032
- Table 133: Global Starch Derivatives Market Revenue Million Forecast, by Country 2019 & 2032
- Table 134: Global Starch Derivatives Market Volume K Tons Forecast, by Country 2019 & 2032
- Table 135: Brazil Starch Derivatives Market Revenue (Million) Forecast, by Application 2019 & 2032
- Table 136: Brazil Starch Derivatives Market Volume (K Tons) Forecast, by Application 2019 & 2032
- Table 137: Argentina Starch Derivatives Market Revenue (Million) Forecast, by Application 2019 & 2032
- Table 138: Argentina Starch Derivatives Market Volume (K Tons) Forecast, by Application 2019 & 2032
- Table 139: Rest of South America Starch Derivatives Market Revenue (Million) Forecast, by Application 2019 & 2032
- Table 140: Rest of South America Starch Derivatives Market Volume (K Tons) Forecast, by Application 2019 & 2032
- Table 141: Global Starch Derivatives Market Revenue Million Forecast, by Type 2019 & 2032
- Table 142: Global Starch Derivatives Market Volume K Tons Forecast, by Type 2019 & 2032
- Table 143: Global Starch Derivatives Market Revenue Million Forecast, by Source 2019 & 2032
- Table 144: Global Starch Derivatives Market Volume K Tons Forecast, by Source 2019 & 2032
- Table 145: Global Starch Derivatives Market Revenue Million Forecast, by Application 2019 & 2032
- Table 146: Global Starch Derivatives Market Volume K Tons Forecast, by Application 2019 & 2032
- Table 147: Global Starch Derivatives Market Revenue Million Forecast, by Country 2019 & 2032
- Table 148: Global Starch Derivatives Market Volume K Tons Forecast, by Country 2019 & 2032
- Table 149: South Africa Starch Derivatives Market Revenue (Million) Forecast, by Application 2019 & 2032
- Table 150: South Africa Starch Derivatives Market Volume (K Tons) Forecast, by Application 2019 & 2032
- Table 151: United Arab Emirates Starch Derivatives Market Revenue (Million) Forecast, by Application 2019 & 2032
- Table 152: United Arab Emirates Starch Derivatives Market Volume (K Tons) Forecast, by Application 2019 & 2032
- Table 153: Saudi Arabia Starch Derivatives Market Revenue (Million) Forecast, by Application 2019 & 2032
- Table 154: Saudi Arabia Starch Derivatives Market Volume (K Tons) Forecast, by Application 2019 & 2032
- Table 155: Rest of Middle East Starch Derivatives Market Revenue (Million) Forecast, by Application 2019 & 2032
- Table 156: Rest of Middle East Starch Derivatives Market Volume (K Tons) Forecast, by Application 2019 & 2032
Frequently Asked Questions
1. What is the projected Compound Annual Growth Rate (CAGR) of the Starch Derivatives Market?
The projected CAGR is approximately 6.40%.
2. Which companies are prominent players in the Starch Derivatives Market?
Key companies in the market include Cargill Incorporated, Archer Daniels Midland Company, Roquette, Tate & Lyle PLC, Royal Avebe U A (Avebe Nutrition), Tereos S A*List Not Exhaustive, Ingredion Incorporated, Beneo, Cumberland Packing Corp, Glycom.
3. What are the main segments of the Starch Derivatives Market?
The market segments include Type, Source, Application.
4. Can you provide details about the market size?
The market size is estimated to be USD 55700 Million as of 2022.
5. What are some drivers contributing to market growth?
Inclination Towards Fitness and Increasing Intake of Plant-based Protein; Increase in Consumer Inclination Towards Meat Substitutes.
6. What are the notable trends driving market growth?
Modified Starch is Strongly Accelerating the Overall Market For Starch Derivatives.
7. Are there any restraints impacting market growth?
Gluten-Intolerance Among the Population Hindering the Market.
8. Can you provide examples of recent developments in the market?
Cargill's investment in new starch processing facilities to meet growing demand
9. What pricing options are available for accessing the report?
Pricing options include single-user, multi-user, and enterprise licenses priced at USD 4750, USD 5250, and USD 8750 respectively.
10. Is the market size provided in terms of value or volume?
The market size is provided in terms of value, measured in Million and volume, measured in K Tons.
11. Are there any specific market keywords associated with the report?
Yes, the market keyword associated with the report is "Starch Derivatives Market," which aids in identifying and referencing the specific market segment covered.
12. How do I determine which pricing option suits my needs best?
The pricing options vary based on user requirements and access needs. Individual users may opt for single-user licenses, while businesses requiring broader access may choose multi-user or enterprise licenses for cost-effective access to the report.
13. Are there any additional resources or data provided in the Starch Derivatives Market report?
While the report offers comprehensive insights, it's advisable to review the specific contents or supplementary materials provided to ascertain if additional resources or data are available.
14. How can I stay updated on further developments or reports in the Starch Derivatives Market?
To stay informed about further developments, trends, and reports in the Starch Derivatives Market, consider subscribing to industry newsletters, following relevant companies and organizations, or regularly checking reputable industry news sources and publications.
Methodology
Step 1 - Identification of Relevant Samples Size from Population Database


Step 2 - Approaches for Defining Global Market Size (Value, Volume* & Price*)

Note*: In applicable scenarios
Step 3 - Data Sources
Primary Research
- Web Analytics
- Survey Reports
- Research Institute
- Latest Research Reports
- Opinion Leaders
Secondary Research
- Annual Reports
- White Paper
- Latest Press Release
- Industry Association
- Paid Database
- Investor Presentations

Step 4 - Data Triangulation
Involves using different sources of information in order to increase the validity of a study
These sources are likely to be stakeholders in a program - participants, other researchers, program staff, other community members, and so on.
Then we put all data in single framework & apply various statistical tools to find out the dynamic on the market.
During the analysis stage, feedback from the stakeholder groups would be compared to determine areas of agreement as well as areas of divergence


