
Key Insights
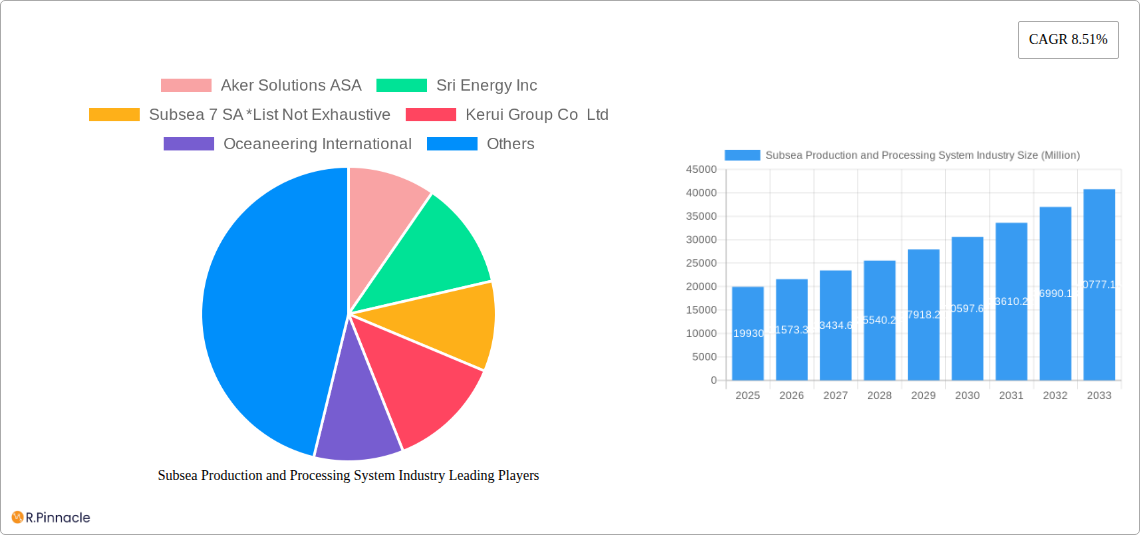
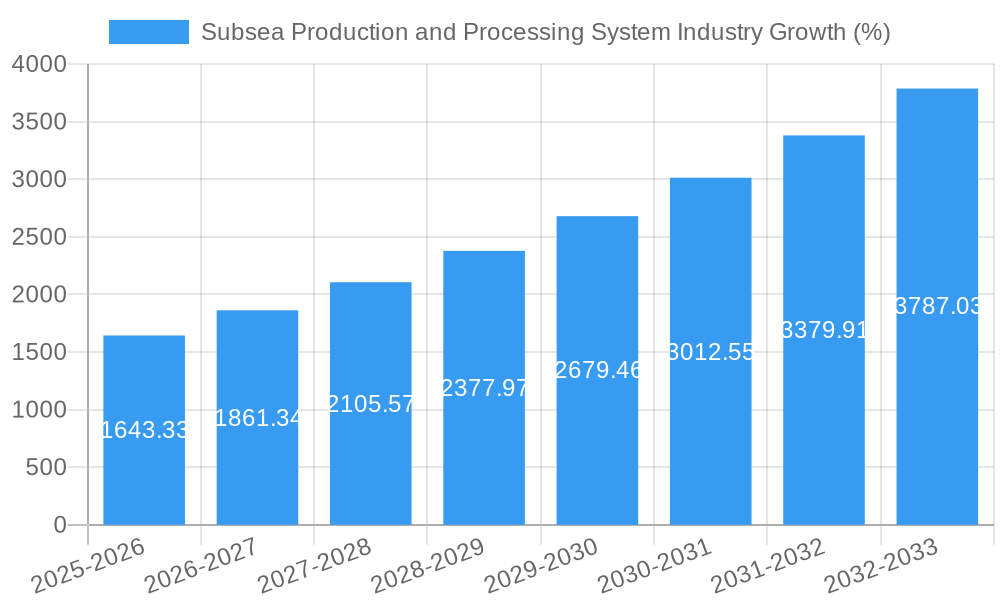
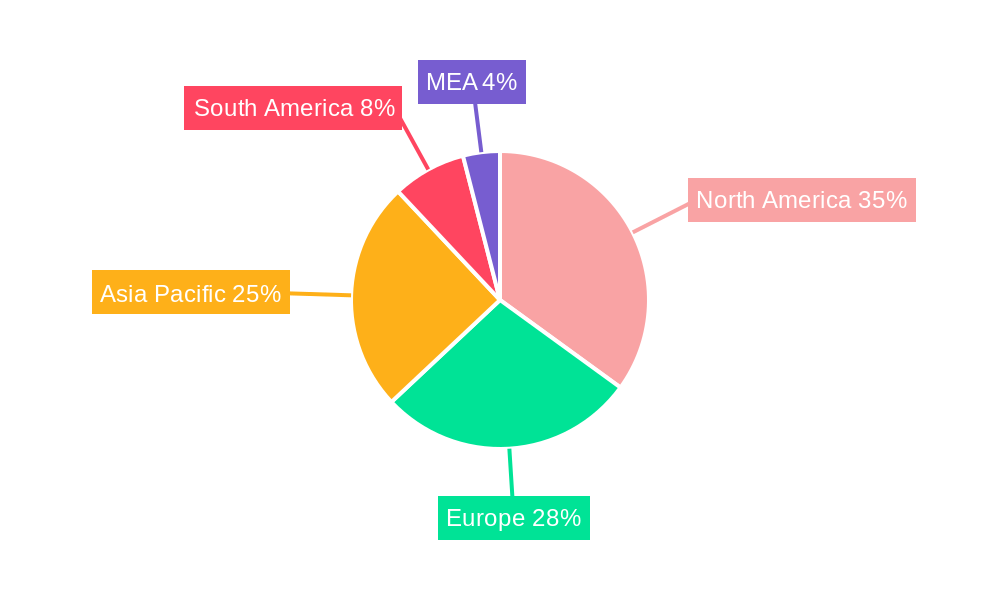
The subsea production and processing system market is experiencing robust growth, projected to reach a value of $19.93 billion in 2025 and maintain a Compound Annual Growth Rate (CAGR) of 8.51% from 2025 to 2033. This expansion is driven by several factors, including the increasing demand for offshore oil and gas resources, advancements in subsea technologies enabling exploration and production in deeper waters (deepwater and ultra-deepwater segments), and a global push towards energy security. The industry's segmentation reflects the complexity of these systems. Subsea trees, umbilicals, risers, and flowlines constitute a significant portion of the production system component market, while boosting, separation, and injection processes dominate the processing system type segment. Geographical distribution reveals strong presence in North America and Europe, driven by established infrastructure and ongoing exploration efforts. The Asia-Pacific region also presents significant growth opportunities due to rising energy consumption and investments in offshore projects. However, challenges remain, including the high capital expenditure associated with deepwater projects, environmental regulations, and fluctuating oil and gas prices, which can impact investment decisions and overall market growth.
The competitive landscape is marked by a mix of established multinational corporations and specialized subsea technology providers. Key players such as Aker Solutions ASA, Subsea 7 SA, Baker Hughes Company, Halliburton Company, and Schlumberger Limited are continuously innovating to improve efficiency, reduce costs, and meet the stringent demands of deepwater operations. The strategic partnerships and mergers and acquisitions within the industry further highlight the competitive intensity and the drive to consolidate market share. Future growth will likely be shaped by technological advancements in areas such as automation, digitalization, and the development of more efficient and environmentally friendly subsea technologies. The growing focus on reducing carbon footprint and adopting sustainable practices will also play a significant role in shaping the market’s trajectory during the forecast period.
Subsea Production and Processing System Industry Market Report: 2019-2033
This comprehensive report provides an in-depth analysis of the Subsea Production and Processing System industry, offering invaluable insights for industry professionals, investors, and strategic decision-makers. The study period covers 2019-2033, with a base year of 2025 and a forecast period of 2025-2033. The report leverages extensive market research to provide a detailed understanding of market dynamics, technological advancements, and competitive landscapes. Expect robust data and analysis on market size (reaching xx Million by 2033), CAGR, and key segment performance, enabling informed strategic planning.
Subsea Production and Processing System Industry Market Structure & Innovation Trends
The subsea production and processing system market is characterized by a moderately concentrated structure, with key players like Aker Solutions ASA, Subsea 7 SA, Oceaneering International, Baker Hughes Company, Halliburton Company, National-Oilwell Varco Inc, Schlumberger Limited, TechnipFMC PLC, Kerui Group Co Ltd, and Sri Energy Inc holding significant market share. However, the market also features numerous smaller specialized companies, creating a dynamic competitive landscape.
Market share distribution varies across segments, with some players dominating specific niches, such as subsea trees or umbilicals. Innovation is driven primarily by the need for enhanced efficiency, reduced operational costs, and the ability to exploit increasingly challenging deepwater resources. This has led to significant R&D investment in areas like automation, remote operation, and advanced materials.
Regulatory frameworks, particularly concerning environmental protection and safety standards, heavily influence market operations. The industry frequently faces stringent regulations related to emissions, waste disposal, and operational safety, leading to compliance costs and innovation in environmentally friendly technologies. M&A activity within the sector has been considerable in recent years, with deal values exceeding xx Million in several instances. These transactions often focus on consolidating market share, acquiring specialized technologies, and expanding geographical reach.
Subsea Production and Processing System Industry Market Dynamics & Trends
The global subsea production and processing system market is experiencing robust growth, driven by several factors. The exploration and production of oil and gas reserves in deepwater and ultra-deepwater environments are significant growth engines. As readily accessible resources deplete, operators are increasingly reliant on subsea technologies to access these challenging locations. Technological advancements are also key, with innovations like improved remotely operated vehicles (ROVs), autonomous underwater vehicles (AUVs), and advanced sensors contributing to higher efficiency, lower costs, and greater safety in subsea operations. These advancements are pushing the boundaries of what's feasible in subsea exploration and production, unlocking new resource potential.
Furthermore, increasing demand for energy globally and the shift towards efficient energy production methods contribute to market growth. The market penetration of subsea production systems continues to rise across different water depths, particularly in deep and ultra-deepwater regions. However, challenges remain, including the high capital costs associated with subsea projects, fluctuations in oil and gas prices, and complex logistics involved in deepwater operations. Despite these challenges, the overall market forecast shows a promising future, with a CAGR of xx% predicted over the forecast period.
Dominant Regions & Segments in Subsea Production and Processing System Industry
The subsea production and processing system market shows significant regional variations in terms of dominance and growth potential. Deepwater regions, particularly in the Americas (Gulf of Mexico, Brazil), Asia-Pacific (Southeast Asia, Australia), and Europe (North Sea), are primary drivers of market growth.
- Key Drivers for Dominant Regions:
- Americas: Significant existing infrastructure, substantial oil and gas reserves, and continued investment in deepwater exploration.
- Asia-Pacific: Rapid economic growth, increasing energy demand, and major deepwater projects underway.
- Europe: Mature market with ongoing investments in existing fields and exploration of new areas.
Dominant Segments:
- Production System Components: Subsea trees represent a significant segment due to their critical role in well control. Subsea umbilicals, risers, and flowlines are essential for connecting subsea wells to surface facilities, representing large market segments as well. The "Other" segment includes various supporting components and systems, each with considerable individual market size.
- Processing System Types: Boosting systems are crucial for maintaining pressure in subsea wells, and separation systems are vital for processing the produced fluids. Injection systems manage water or gas reinjection to enhance recovery, and gas compression systems enable efficient transportation of gas from subsea facilities. All these segments contribute significantly to the overall market value.
- Water Depth: Deepwater and ultra-deepwater projects represent a substantial share of the market, due to higher complexity and cost, driving demand for advanced technologies. Shallow water segments contribute as well but have a smaller market share compared to their deepwater counterparts.
The detailed analysis within the full report provides a deeper understanding of market size, growth projections, and competitive dynamics for each segment and region.
Subsea Production and Processing System Industry Product Innovations
Recent years have witnessed significant advancements in subsea production and processing systems. These innovations primarily focus on enhancing operational efficiency, improving safety, reducing costs, and enabling operations in harsher environments. Key developments include the integration of advanced automation and remote control systems, the use of lighter and more durable materials, and the development of more efficient processing technologies. Subsea boosting and compression systems, in particular, have seen considerable improvements, allowing for the extraction of hydrocarbons from more challenging reservoirs. These innovations are driving market growth by providing operators with the capabilities to access and exploit previously unreachable resources.
Report Scope & Segmentation Analysis
This report segments the subsea production and processing system market along multiple dimensions:
- Production System Components: Subsea Trees, Subsea Umbilicals, Risers & Flowlines, Subsea Wellhead, Other. Each component segment has its specific growth projections, market size estimations, and competitive analysis within the full report.
- Processing System Type: Boosting, Separation, Injection, Gas Compression. The report details the market size, growth rate, and dominant players for each processing system type.
- Water Depth: Shallow Water, Deepwater, Ultra-Deepwater. Each water depth segment has distinct technological requirements and market characteristics, analyzed within the full report.
The report includes detailed market size estimations and growth projections for each segment, providing a complete picture of the market’s structure and dynamics.
Key Drivers of Subsea Production and Processing System Industry Growth
Several factors fuel the growth of the subsea production and processing system market. Firstly, the increasing demand for oil and gas globally is a major driver. Secondly, the ongoing exploration and development of deepwater and ultra-deepwater oil and gas fields necessitates the use of advanced subsea technologies. Thirdly, technological advancements such as improved automation, remote operations, and advanced materials continuously enhance efficiency and reduce operational costs. Fourthly, favorable government policies and regulatory support in many countries encourage investment in subsea projects. Finally, the continuous development of innovative subsea processing technologies contributes to the overall growth of this market.
Challenges in the Subsea Production and Processing System Industry Sector
The subsea production and processing system industry faces various challenges. High capital expenditure and operational costs are significant hurdles for companies, particularly for deepwater projects. Complex logistics and the challenging operational environment in deepwater present technical difficulties. Supply chain disruptions can impact project timelines and costs. Furthermore, stringent safety and environmental regulations add complexity and increase compliance costs. The fluctuating prices of oil and gas also create market uncertainty and impact investment decisions. These factors need careful consideration for successful operations in this sector.
Emerging Opportunities in Subsea Production and Processing System Industry
The industry offers several exciting opportunities. The expansion of deepwater and ultra-deepwater exploration into new geographical areas presents substantial growth potential. The development and deployment of autonomous underwater vehicles (AUVs) and remotely operated vehicles (ROVs) for improved inspection and maintenance creates lucrative opportunities for technological advancements. Finally, the increasing focus on environmental sustainability is driving innovation in environmentally friendly subsea technologies.
Leading Players in the Subsea Production and Processing System Industry Market
- Aker Solutions ASA
- Sri Energy Inc
- Subsea 7 SA
- Kerui Group Co Ltd
- Oceaneering International
- Baker Hughes Company
- Halliburton Company
- National-Oilwell Varco Inc
- Schlumberger Limited
- TechnipFMC PLC
Key Developments in Subsea Production and Processing System Industry
- March 2023: One Subsea secured a contract to supply 16 wet Christmas trees for the Búzios field in Brazil's Santos Basin, signifying significant investment in the pre-salt region.
- February 2023: Aker Solutions won a contract to deliver subsea umbilicals for the Agogo field development in Angola, highlighting the growing demand for subsea infrastructure in Africa.
- February 2023: TechnipFMC secured a contract from Equinor for the Irpa oil and gas development on the Norwegian Continental Shelf, demonstrating continued investment in the mature North Sea market.
These developments highlight the ongoing dynamism and growth within the subsea production and processing systems market.
Future Outlook for Subsea Production and Processing System Industry Market
The future of the subsea production and processing system market is promising. Continued exploration and production in deepwater and ultra-deepwater fields will be a key driver of growth. Technological advancements, particularly in automation, robotics, and digitalization, will play a pivotal role in improving efficiency and reducing costs. The market will continue to witness strategic mergers and acquisitions, leading to consolidation. Furthermore, the increasing focus on environmental sustainability will influence technological innovation and market trends. The overall market is projected to experience substantial growth driven by these factors, offering lucrative opportunities for businesses.
Subsea Production and Processing System Industry Segmentation
-
1. Production System Component
- 1.1. Subsea Trees
- 1.2. Subsea Umbilicals, Risers, & Flowlines
- 1.3. Subsea Wellhead
- 1.4. Other
-
2. Processing System Type
- 2.1. Boosting
- 2.2. Separation
- 2.3. Injection
- 2.4. Gas Compression
-
3. Water Depth
- 3.1. Shallow Water
- 3.2. Deepwater and Ultra-Deepwater
Subsea Production and Processing System Industry Segmentation By Geography
- 1. North America
- 2. Europe
- 3. Asia Pacific
- 4. South America
- 5. Middle East and Africa
Subsea Production and Processing System Industry REPORT HIGHLIGHTS
| Aspects | Details |
|---|---|
| Study Period | 2019-2033 |
| Base Year | 2024 |
| Estimated Year | 2025 |
| Forecast Period | 2025-2033 |
| Historical Period | 2019-2024 |
| Growth Rate | CAGR of 8.51% from 2019-2033 |
| Segmentation |
|
Table of Contents
- 1. Introduction
- 1.1. Research Scope
- 1.2. Market Segmentation
- 1.3. Research Methodology
- 1.4. Definitions and Assumptions
- 2. Executive Summary
- 2.1. Introduction
- 3. Market Dynamics
- 3.1. Introduction
- 3.2. Market Drivers
- 3.2.1. 4.; Improved Viability Of Offshore Oil And Gas Projects
- 3.3. Market Restrains
- 3.3.1. 4.; Ban On Offshore Exploration And Production Activities In Multiple Regions
- 3.4. Market Trends
- 3.4.1. Deepwater and Ultra-Deepwater to Dominate the Market
- 4. Market Factor Analysis
- 4.1. Porters Five Forces
- 4.2. Supply/Value Chain
- 4.3. PESTEL analysis
- 4.4. Market Entropy
- 4.5. Patent/Trademark Analysis
- 5. Global Subsea Production and Processing System Industry Analysis, Insights and Forecast, 2019-2031
- 5.1. Market Analysis, Insights and Forecast - by Production System Component
- 5.1.1. Subsea Trees
- 5.1.2. Subsea Umbilicals, Risers, & Flowlines
- 5.1.3. Subsea Wellhead
- 5.1.4. Other
- 5.2. Market Analysis, Insights and Forecast - by Processing System Type
- 5.2.1. Boosting
- 5.2.2. Separation
- 5.2.3. Injection
- 5.2.4. Gas Compression
- 5.3. Market Analysis, Insights and Forecast - by Water Depth
- 5.3.1. Shallow Water
- 5.3.2. Deepwater and Ultra-Deepwater
- 5.4. Market Analysis, Insights and Forecast - by Region
- 5.4.1. North America
- 5.4.2. Europe
- 5.4.3. Asia Pacific
- 5.4.4. South America
- 5.4.5. Middle East and Africa
- 5.1. Market Analysis, Insights and Forecast - by Production System Component
- 6. North America Subsea Production and Processing System Industry Analysis, Insights and Forecast, 2019-2031
- 6.1. Market Analysis, Insights and Forecast - by Production System Component
- 6.1.1. Subsea Trees
- 6.1.2. Subsea Umbilicals, Risers, & Flowlines
- 6.1.3. Subsea Wellhead
- 6.1.4. Other
- 6.2. Market Analysis, Insights and Forecast - by Processing System Type
- 6.2.1. Boosting
- 6.2.2. Separation
- 6.2.3. Injection
- 6.2.4. Gas Compression
- 6.3. Market Analysis, Insights and Forecast - by Water Depth
- 6.3.1. Shallow Water
- 6.3.2. Deepwater and Ultra-Deepwater
- 6.1. Market Analysis, Insights and Forecast - by Production System Component
- 7. Europe Subsea Production and Processing System Industry Analysis, Insights and Forecast, 2019-2031
- 7.1. Market Analysis, Insights and Forecast - by Production System Component
- 7.1.1. Subsea Trees
- 7.1.2. Subsea Umbilicals, Risers, & Flowlines
- 7.1.3. Subsea Wellhead
- 7.1.4. Other
- 7.2. Market Analysis, Insights and Forecast - by Processing System Type
- 7.2.1. Boosting
- 7.2.2. Separation
- 7.2.3. Injection
- 7.2.4. Gas Compression
- 7.3. Market Analysis, Insights and Forecast - by Water Depth
- 7.3.1. Shallow Water
- 7.3.2. Deepwater and Ultra-Deepwater
- 7.1. Market Analysis, Insights and Forecast - by Production System Component
- 8. Asia Pacific Subsea Production and Processing System Industry Analysis, Insights and Forecast, 2019-2031
- 8.1. Market Analysis, Insights and Forecast - by Production System Component
- 8.1.1. Subsea Trees
- 8.1.2. Subsea Umbilicals, Risers, & Flowlines
- 8.1.3. Subsea Wellhead
- 8.1.4. Other
- 8.2. Market Analysis, Insights and Forecast - by Processing System Type
- 8.2.1. Boosting
- 8.2.2. Separation
- 8.2.3. Injection
- 8.2.4. Gas Compression
- 8.3. Market Analysis, Insights and Forecast - by Water Depth
- 8.3.1. Shallow Water
- 8.3.2. Deepwater and Ultra-Deepwater
- 8.1. Market Analysis, Insights and Forecast - by Production System Component
- 9. South America Subsea Production and Processing System Industry Analysis, Insights and Forecast, 2019-2031
- 9.1. Market Analysis, Insights and Forecast - by Production System Component
- 9.1.1. Subsea Trees
- 9.1.2. Subsea Umbilicals, Risers, & Flowlines
- 9.1.3. Subsea Wellhead
- 9.1.4. Other
- 9.2. Market Analysis, Insights and Forecast - by Processing System Type
- 9.2.1. Boosting
- 9.2.2. Separation
- 9.2.3. Injection
- 9.2.4. Gas Compression
- 9.3. Market Analysis, Insights and Forecast - by Water Depth
- 9.3.1. Shallow Water
- 9.3.2. Deepwater and Ultra-Deepwater
- 9.1. Market Analysis, Insights and Forecast - by Production System Component
- 10. Middle East and Africa Subsea Production and Processing System Industry Analysis, Insights and Forecast, 2019-2031
- 10.1. Market Analysis, Insights and Forecast - by Production System Component
- 10.1.1. Subsea Trees
- 10.1.2. Subsea Umbilicals, Risers, & Flowlines
- 10.1.3. Subsea Wellhead
- 10.1.4. Other
- 10.2. Market Analysis, Insights and Forecast - by Processing System Type
- 10.2.1. Boosting
- 10.2.2. Separation
- 10.2.3. Injection
- 10.2.4. Gas Compression
- 10.3. Market Analysis, Insights and Forecast - by Water Depth
- 10.3.1. Shallow Water
- 10.3.2. Deepwater and Ultra-Deepwater
- 10.1. Market Analysis, Insights and Forecast - by Production System Component
- 11. North America Subsea Production and Processing System Industry Analysis, Insights and Forecast, 2019-2031
- 11.1. Market Analysis, Insights and Forecast - By Country/Sub-region
- 11.1.1 United States
- 11.1.2 Canada
- 11.1.3 Mexico
- 12. Europe Subsea Production and Processing System Industry Analysis, Insights and Forecast, 2019-2031
- 12.1. Market Analysis, Insights and Forecast - By Country/Sub-region
- 12.1.1 Germany
- 12.1.2 United Kingdom
- 12.1.3 France
- 12.1.4 Spain
- 12.1.5 Italy
- 12.1.6 Spain
- 12.1.7 Belgium
- 12.1.8 Netherland
- 12.1.9 Nordics
- 12.1.10 Rest of Europe
- 13. Asia Pacific Subsea Production and Processing System Industry Analysis, Insights and Forecast, 2019-2031
- 13.1. Market Analysis, Insights and Forecast - By Country/Sub-region
- 13.1.1 China
- 13.1.2 Japan
- 13.1.3 India
- 13.1.4 South Korea
- 13.1.5 Southeast Asia
- 13.1.6 Australia
- 13.1.7 Indonesia
- 13.1.8 Phillipes
- 13.1.9 Singapore
- 13.1.10 Thailandc
- 13.1.11 Rest of Asia Pacific
- 14. South America Subsea Production and Processing System Industry Analysis, Insights and Forecast, 2019-2031
- 14.1. Market Analysis, Insights and Forecast - By Country/Sub-region
- 14.1.1 Brazil
- 14.1.2 Argentina
- 14.1.3 Peru
- 14.1.4 Chile
- 14.1.5 Colombia
- 14.1.6 Ecuador
- 14.1.7 Venezuela
- 14.1.8 Rest of South America
- 15. North America Subsea Production and Processing System Industry Analysis, Insights and Forecast, 2019-2031
- 15.1. Market Analysis, Insights and Forecast - By Country/Sub-region
- 15.1.1 United States
- 15.1.2 Canada
- 15.1.3 Mexico
- 16. MEA Subsea Production and Processing System Industry Analysis, Insights and Forecast, 2019-2031
- 16.1. Market Analysis, Insights and Forecast - By Country/Sub-region
- 16.1.1 United Arab Emirates
- 16.1.2 Saudi Arabia
- 16.1.3 South Africa
- 16.1.4 Rest of Middle East and Africa
- 17. Competitive Analysis
- 17.1. Global Market Share Analysis 2024
- 17.2. Company Profiles
- 17.2.1 Aker Solutions ASA
- 17.2.1.1. Overview
- 17.2.1.2. Products
- 17.2.1.3. SWOT Analysis
- 17.2.1.4. Recent Developments
- 17.2.1.5. Financials (Based on Availability)
- 17.2.2 Sri Energy Inc
- 17.2.2.1. Overview
- 17.2.2.2. Products
- 17.2.2.3. SWOT Analysis
- 17.2.2.4. Recent Developments
- 17.2.2.5. Financials (Based on Availability)
- 17.2.3 Subsea 7 SA *List Not Exhaustive
- 17.2.3.1. Overview
- 17.2.3.2. Products
- 17.2.3.3. SWOT Analysis
- 17.2.3.4. Recent Developments
- 17.2.3.5. Financials (Based on Availability)
- 17.2.4 Kerui Group Co Ltd
- 17.2.4.1. Overview
- 17.2.4.2. Products
- 17.2.4.3. SWOT Analysis
- 17.2.4.4. Recent Developments
- 17.2.4.5. Financials (Based on Availability)
- 17.2.5 Oceaneering International
- 17.2.5.1. Overview
- 17.2.5.2. Products
- 17.2.5.3. SWOT Analysis
- 17.2.5.4. Recent Developments
- 17.2.5.5. Financials (Based on Availability)
- 17.2.6 Baker Hughes Company
- 17.2.6.1. Overview
- 17.2.6.2. Products
- 17.2.6.3. SWOT Analysis
- 17.2.6.4. Recent Developments
- 17.2.6.5. Financials (Based on Availability)
- 17.2.7 Halliburton Company
- 17.2.7.1. Overview
- 17.2.7.2. Products
- 17.2.7.3. SWOT Analysis
- 17.2.7.4. Recent Developments
- 17.2.7.5. Financials (Based on Availability)
- 17.2.8 National-Oilwell Varco Inc
- 17.2.8.1. Overview
- 17.2.8.2. Products
- 17.2.8.3. SWOT Analysis
- 17.2.8.4. Recent Developments
- 17.2.8.5. Financials (Based on Availability)
- 17.2.9 Schlumberger Limited
- 17.2.9.1. Overview
- 17.2.9.2. Products
- 17.2.9.3. SWOT Analysis
- 17.2.9.4. Recent Developments
- 17.2.9.5. Financials (Based on Availability)
- 17.2.10 TechnipFMC PLC
- 17.2.10.1. Overview
- 17.2.10.2. Products
- 17.2.10.3. SWOT Analysis
- 17.2.10.4. Recent Developments
- 17.2.10.5. Financials (Based on Availability)
- 17.2.1 Aker Solutions ASA
List of Figures
- Figure 1: Global Subsea Production and Processing System Industry Revenue Breakdown (Million, %) by Region 2024 & 2032
- Figure 2: North America Subsea Production and Processing System Industry Revenue (Million), by Country 2024 & 2032
- Figure 3: North America Subsea Production and Processing System Industry Revenue Share (%), by Country 2024 & 2032
- Figure 4: Europe Subsea Production and Processing System Industry Revenue (Million), by Country 2024 & 2032
- Figure 5: Europe Subsea Production and Processing System Industry Revenue Share (%), by Country 2024 & 2032
- Figure 6: Asia Pacific Subsea Production and Processing System Industry Revenue (Million), by Country 2024 & 2032
- Figure 7: Asia Pacific Subsea Production and Processing System Industry Revenue Share (%), by Country 2024 & 2032
- Figure 8: South America Subsea Production and Processing System Industry Revenue (Million), by Country 2024 & 2032
- Figure 9: South America Subsea Production and Processing System Industry Revenue Share (%), by Country 2024 & 2032
- Figure 10: North America Subsea Production and Processing System Industry Revenue (Million), by Country 2024 & 2032
- Figure 11: North America Subsea Production and Processing System Industry Revenue Share (%), by Country 2024 & 2032
- Figure 12: MEA Subsea Production and Processing System Industry Revenue (Million), by Country 2024 & 2032
- Figure 13: MEA Subsea Production and Processing System Industry Revenue Share (%), by Country 2024 & 2032
- Figure 14: North America Subsea Production and Processing System Industry Revenue (Million), by Production System Component 2024 & 2032
- Figure 15: North America Subsea Production and Processing System Industry Revenue Share (%), by Production System Component 2024 & 2032
- Figure 16: North America Subsea Production and Processing System Industry Revenue (Million), by Processing System Type 2024 & 2032
- Figure 17: North America Subsea Production and Processing System Industry Revenue Share (%), by Processing System Type 2024 & 2032
- Figure 18: North America Subsea Production and Processing System Industry Revenue (Million), by Water Depth 2024 & 2032
- Figure 19: North America Subsea Production and Processing System Industry Revenue Share (%), by Water Depth 2024 & 2032
- Figure 20: North America Subsea Production and Processing System Industry Revenue (Million), by Country 2024 & 2032
- Figure 21: North America Subsea Production and Processing System Industry Revenue Share (%), by Country 2024 & 2032
- Figure 22: Europe Subsea Production and Processing System Industry Revenue (Million), by Production System Component 2024 & 2032
- Figure 23: Europe Subsea Production and Processing System Industry Revenue Share (%), by Production System Component 2024 & 2032
- Figure 24: Europe Subsea Production and Processing System Industry Revenue (Million), by Processing System Type 2024 & 2032
- Figure 25: Europe Subsea Production and Processing System Industry Revenue Share (%), by Processing System Type 2024 & 2032
- Figure 26: Europe Subsea Production and Processing System Industry Revenue (Million), by Water Depth 2024 & 2032
- Figure 27: Europe Subsea Production and Processing System Industry Revenue Share (%), by Water Depth 2024 & 2032
- Figure 28: Europe Subsea Production and Processing System Industry Revenue (Million), by Country 2024 & 2032
- Figure 29: Europe Subsea Production and Processing System Industry Revenue Share (%), by Country 2024 & 2032
- Figure 30: Asia Pacific Subsea Production and Processing System Industry Revenue (Million), by Production System Component 2024 & 2032
- Figure 31: Asia Pacific Subsea Production and Processing System Industry Revenue Share (%), by Production System Component 2024 & 2032
- Figure 32: Asia Pacific Subsea Production and Processing System Industry Revenue (Million), by Processing System Type 2024 & 2032
- Figure 33: Asia Pacific Subsea Production and Processing System Industry Revenue Share (%), by Processing System Type 2024 & 2032
- Figure 34: Asia Pacific Subsea Production and Processing System Industry Revenue (Million), by Water Depth 2024 & 2032
- Figure 35: Asia Pacific Subsea Production and Processing System Industry Revenue Share (%), by Water Depth 2024 & 2032
- Figure 36: Asia Pacific Subsea Production and Processing System Industry Revenue (Million), by Country 2024 & 2032
- Figure 37: Asia Pacific Subsea Production and Processing System Industry Revenue Share (%), by Country 2024 & 2032
- Figure 38: South America Subsea Production and Processing System Industry Revenue (Million), by Production System Component 2024 & 2032
- Figure 39: South America Subsea Production and Processing System Industry Revenue Share (%), by Production System Component 2024 & 2032
- Figure 40: South America Subsea Production and Processing System Industry Revenue (Million), by Processing System Type 2024 & 2032
- Figure 41: South America Subsea Production and Processing System Industry Revenue Share (%), by Processing System Type 2024 & 2032
- Figure 42: South America Subsea Production and Processing System Industry Revenue (Million), by Water Depth 2024 & 2032
- Figure 43: South America Subsea Production and Processing System Industry Revenue Share (%), by Water Depth 2024 & 2032
- Figure 44: South America Subsea Production and Processing System Industry Revenue (Million), by Country 2024 & 2032
- Figure 45: South America Subsea Production and Processing System Industry Revenue Share (%), by Country 2024 & 2032
- Figure 46: Middle East and Africa Subsea Production and Processing System Industry Revenue (Million), by Production System Component 2024 & 2032
- Figure 47: Middle East and Africa Subsea Production and Processing System Industry Revenue Share (%), by Production System Component 2024 & 2032
- Figure 48: Middle East and Africa Subsea Production and Processing System Industry Revenue (Million), by Processing System Type 2024 & 2032
- Figure 49: Middle East and Africa Subsea Production and Processing System Industry Revenue Share (%), by Processing System Type 2024 & 2032
- Figure 50: Middle East and Africa Subsea Production and Processing System Industry Revenue (Million), by Water Depth 2024 & 2032
- Figure 51: Middle East and Africa Subsea Production and Processing System Industry Revenue Share (%), by Water Depth 2024 & 2032
- Figure 52: Middle East and Africa Subsea Production and Processing System Industry Revenue (Million), by Country 2024 & 2032
- Figure 53: Middle East and Africa Subsea Production and Processing System Industry Revenue Share (%), by Country 2024 & 2032
List of Tables
- Table 1: Global Subsea Production and Processing System Industry Revenue Million Forecast, by Region 2019 & 2032
- Table 2: Global Subsea Production and Processing System Industry Revenue Million Forecast, by Production System Component 2019 & 2032
- Table 3: Global Subsea Production and Processing System Industry Revenue Million Forecast, by Processing System Type 2019 & 2032
- Table 4: Global Subsea Production and Processing System Industry Revenue Million Forecast, by Water Depth 2019 & 2032
- Table 5: Global Subsea Production and Processing System Industry Revenue Million Forecast, by Region 2019 & 2032
- Table 6: Global Subsea Production and Processing System Industry Revenue Million Forecast, by Country 2019 & 2032
- Table 7: United States Subsea Production and Processing System Industry Revenue (Million) Forecast, by Application 2019 & 2032
- Table 8: Canada Subsea Production and Processing System Industry Revenue (Million) Forecast, by Application 2019 & 2032
- Table 9: Mexico Subsea Production and Processing System Industry Revenue (Million) Forecast, by Application 2019 & 2032
- Table 10: Global Subsea Production and Processing System Industry Revenue Million Forecast, by Country 2019 & 2032
- Table 11: Germany Subsea Production and Processing System Industry Revenue (Million) Forecast, by Application 2019 & 2032
- Table 12: United Kingdom Subsea Production and Processing System Industry Revenue (Million) Forecast, by Application 2019 & 2032
- Table 13: France Subsea Production and Processing System Industry Revenue (Million) Forecast, by Application 2019 & 2032
- Table 14: Spain Subsea Production and Processing System Industry Revenue (Million) Forecast, by Application 2019 & 2032
- Table 15: Italy Subsea Production and Processing System Industry Revenue (Million) Forecast, by Application 2019 & 2032
- Table 16: Spain Subsea Production and Processing System Industry Revenue (Million) Forecast, by Application 2019 & 2032
- Table 17: Belgium Subsea Production and Processing System Industry Revenue (Million) Forecast, by Application 2019 & 2032
- Table 18: Netherland Subsea Production and Processing System Industry Revenue (Million) Forecast, by Application 2019 & 2032
- Table 19: Nordics Subsea Production and Processing System Industry Revenue (Million) Forecast, by Application 2019 & 2032
- Table 20: Rest of Europe Subsea Production and Processing System Industry Revenue (Million) Forecast, by Application 2019 & 2032
- Table 21: Global Subsea Production and Processing System Industry Revenue Million Forecast, by Country 2019 & 2032
- Table 22: China Subsea Production and Processing System Industry Revenue (Million) Forecast, by Application 2019 & 2032
- Table 23: Japan Subsea Production and Processing System Industry Revenue (Million) Forecast, by Application 2019 & 2032
- Table 24: India Subsea Production and Processing System Industry Revenue (Million) Forecast, by Application 2019 & 2032
- Table 25: South Korea Subsea Production and Processing System Industry Revenue (Million) Forecast, by Application 2019 & 2032
- Table 26: Southeast Asia Subsea Production and Processing System Industry Revenue (Million) Forecast, by Application 2019 & 2032
- Table 27: Australia Subsea Production and Processing System Industry Revenue (Million) Forecast, by Application 2019 & 2032
- Table 28: Indonesia Subsea Production and Processing System Industry Revenue (Million) Forecast, by Application 2019 & 2032
- Table 29: Phillipes Subsea Production and Processing System Industry Revenue (Million) Forecast, by Application 2019 & 2032
- Table 30: Singapore Subsea Production and Processing System Industry Revenue (Million) Forecast, by Application 2019 & 2032
- Table 31: Thailandc Subsea Production and Processing System Industry Revenue (Million) Forecast, by Application 2019 & 2032
- Table 32: Rest of Asia Pacific Subsea Production and Processing System Industry Revenue (Million) Forecast, by Application 2019 & 2032
- Table 33: Global Subsea Production and Processing System Industry Revenue Million Forecast, by Country 2019 & 2032
- Table 34: Brazil Subsea Production and Processing System Industry Revenue (Million) Forecast, by Application 2019 & 2032
- Table 35: Argentina Subsea Production and Processing System Industry Revenue (Million) Forecast, by Application 2019 & 2032
- Table 36: Peru Subsea Production and Processing System Industry Revenue (Million) Forecast, by Application 2019 & 2032
- Table 37: Chile Subsea Production and Processing System Industry Revenue (Million) Forecast, by Application 2019 & 2032
- Table 38: Colombia Subsea Production and Processing System Industry Revenue (Million) Forecast, by Application 2019 & 2032
- Table 39: Ecuador Subsea Production and Processing System Industry Revenue (Million) Forecast, by Application 2019 & 2032
- Table 40: Venezuela Subsea Production and Processing System Industry Revenue (Million) Forecast, by Application 2019 & 2032
- Table 41: Rest of South America Subsea Production and Processing System Industry Revenue (Million) Forecast, by Application 2019 & 2032
- Table 42: Global Subsea Production and Processing System Industry Revenue Million Forecast, by Country 2019 & 2032
- Table 43: United States Subsea Production and Processing System Industry Revenue (Million) Forecast, by Application 2019 & 2032
- Table 44: Canada Subsea Production and Processing System Industry Revenue (Million) Forecast, by Application 2019 & 2032
- Table 45: Mexico Subsea Production and Processing System Industry Revenue (Million) Forecast, by Application 2019 & 2032
- Table 46: Global Subsea Production and Processing System Industry Revenue Million Forecast, by Country 2019 & 2032
- Table 47: United Arab Emirates Subsea Production and Processing System Industry Revenue (Million) Forecast, by Application 2019 & 2032
- Table 48: Saudi Arabia Subsea Production and Processing System Industry Revenue (Million) Forecast, by Application 2019 & 2032
- Table 49: South Africa Subsea Production and Processing System Industry Revenue (Million) Forecast, by Application 2019 & 2032
- Table 50: Rest of Middle East and Africa Subsea Production and Processing System Industry Revenue (Million) Forecast, by Application 2019 & 2032
- Table 51: Global Subsea Production and Processing System Industry Revenue Million Forecast, by Production System Component 2019 & 2032
- Table 52: Global Subsea Production and Processing System Industry Revenue Million Forecast, by Processing System Type 2019 & 2032
- Table 53: Global Subsea Production and Processing System Industry Revenue Million Forecast, by Water Depth 2019 & 2032
- Table 54: Global Subsea Production and Processing System Industry Revenue Million Forecast, by Country 2019 & 2032
- Table 55: Global Subsea Production and Processing System Industry Revenue Million Forecast, by Production System Component 2019 & 2032
- Table 56: Global Subsea Production and Processing System Industry Revenue Million Forecast, by Processing System Type 2019 & 2032
- Table 57: Global Subsea Production and Processing System Industry Revenue Million Forecast, by Water Depth 2019 & 2032
- Table 58: Global Subsea Production and Processing System Industry Revenue Million Forecast, by Country 2019 & 2032
- Table 59: Global Subsea Production and Processing System Industry Revenue Million Forecast, by Production System Component 2019 & 2032
- Table 60: Global Subsea Production and Processing System Industry Revenue Million Forecast, by Processing System Type 2019 & 2032
- Table 61: Global Subsea Production and Processing System Industry Revenue Million Forecast, by Water Depth 2019 & 2032
- Table 62: Global Subsea Production and Processing System Industry Revenue Million Forecast, by Country 2019 & 2032
- Table 63: Global Subsea Production and Processing System Industry Revenue Million Forecast, by Production System Component 2019 & 2032
- Table 64: Global Subsea Production and Processing System Industry Revenue Million Forecast, by Processing System Type 2019 & 2032
- Table 65: Global Subsea Production and Processing System Industry Revenue Million Forecast, by Water Depth 2019 & 2032
- Table 66: Global Subsea Production and Processing System Industry Revenue Million Forecast, by Country 2019 & 2032
- Table 67: Global Subsea Production and Processing System Industry Revenue Million Forecast, by Production System Component 2019 & 2032
- Table 68: Global Subsea Production and Processing System Industry Revenue Million Forecast, by Processing System Type 2019 & 2032
- Table 69: Global Subsea Production and Processing System Industry Revenue Million Forecast, by Water Depth 2019 & 2032
- Table 70: Global Subsea Production and Processing System Industry Revenue Million Forecast, by Country 2019 & 2032
Frequently Asked Questions
1. What is the projected Compound Annual Growth Rate (CAGR) of the Subsea Production and Processing System Industry?
The projected CAGR is approximately 8.51%.
2. Which companies are prominent players in the Subsea Production and Processing System Industry?
Key companies in the market include Aker Solutions ASA, Sri Energy Inc, Subsea 7 SA *List Not Exhaustive, Kerui Group Co Ltd, Oceaneering International, Baker Hughes Company, Halliburton Company, National-Oilwell Varco Inc, Schlumberger Limited, TechnipFMC PLC.
3. What are the main segments of the Subsea Production and Processing System Industry?
The market segments include Production System Component, Processing System Type, Water Depth.
4. Can you provide details about the market size?
The market size is estimated to be USD 19.93 Million as of 2022.
5. What are some drivers contributing to market growth?
4.; Improved Viability Of Offshore Oil And Gas Projects.
6. What are the notable trends driving market growth?
Deepwater and Ultra-Deepwater to Dominate the Market.
7. Are there any restraints impacting market growth?
4.; Ban On Offshore Exploration And Production Activities In Multiple Regions.
8. Can you provide examples of recent developments in the market?
March 2023: One Subsea announced it had won a tender to provide the equipment for the Búziosfield in the Santos Basin pre-salt. The contract offers the delivery of 16 wet Christmas trees (ANMs) in phase 10 of the field's exploration.
9. What pricing options are available for accessing the report?
Pricing options include single-user, multi-user, and enterprise licenses priced at USD 4750, USD 5250, and USD 8750 respectively.
10. Is the market size provided in terms of value or volume?
The market size is provided in terms of value, measured in Million.
11. Are there any specific market keywords associated with the report?
Yes, the market keyword associated with the report is "Subsea Production and Processing System Industry," which aids in identifying and referencing the specific market segment covered.
12. How do I determine which pricing option suits my needs best?
The pricing options vary based on user requirements and access needs. Individual users may opt for single-user licenses, while businesses requiring broader access may choose multi-user or enterprise licenses for cost-effective access to the report.
13. Are there any additional resources or data provided in the Subsea Production and Processing System Industry report?
While the report offers comprehensive insights, it's advisable to review the specific contents or supplementary materials provided to ascertain if additional resources or data are available.
14. How can I stay updated on further developments or reports in the Subsea Production and Processing System Industry?
To stay informed about further developments, trends, and reports in the Subsea Production and Processing System Industry, consider subscribing to industry newsletters, following relevant companies and organizations, or regularly checking reputable industry news sources and publications.
Methodology
Step 1 - Identification of Relevant Samples Size from Population Database


Step 2 - Approaches for Defining Global Market Size (Value, Volume* & Price*)

Note*: In applicable scenarios
Step 3 - Data Sources
Primary Research
- Web Analytics
- Survey Reports
- Research Institute
- Latest Research Reports
- Opinion Leaders
Secondary Research
- Annual Reports
- White Paper
- Latest Press Release
- Industry Association
- Paid Database
- Investor Presentations

Step 4 - Data Triangulation
Involves using different sources of information in order to increase the validity of a study
These sources are likely to be stakeholders in a program - participants, other researchers, program staff, other community members, and so on.
Then we put all data in single framework & apply various statistical tools to find out the dynamic on the market.
During the analysis stage, feedback from the stakeholder groups would be compared to determine areas of agreement as well as areas of divergence


