
Key Insights
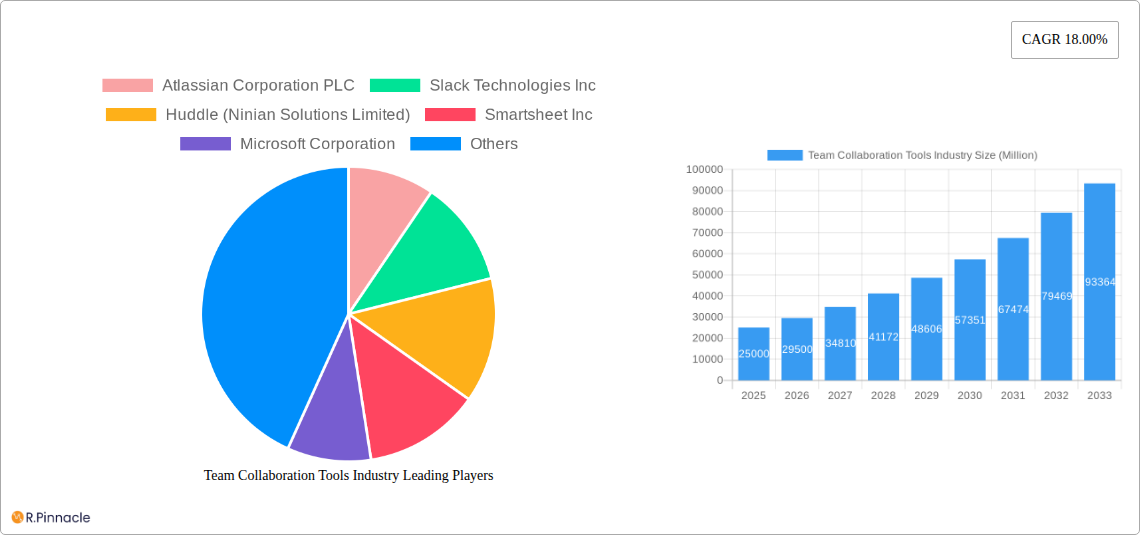
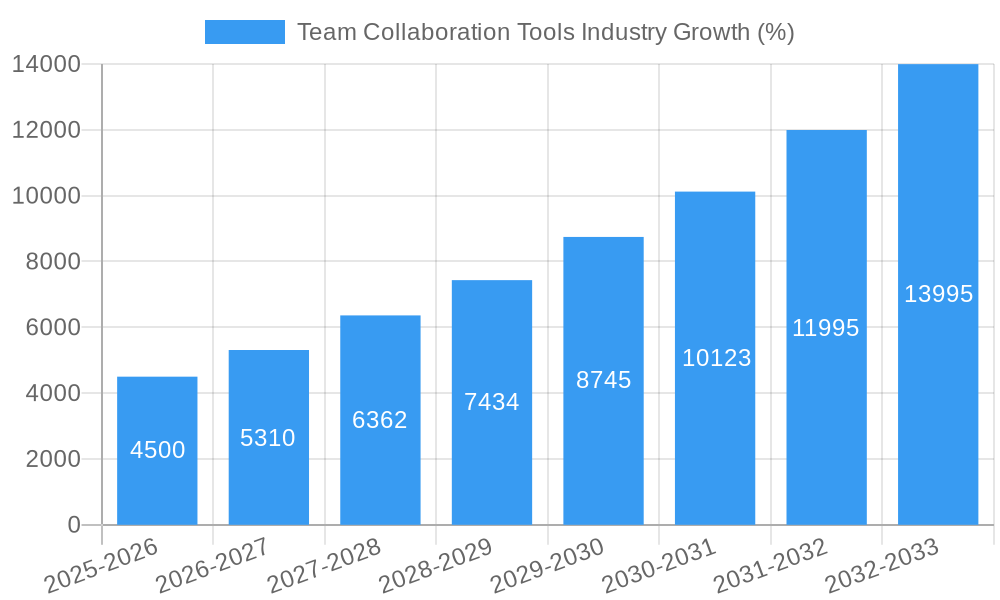
The Team Collaboration Tools market is experiencing robust growth, projected to reach a substantial market size with a Compound Annual Growth Rate (CAGR) of 18% from 2025 to 2033. This expansion is driven by several key factors. The increasing adoption of cloud-based solutions offers scalability and accessibility, enhancing team productivity and communication across geographical boundaries. Furthermore, the rising prevalence of remote work and hybrid work models necessitates efficient collaboration tools, fueling market demand. The integration of AI and advanced analytics within these tools further boosts efficiency, attracting businesses of all sizes. The market is segmented by deployment type (cloud and on-premise) and organization size (SMEs and large enterprises), with cloud-based solutions dominating due to their flexibility and cost-effectiveness. Large enterprises are the primary adopters due to their need for advanced features and robust security protocols.
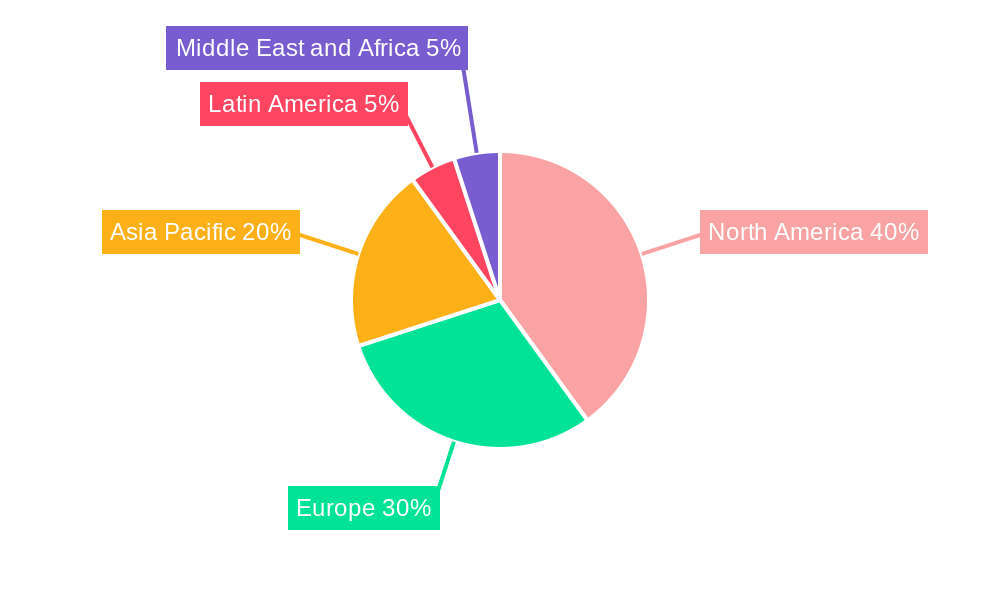
Competition in the market is intense, with established players like Microsoft, Atlassian, and Slack facing challenges from emerging niche players offering specialized functionalities. However, strategic partnerships and acquisitions are reshaping the competitive landscape. Geographic expansion is another significant driver, with North America currently holding a significant market share due to high technology adoption and a mature business environment. However, the Asia-Pacific region is expected to witness substantial growth in the coming years, driven by increasing digitalization and economic development in countries like India and China. Despite the growth, market restraints include concerns about data security and privacy, integration complexities with existing systems, and the need for comprehensive training and user adoption strategies. Future growth hinges on addressing these challenges and offering seamless, secure, and user-friendly solutions catering to diverse organizational needs.
Team Collaboration Tools Industry Report: A Comprehensive Market Analysis (2019-2033)
This comprehensive report provides an in-depth analysis of the Team Collaboration Tools industry, offering invaluable insights for industry professionals, investors, and strategic decision-makers. With a study period spanning 2019-2033, a base year of 2025, and a forecast period of 2025-2033, this report offers a detailed overview of market trends, dynamics, and future growth potential. The report is structured to provide actionable insights, leveraging high-ranking keywords for optimal search engine visibility. The global market size in 2025 is estimated at $xx Million.
Team Collaboration Tools Industry Market Structure & Innovation Trends
This section analyzes the competitive landscape of the Team Collaboration Tools industry, exploring market concentration, innovation drivers, regulatory frameworks, product substitutes, and M&A activities. The industry is characterized by a moderately concentrated market with key players holding significant market share. Atlassian, Microsoft, and Slack are currently amongst the leading players, though the exact market share for each company fluctuates. Innovation is driven by the increasing need for enhanced communication, workflow automation, and remote collaboration capabilities. Regulatory frameworks, while varying by region, generally focus on data privacy and security. Competition comes from both established players and emerging startups offering innovative solutions. The historical period (2019-2024) witnessed significant M&A activity, with deal values totaling $xx Million. Future M&A activity is predicted to remain high, driven by the need for expansion and technology integration.
- Market Concentration: Moderately Concentrated
- Major Players: Atlassian, Microsoft, Slack (market share varies)
- Innovation Drivers: Enhanced communication, workflow automation, remote work needs
- Regulatory Landscape: Varies by region, focusing on data privacy and security
- M&A Activity (2019-2024): $xx Million
Team Collaboration Tools Industry Market Dynamics & Trends
The Team Collaboration Tools market exhibits strong growth, driven by factors such as the rising adoption of cloud-based solutions, the increasing prevalence of remote work, and the growing demand for improved team productivity. Technological advancements such as AI-powered features and enhanced integration capabilities are further fueling market expansion. Consumer preferences are shifting towards user-friendly, intuitive interfaces with robust security features. Competitive dynamics are intense, with companies continuously innovating to differentiate their offerings and gain market share. The Compound Annual Growth Rate (CAGR) for the forecast period (2025-2033) is projected to be xx%, and market penetration is expected to reach xx% by 2033.
Dominant Regions & Segments in Team Collaboration Tools Industry
North America currently holds the dominant position in the Team Collaboration Tools market, driven by high technological adoption, robust infrastructure, and a strong presence of major players. Within this region, the United States stands out as the largest market. The Cloud deployment segment demonstrates significant growth, surpassing On-premise solutions due to its scalability, cost-effectiveness, and accessibility. Large Enterprises are also a significant segment due to their higher investment capacity and greater need for sophisticated collaboration tools.
- Leading Region: North America (United States)
- Dominant Deployment Type: Cloud
- Largest Organization Size Segment: Large Enterprises
Key Drivers:
- North America: High tech adoption, robust infrastructure, established player presence.
- Cloud Deployment: Scalability, cost-effectiveness, accessibility.
- Large Enterprises: Higher investment capacity, greater need for sophisticated tools.
Team Collaboration Tools Industry Product Innovations
Recent product developments focus on enhancing user experience, integrating AI-powered features for improved workflow automation, and strengthening security protocols. The market is witnessing an increase in the adoption of collaborative platforms that seamlessly integrate with existing business applications. Key advantages include improved communication, streamlined workflows, and enhanced team productivity, resulting in a better return on investment for businesses.
Report Scope & Segmentation Analysis
This report segments the Team Collaboration Tools market by deployment type (Cloud, On-premise) and organization size (Small and Medium Enterprises, Large Enterprises). The Cloud segment is projected to experience faster growth due to its flexibility and scalability. The Large Enterprise segment is expected to dominate due to its higher spending capacity. Competitive dynamics vary across segments, with different players specializing in specific deployment types or organization sizes. Market sizes and growth projections are detailed within the report for each segment.
Key Drivers of Team Collaboration Tools Industry Growth
Several factors are driving the growth of the Team Collaboration Tools industry. Technological advancements, including AI-powered features and enhanced integration capabilities, are improving efficiency and user experience. Economic factors, such as increasing investment in digital transformation initiatives, are fostering adoption. Favorable regulatory environments in many regions are also supporting the industry's expansion.
Challenges in the Team Collaboration Tools Industry Sector
The Team Collaboration Tools industry faces challenges such as the need for robust data security measures to address privacy concerns, and the complexity of integrating multiple tools across diverse systems. Competitive pressures from both established and emerging players, along with the potential for vendor lock-in, also pose significant challenges. These factors could result in a xx% decrease in market growth if not properly addressed.
Emerging Opportunities in Team Collaboration Tools Industry
Emerging opportunities lie in expanding into new markets, particularly in developing economies, and integrating emerging technologies such as blockchain and the metaverse into collaboration tools. Tailoring solutions to meet the specific needs of niche industries such as healthcare and manufacturing also presents significant opportunities. Further integration with other productivity and project management tools will be crucial in creating holistic solutions for organizations.
Leading Players in the Team Collaboration Tools Industry Market
- Atlassian Corporation PLC
- Slack Technologies Inc
- Huddle (Ninian Solutions Limited)
- Smartsheet Inc
- Microsoft Corporation
- TigerConnect Inc
- Symphony Communication Services LLC
- Wrike Inc
- Asana Inc
- Cybozu Inc
- List Not Exhaustive
Key Developments in Team Collaboration Tools Industry
- February 2022: Asana Inc. announced Asana Flow, a new set of workflow tools automating work movement between teams. This launch significantly enhanced Asana's competitive position by addressing a key market need for improved workflow management.
- April 2022: Slack Technologies Inc. and Salesforce released new tools to accelerate team performance, including a customizable digital HQ, boosting Slack's appeal and functionality for enterprise clients. This integration strengthened both companies' market positions.
Future Outlook for Team Collaboration Tools Industry Market
The future of the Team Collaboration Tools market appears bright, driven by ongoing technological advancements, increasing demand for remote work solutions, and continued investment in digital transformation initiatives. Strategic partnerships and acquisitions are expected to further shape the market landscape. The focus will be on developing more intelligent, integrated, and secure solutions to meet the evolving needs of businesses worldwide. The predicted market size in 2033 is estimated at $xx Million.
Team Collaboration Tools Industry Segmentation
-
1. Type of Deployment
- 1.1. Cloud
- 1.2. On-premise
-
2. Organization Size
- 2.1. Small and Medium Enterprises
- 2.2. Large Enterprises
Team Collaboration Tools Industry Segmentation By Geography
-
1. North America
- 1.1. United States
- 1.2. Canada
-
2. Europe
- 2.1. Germany
- 2.2. United Kingdom
- 2.3. France
- 2.4. Rest of Europe
-
3. Asia Pacific
- 3.1. India
- 3.2. China
- 3.3. Japan
- 3.4. Rest of Asia Pacific
-
4. Latin America
- 4.1. Brazil
- 4.2. Argentina
- 4.3. Rest of Latin America
-
5. Middle East and Africa
- 5.1. United Arab Emirates
- 5.2. Saudi Arabia
- 5.3. Africa
- 5.4. Rest of Middle East and Africa
Team Collaboration Tools Industry REPORT HIGHLIGHTS
| Aspects | Details |
|---|---|
| Study Period | 2019-2033 |
| Base Year | 2024 |
| Estimated Year | 2025 |
| Forecast Period | 2025-2033 |
| Historical Period | 2019-2024 |
| Growth Rate | CAGR of 18.00% from 2019-2033 |
| Segmentation |
|
Table of Contents
- 1. Introduction
- 1.1. Research Scope
- 1.2. Market Segmentation
- 1.3. Research Methodology
- 1.4. Definitions and Assumptions
- 2. Executive Summary
- 2.1. Introduction
- 3. Market Dynamics
- 3.1. Introduction
- 3.2. Market Drivers
- 3.2.1. Increasing Need for Tools to Make Work Seamless and Agile; Continuous Innovation in Team Collaborative Tool Offerings
- 3.3. Market Restrains
- 3.3.1. Compliance and Governance Issues
- 3.4. Market Trends
- 3.4.1. Continuous Innovation in Team Collaboration Tool Offerings to Increase Market Growth
- 4. Market Factor Analysis
- 4.1. Porters Five Forces
- 4.2. Supply/Value Chain
- 4.3. PESTEL analysis
- 4.4. Market Entropy
- 4.5. Patent/Trademark Analysis
- 5. Global Team Collaboration Tools Industry Analysis, Insights and Forecast, 2019-2031
- 5.1. Market Analysis, Insights and Forecast - by Type of Deployment
- 5.1.1. Cloud
- 5.1.2. On-premise
- 5.2. Market Analysis, Insights and Forecast - by Organization Size
- 5.2.1. Small and Medium Enterprises
- 5.2.2. Large Enterprises
- 5.3. Market Analysis, Insights and Forecast - by Region
- 5.3.1. North America
- 5.3.2. Europe
- 5.3.3. Asia Pacific
- 5.3.4. Latin America
- 5.3.5. Middle East and Africa
- 5.1. Market Analysis, Insights and Forecast - by Type of Deployment
- 6. North America Team Collaboration Tools Industry Analysis, Insights and Forecast, 2019-2031
- 6.1. Market Analysis, Insights and Forecast - by Type of Deployment
- 6.1.1. Cloud
- 6.1.2. On-premise
- 6.2. Market Analysis, Insights and Forecast - by Organization Size
- 6.2.1. Small and Medium Enterprises
- 6.2.2. Large Enterprises
- 6.1. Market Analysis, Insights and Forecast - by Type of Deployment
- 7. Europe Team Collaboration Tools Industry Analysis, Insights and Forecast, 2019-2031
- 7.1. Market Analysis, Insights and Forecast - by Type of Deployment
- 7.1.1. Cloud
- 7.1.2. On-premise
- 7.2. Market Analysis, Insights and Forecast - by Organization Size
- 7.2.1. Small and Medium Enterprises
- 7.2.2. Large Enterprises
- 7.1. Market Analysis, Insights and Forecast - by Type of Deployment
- 8. Asia Pacific Team Collaboration Tools Industry Analysis, Insights and Forecast, 2019-2031
- 8.1. Market Analysis, Insights and Forecast - by Type of Deployment
- 8.1.1. Cloud
- 8.1.2. On-premise
- 8.2. Market Analysis, Insights and Forecast - by Organization Size
- 8.2.1. Small and Medium Enterprises
- 8.2.2. Large Enterprises
- 8.1. Market Analysis, Insights and Forecast - by Type of Deployment
- 9. Latin America Team Collaboration Tools Industry Analysis, Insights and Forecast, 2019-2031
- 9.1. Market Analysis, Insights and Forecast - by Type of Deployment
- 9.1.1. Cloud
- 9.1.2. On-premise
- 9.2. Market Analysis, Insights and Forecast - by Organization Size
- 9.2.1. Small and Medium Enterprises
- 9.2.2. Large Enterprises
- 9.1. Market Analysis, Insights and Forecast - by Type of Deployment
- 10. Middle East and Africa Team Collaboration Tools Industry Analysis, Insights and Forecast, 2019-2031
- 10.1. Market Analysis, Insights and Forecast - by Type of Deployment
- 10.1.1. Cloud
- 10.1.2. On-premise
- 10.2. Market Analysis, Insights and Forecast - by Organization Size
- 10.2.1. Small and Medium Enterprises
- 10.2.2. Large Enterprises
- 10.1. Market Analysis, Insights and Forecast - by Type of Deployment
- 11. North America Team Collaboration Tools Industry Analysis, Insights and Forecast, 2019-2031
- 11.1. Market Analysis, Insights and Forecast - By Country/Sub-region
- 11.1.1 United States
- 11.1.2 Canada
- 12. Europe Team Collaboration Tools Industry Analysis, Insights and Forecast, 2019-2031
- 12.1. Market Analysis, Insights and Forecast - By Country/Sub-region
- 12.1.1 Germany
- 12.1.2 United Kingdom
- 12.1.3 France
- 12.1.4 Rest of Europe
- 13. Asia Pacific Team Collaboration Tools Industry Analysis, Insights and Forecast, 2019-2031
- 13.1. Market Analysis, Insights and Forecast - By Country/Sub-region
- 13.1.1 India
- 13.1.2 China
- 13.1.3 Japan
- 13.1.4 Rest of Asia Pacific
- 14. Latin America Team Collaboration Tools Industry Analysis, Insights and Forecast, 2019-2031
- 14.1. Market Analysis, Insights and Forecast - By Country/Sub-region
- 14.1.1 Brazil
- 14.1.2 Argentina
- 14.1.3 Rest of Latin America
- 15. Middle East and Africa Team Collaboration Tools Industry Analysis, Insights and Forecast, 2019-2031
- 15.1. Market Analysis, Insights and Forecast - By Country/Sub-region
- 15.1.1 United Arab Emirates
- 15.1.2 Saudi Arabia
- 15.1.3 Africa
- 15.1.4 Rest of Middle East and Africa
- 16. Competitive Analysis
- 16.1. Global Market Share Analysis 2024
- 16.2. Company Profiles
- 16.2.1 Atlassian Corporation PLC
- 16.2.1.1. Overview
- 16.2.1.2. Products
- 16.2.1.3. SWOT Analysis
- 16.2.1.4. Recent Developments
- 16.2.1.5. Financials (Based on Availability)
- 16.2.2 Slack Technologies Inc
- 16.2.2.1. Overview
- 16.2.2.2. Products
- 16.2.2.3. SWOT Analysis
- 16.2.2.4. Recent Developments
- 16.2.2.5. Financials (Based on Availability)
- 16.2.3 Huddle (Ninian Solutions Limited)
- 16.2.3.1. Overview
- 16.2.3.2. Products
- 16.2.3.3. SWOT Analysis
- 16.2.3.4. Recent Developments
- 16.2.3.5. Financials (Based on Availability)
- 16.2.4 Smartsheet Inc
- 16.2.4.1. Overview
- 16.2.4.2. Products
- 16.2.4.3. SWOT Analysis
- 16.2.4.4. Recent Developments
- 16.2.4.5. Financials (Based on Availability)
- 16.2.5 Microsoft Corporation
- 16.2.5.1. Overview
- 16.2.5.2. Products
- 16.2.5.3. SWOT Analysis
- 16.2.5.4. Recent Developments
- 16.2.5.5. Financials (Based on Availability)
- 16.2.6 TigerConnect Inc
- 16.2.6.1. Overview
- 16.2.6.2. Products
- 16.2.6.3. SWOT Analysis
- 16.2.6.4. Recent Developments
- 16.2.6.5. Financials (Based on Availability)
- 16.2.7 Symphony Communication Services LLC
- 16.2.7.1. Overview
- 16.2.7.2. Products
- 16.2.7.3. SWOT Analysis
- 16.2.7.4. Recent Developments
- 16.2.7.5. Financials (Based on Availability)
- 16.2.8 Wrike Inc
- 16.2.8.1. Overview
- 16.2.8.2. Products
- 16.2.8.3. SWOT Analysis
- 16.2.8.4. Recent Developments
- 16.2.8.5. Financials (Based on Availability)
- 16.2.9 Asana Inc
- 16.2.9.1. Overview
- 16.2.9.2. Products
- 16.2.9.3. SWOT Analysis
- 16.2.9.4. Recent Developments
- 16.2.9.5. Financials (Based on Availability)
- 16.2.10 Cybozu Inc *List Not Exhaustive
- 16.2.10.1. Overview
- 16.2.10.2. Products
- 16.2.10.3. SWOT Analysis
- 16.2.10.4. Recent Developments
- 16.2.10.5. Financials (Based on Availability)
- 16.2.1 Atlassian Corporation PLC
List of Figures
- Figure 1: Global Team Collaboration Tools Industry Revenue Breakdown (Million, %) by Region 2024 & 2032
- Figure 2: North America Team Collaboration Tools Industry Revenue (Million), by Country 2024 & 2032
- Figure 3: North America Team Collaboration Tools Industry Revenue Share (%), by Country 2024 & 2032
- Figure 4: Europe Team Collaboration Tools Industry Revenue (Million), by Country 2024 & 2032
- Figure 5: Europe Team Collaboration Tools Industry Revenue Share (%), by Country 2024 & 2032
- Figure 6: Asia Pacific Team Collaboration Tools Industry Revenue (Million), by Country 2024 & 2032
- Figure 7: Asia Pacific Team Collaboration Tools Industry Revenue Share (%), by Country 2024 & 2032
- Figure 8: Latin America Team Collaboration Tools Industry Revenue (Million), by Country 2024 & 2032
- Figure 9: Latin America Team Collaboration Tools Industry Revenue Share (%), by Country 2024 & 2032
- Figure 10: Middle East and Africa Team Collaboration Tools Industry Revenue (Million), by Country 2024 & 2032
- Figure 11: Middle East and Africa Team Collaboration Tools Industry Revenue Share (%), by Country 2024 & 2032
- Figure 12: North America Team Collaboration Tools Industry Revenue (Million), by Type of Deployment 2024 & 2032
- Figure 13: North America Team Collaboration Tools Industry Revenue Share (%), by Type of Deployment 2024 & 2032
- Figure 14: North America Team Collaboration Tools Industry Revenue (Million), by Organization Size 2024 & 2032
- Figure 15: North America Team Collaboration Tools Industry Revenue Share (%), by Organization Size 2024 & 2032
- Figure 16: North America Team Collaboration Tools Industry Revenue (Million), by Country 2024 & 2032
- Figure 17: North America Team Collaboration Tools Industry Revenue Share (%), by Country 2024 & 2032
- Figure 18: Europe Team Collaboration Tools Industry Revenue (Million), by Type of Deployment 2024 & 2032
- Figure 19: Europe Team Collaboration Tools Industry Revenue Share (%), by Type of Deployment 2024 & 2032
- Figure 20: Europe Team Collaboration Tools Industry Revenue (Million), by Organization Size 2024 & 2032
- Figure 21: Europe Team Collaboration Tools Industry Revenue Share (%), by Organization Size 2024 & 2032
- Figure 22: Europe Team Collaboration Tools Industry Revenue (Million), by Country 2024 & 2032
- Figure 23: Europe Team Collaboration Tools Industry Revenue Share (%), by Country 2024 & 2032
- Figure 24: Asia Pacific Team Collaboration Tools Industry Revenue (Million), by Type of Deployment 2024 & 2032
- Figure 25: Asia Pacific Team Collaboration Tools Industry Revenue Share (%), by Type of Deployment 2024 & 2032
- Figure 26: Asia Pacific Team Collaboration Tools Industry Revenue (Million), by Organization Size 2024 & 2032
- Figure 27: Asia Pacific Team Collaboration Tools Industry Revenue Share (%), by Organization Size 2024 & 2032
- Figure 28: Asia Pacific Team Collaboration Tools Industry Revenue (Million), by Country 2024 & 2032
- Figure 29: Asia Pacific Team Collaboration Tools Industry Revenue Share (%), by Country 2024 & 2032
- Figure 30: Latin America Team Collaboration Tools Industry Revenue (Million), by Type of Deployment 2024 & 2032
- Figure 31: Latin America Team Collaboration Tools Industry Revenue Share (%), by Type of Deployment 2024 & 2032
- Figure 32: Latin America Team Collaboration Tools Industry Revenue (Million), by Organization Size 2024 & 2032
- Figure 33: Latin America Team Collaboration Tools Industry Revenue Share (%), by Organization Size 2024 & 2032
- Figure 34: Latin America Team Collaboration Tools Industry Revenue (Million), by Country 2024 & 2032
- Figure 35: Latin America Team Collaboration Tools Industry Revenue Share (%), by Country 2024 & 2032
- Figure 36: Middle East and Africa Team Collaboration Tools Industry Revenue (Million), by Type of Deployment 2024 & 2032
- Figure 37: Middle East and Africa Team Collaboration Tools Industry Revenue Share (%), by Type of Deployment 2024 & 2032
- Figure 38: Middle East and Africa Team Collaboration Tools Industry Revenue (Million), by Organization Size 2024 & 2032
- Figure 39: Middle East and Africa Team Collaboration Tools Industry Revenue Share (%), by Organization Size 2024 & 2032
- Figure 40: Middle East and Africa Team Collaboration Tools Industry Revenue (Million), by Country 2024 & 2032
- Figure 41: Middle East and Africa Team Collaboration Tools Industry Revenue Share (%), by Country 2024 & 2032
List of Tables
- Table 1: Global Team Collaboration Tools Industry Revenue Million Forecast, by Region 2019 & 2032
- Table 2: Global Team Collaboration Tools Industry Revenue Million Forecast, by Type of Deployment 2019 & 2032
- Table 3: Global Team Collaboration Tools Industry Revenue Million Forecast, by Organization Size 2019 & 2032
- Table 4: Global Team Collaboration Tools Industry Revenue Million Forecast, by Region 2019 & 2032
- Table 5: Global Team Collaboration Tools Industry Revenue Million Forecast, by Country 2019 & 2032
- Table 6: United States Team Collaboration Tools Industry Revenue (Million) Forecast, by Application 2019 & 2032
- Table 7: Canada Team Collaboration Tools Industry Revenue (Million) Forecast, by Application 2019 & 2032
- Table 8: Global Team Collaboration Tools Industry Revenue Million Forecast, by Country 2019 & 2032
- Table 9: Germany Team Collaboration Tools Industry Revenue (Million) Forecast, by Application 2019 & 2032
- Table 10: United Kingdom Team Collaboration Tools Industry Revenue (Million) Forecast, by Application 2019 & 2032
- Table 11: France Team Collaboration Tools Industry Revenue (Million) Forecast, by Application 2019 & 2032
- Table 12: Rest of Europe Team Collaboration Tools Industry Revenue (Million) Forecast, by Application 2019 & 2032
- Table 13: Global Team Collaboration Tools Industry Revenue Million Forecast, by Country 2019 & 2032
- Table 14: India Team Collaboration Tools Industry Revenue (Million) Forecast, by Application 2019 & 2032
- Table 15: China Team Collaboration Tools Industry Revenue (Million) Forecast, by Application 2019 & 2032
- Table 16: Japan Team Collaboration Tools Industry Revenue (Million) Forecast, by Application 2019 & 2032
- Table 17: Rest of Asia Pacific Team Collaboration Tools Industry Revenue (Million) Forecast, by Application 2019 & 2032
- Table 18: Global Team Collaboration Tools Industry Revenue Million Forecast, by Country 2019 & 2032
- Table 19: Brazil Team Collaboration Tools Industry Revenue (Million) Forecast, by Application 2019 & 2032
- Table 20: Argentina Team Collaboration Tools Industry Revenue (Million) Forecast, by Application 2019 & 2032
- Table 21: Rest of Latin America Team Collaboration Tools Industry Revenue (Million) Forecast, by Application 2019 & 2032
- Table 22: Global Team Collaboration Tools Industry Revenue Million Forecast, by Country 2019 & 2032
- Table 23: United Arab Emirates Team Collaboration Tools Industry Revenue (Million) Forecast, by Application 2019 & 2032
- Table 24: Saudi Arabia Team Collaboration Tools Industry Revenue (Million) Forecast, by Application 2019 & 2032
- Table 25: Africa Team Collaboration Tools Industry Revenue (Million) Forecast, by Application 2019 & 2032
- Table 26: Rest of Middle East and Africa Team Collaboration Tools Industry Revenue (Million) Forecast, by Application 2019 & 2032
- Table 27: Global Team Collaboration Tools Industry Revenue Million Forecast, by Type of Deployment 2019 & 2032
- Table 28: Global Team Collaboration Tools Industry Revenue Million Forecast, by Organization Size 2019 & 2032
- Table 29: Global Team Collaboration Tools Industry Revenue Million Forecast, by Country 2019 & 2032
- Table 30: United States Team Collaboration Tools Industry Revenue (Million) Forecast, by Application 2019 & 2032
- Table 31: Canada Team Collaboration Tools Industry Revenue (Million) Forecast, by Application 2019 & 2032
- Table 32: Global Team Collaboration Tools Industry Revenue Million Forecast, by Type of Deployment 2019 & 2032
- Table 33: Global Team Collaboration Tools Industry Revenue Million Forecast, by Organization Size 2019 & 2032
- Table 34: Global Team Collaboration Tools Industry Revenue Million Forecast, by Country 2019 & 2032
- Table 35: Germany Team Collaboration Tools Industry Revenue (Million) Forecast, by Application 2019 & 2032
- Table 36: United Kingdom Team Collaboration Tools Industry Revenue (Million) Forecast, by Application 2019 & 2032
- Table 37: France Team Collaboration Tools Industry Revenue (Million) Forecast, by Application 2019 & 2032
- Table 38: Rest of Europe Team Collaboration Tools Industry Revenue (Million) Forecast, by Application 2019 & 2032
- Table 39: Global Team Collaboration Tools Industry Revenue Million Forecast, by Type of Deployment 2019 & 2032
- Table 40: Global Team Collaboration Tools Industry Revenue Million Forecast, by Organization Size 2019 & 2032
- Table 41: Global Team Collaboration Tools Industry Revenue Million Forecast, by Country 2019 & 2032
- Table 42: India Team Collaboration Tools Industry Revenue (Million) Forecast, by Application 2019 & 2032
- Table 43: China Team Collaboration Tools Industry Revenue (Million) Forecast, by Application 2019 & 2032
- Table 44: Japan Team Collaboration Tools Industry Revenue (Million) Forecast, by Application 2019 & 2032
- Table 45: Rest of Asia Pacific Team Collaboration Tools Industry Revenue (Million) Forecast, by Application 2019 & 2032
- Table 46: Global Team Collaboration Tools Industry Revenue Million Forecast, by Type of Deployment 2019 & 2032
- Table 47: Global Team Collaboration Tools Industry Revenue Million Forecast, by Organization Size 2019 & 2032
- Table 48: Global Team Collaboration Tools Industry Revenue Million Forecast, by Country 2019 & 2032
- Table 49: Brazil Team Collaboration Tools Industry Revenue (Million) Forecast, by Application 2019 & 2032
- Table 50: Argentina Team Collaboration Tools Industry Revenue (Million) Forecast, by Application 2019 & 2032
- Table 51: Rest of Latin America Team Collaboration Tools Industry Revenue (Million) Forecast, by Application 2019 & 2032
- Table 52: Global Team Collaboration Tools Industry Revenue Million Forecast, by Type of Deployment 2019 & 2032
- Table 53: Global Team Collaboration Tools Industry Revenue Million Forecast, by Organization Size 2019 & 2032
- Table 54: Global Team Collaboration Tools Industry Revenue Million Forecast, by Country 2019 & 2032
- Table 55: United Arab Emirates Team Collaboration Tools Industry Revenue (Million) Forecast, by Application 2019 & 2032
- Table 56: Saudi Arabia Team Collaboration Tools Industry Revenue (Million) Forecast, by Application 2019 & 2032
- Table 57: Africa Team Collaboration Tools Industry Revenue (Million) Forecast, by Application 2019 & 2032
- Table 58: Rest of Middle East and Africa Team Collaboration Tools Industry Revenue (Million) Forecast, by Application 2019 & 2032
Frequently Asked Questions
1. What is the projected Compound Annual Growth Rate (CAGR) of the Team Collaboration Tools Industry?
The projected CAGR is approximately 18.00%.
2. Which companies are prominent players in the Team Collaboration Tools Industry?
Key companies in the market include Atlassian Corporation PLC, Slack Technologies Inc, Huddle (Ninian Solutions Limited), Smartsheet Inc, Microsoft Corporation, TigerConnect Inc, Symphony Communication Services LLC, Wrike Inc, Asana Inc, Cybozu Inc *List Not Exhaustive.
3. What are the main segments of the Team Collaboration Tools Industry?
The market segments include Type of Deployment, Organization Size.
4. Can you provide details about the market size?
The market size is estimated to be USD XX Million as of 2022.
5. What are some drivers contributing to market growth?
Increasing Need for Tools to Make Work Seamless and Agile; Continuous Innovation in Team Collaborative Tool Offerings.
6. What are the notable trends driving market growth?
Continuous Innovation in Team Collaboration Tool Offerings to Increase Market Growth.
7. Are there any restraints impacting market growth?
Compliance and Governance Issues.
8. Can you provide examples of recent developments in the market?
April 2022: Slack Technologies Inc., along with Salesforce, announced the release of new tools to accelerate team performance. This includes the digital HQ to give customers unlimited ways to customize Slack, automate workflows, and adapt their workspaces to meet the specific needs of their teams.
9. What pricing options are available for accessing the report?
Pricing options include single-user, multi-user, and enterprise licenses priced at USD 4750, USD 5250, and USD 8750 respectively.
10. Is the market size provided in terms of value or volume?
The market size is provided in terms of value, measured in Million.
11. Are there any specific market keywords associated with the report?
Yes, the market keyword associated with the report is "Team Collaboration Tools Industry," which aids in identifying and referencing the specific market segment covered.
12. How do I determine which pricing option suits my needs best?
The pricing options vary based on user requirements and access needs. Individual users may opt for single-user licenses, while businesses requiring broader access may choose multi-user or enterprise licenses for cost-effective access to the report.
13. Are there any additional resources or data provided in the Team Collaboration Tools Industry report?
While the report offers comprehensive insights, it's advisable to review the specific contents or supplementary materials provided to ascertain if additional resources or data are available.
14. How can I stay updated on further developments or reports in the Team Collaboration Tools Industry?
To stay informed about further developments, trends, and reports in the Team Collaboration Tools Industry, consider subscribing to industry newsletters, following relevant companies and organizations, or regularly checking reputable industry news sources and publications.
Methodology
Step 1 - Identification of Relevant Samples Size from Population Database


Step 2 - Approaches for Defining Global Market Size (Value, Volume* & Price*)

Note*: In applicable scenarios
Step 3 - Data Sources
Primary Research
- Web Analytics
- Survey Reports
- Research Institute
- Latest Research Reports
- Opinion Leaders
Secondary Research
- Annual Reports
- White Paper
- Latest Press Release
- Industry Association
- Paid Database
- Investor Presentations

Step 4 - Data Triangulation
Involves using different sources of information in order to increase the validity of a study
These sources are likely to be stakeholders in a program - participants, other researchers, program staff, other community members, and so on.
Then we put all data in single framework & apply various statistical tools to find out the dynamic on the market.
During the analysis stage, feedback from the stakeholder groups would be compared to determine areas of agreement as well as areas of divergence


