
Key Insights
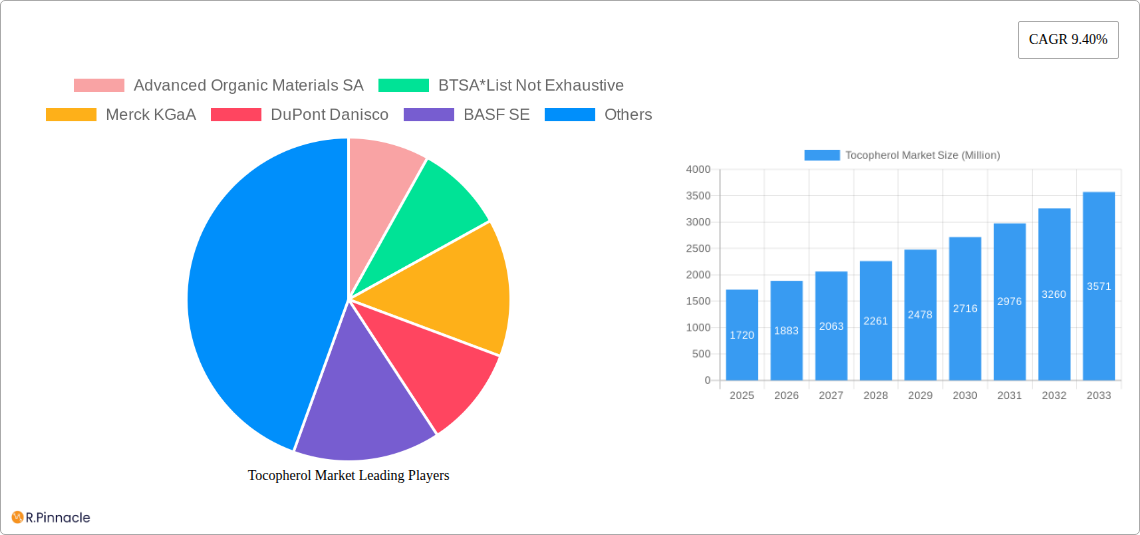
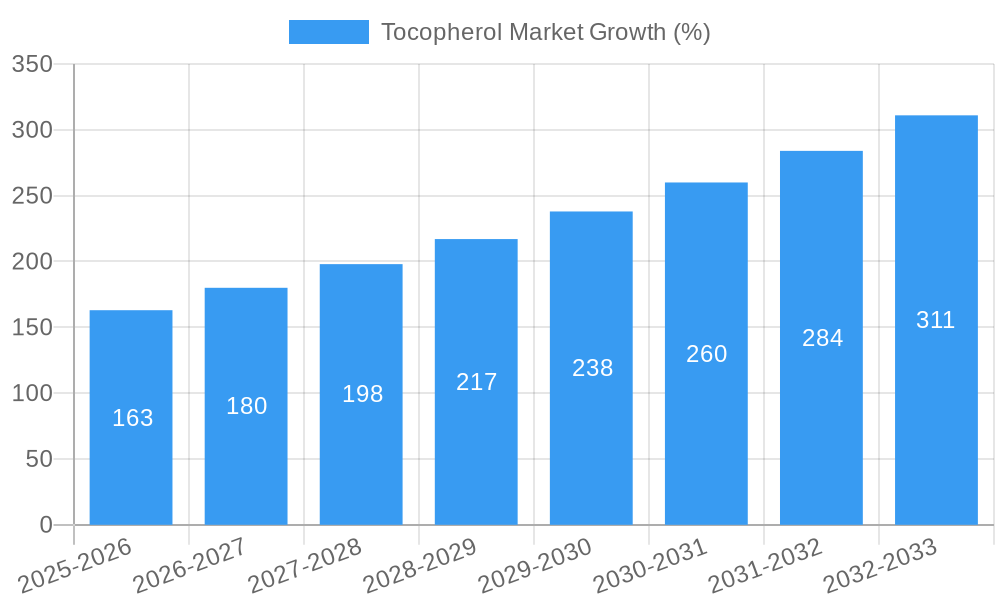
The global tocopherol market, valued at $1720 million in 2025, is projected to experience robust growth, driven by increasing demand from the food and beverage, pharmaceutical, and cosmetics industries. The market's Compound Annual Growth Rate (CAGR) of 9.40% from 2025 to 2033 reflects a significant expansion opportunity. Key drivers include the growing awareness of the health benefits of tocopherols as antioxidants, their increasing use as nutritional supplements, and their incorporation into functional foods and beverages. Furthermore, the rising demand for natural and organic ingredients across various sectors is fueling market growth. Soybean oil currently dominates as the primary tocopherol source, but other sources, like sunflower and rapeseed oil, are gaining traction due to consumer preferences and regional availability. The food and beverage segment constitutes a major application area, while the pharmaceutical and cosmetics sectors show promising growth potential due to tocopherols' use in drug formulations and skincare products. However, price fluctuations in raw materials and potential regulatory changes could pose challenges to market expansion. Competition among key players, including Advanced Organic Materials SA, BASF SE, and Cargill Inc., is intense, leading to continuous innovation and product diversification. Geographic expansion into emerging markets in Asia-Pacific and South America presents significant growth opportunities.
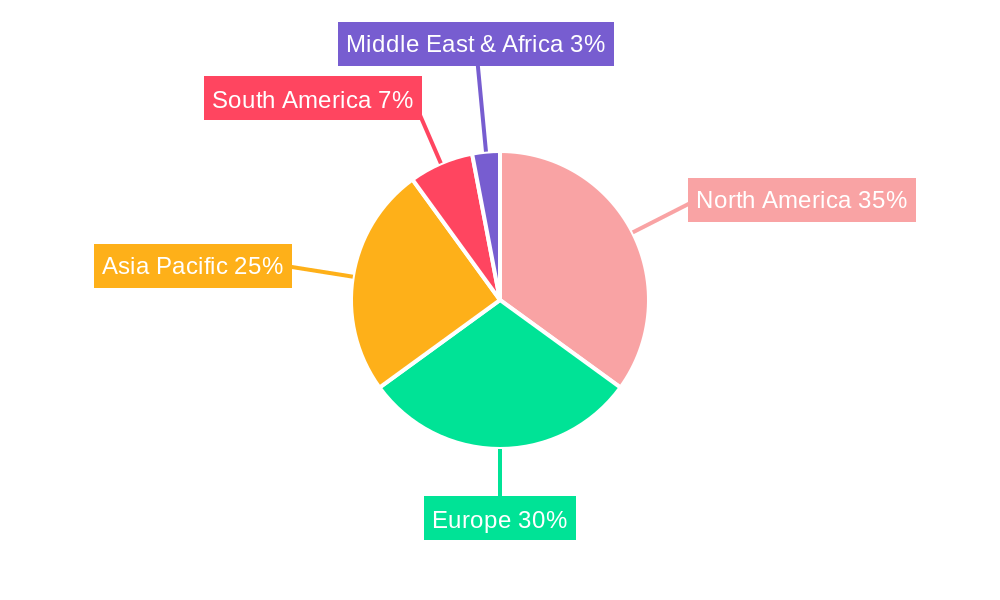
The projected market size for 2033 can be estimated by applying the CAGR to the 2025 value. Considering a 9.40% CAGR, the market size would significantly increase during the forecast period. Regional variations are expected, with North America and Europe maintaining substantial market share due to high per capita consumption and established markets. However, rapid economic growth and rising health awareness in Asia-Pacific are driving significant expansion in this region, presenting lucrative opportunities for market players. While the current market is dominated by established players, the entry of new players and the development of innovative tocopherol-based products are likely to shape the competitive landscape in the coming years. The market will likely see an increasing focus on sustainability and traceability of ingredients as consumer preferences evolve.
Tocopherol Market Report: A Comprehensive Analysis (2019-2033)
This in-depth report provides a comprehensive analysis of the Tocopherol market, offering actionable insights for industry professionals. Covering the period 2019-2033, with a base year of 2025, this report meticulously examines market dynamics, segmentation, key players, and future growth prospects. The report leverages extensive research to provide a clear understanding of the current market landscape and future trajectories.
Tocopherol Market Structure & Innovation Trends
This section analyzes the Tocopherol market's competitive landscape, encompassing market concentration, innovation drivers, regulatory frameworks, product substitutes, end-user demographics, and M&A activities.
The market exhibits a moderately consolidated structure, with key players like BASF SE, Archer Daniels Midland, and Cargill Inc. holding significant market share. Estimates suggest these top 5 players collectively command approximately xx% of the market. Innovation is driven by the increasing demand for natural and sustainable Tocopherol sources, prompting research into more efficient extraction methods and novel applications. Regulatory frameworks vary across regions, influencing production and labeling requirements. Synthetic Tocopherols face competition from natural alternatives, with consumer preference shifting towards the latter. The market witnessed xx M&A deals valued at approximately xx Million during the historical period (2019-2024), mainly focused on expanding production capacity and geographic reach.
- Market Concentration: Moderately consolidated, top 5 players hold approximately xx% market share.
- Innovation Drivers: Demand for natural sources, efficient extraction, new applications.
- Regulatory Landscape: Varies across regions, impacting production and labeling.
- Product Substitutes: Synthetic Tocopherols compete with natural alternatives.
- M&A Activity: xx deals valued at approximately xx Million during 2019-2024.
Tocopherol Market Dynamics & Trends
This section explores the key drivers and trends shaping the Tocopherol market's growth trajectory. The market has experienced a CAGR of xx% during the historical period (2019-2024) and is projected to maintain a CAGR of xx% during the forecast period (2025-2033). Growth is primarily fueled by rising demand from the food and beverage, pharmaceuticals, and cosmetics sectors, driven by the increasing awareness of Tocopherol's health benefits as an antioxidant. Technological advancements in extraction and purification processes are further enhancing market growth. Changing consumer preferences towards natural and organic products are also significantly impacting market dynamics. Competitive intensity remains high, with existing players focusing on product diversification and strategic partnerships to maintain their market position. Market penetration is highest in developed regions, with developing economies witnessing significant growth potential.
Dominant Regions & Segments in Tocopherol Market
This section identifies the leading regions and segments within the Tocopherol market.
By Source: Soybean oil currently dominates the Tocopherol market, accounting for approximately xx% of the total volume. This is driven by its wide availability, cost-effectiveness, and high Tocopherol content. Rapeseed oil and Sunflower oil segments also exhibit significant growth potential, particularly in regions where these crops are abundantly produced.
By Application: The food and beverage sector is the largest consumer of Tocopherol, followed by the feed and pharmaceuticals industries. The growing demand for functional foods and fortified products is bolstering growth in this segment. Cosmetics also present a significant application area, driven by the demand for natural preservatives and antioxidants.
- Key Drivers (Soybean Oil): Wide availability, cost-effectiveness, high Tocopherol content.
- Key Drivers (Food & Beverage): Growing demand for functional foods, fortified products.
- Dominant Region: North America currently holds the largest market share due to high consumption in the food and beverage sector and established production capacities. Europe follows closely, showcasing strong demand across various applications.
Tocopherol Market Product Innovations
Recent innovations focus on enhancing the extraction efficiency of Tocopherol from various sources, including the development of more sustainable and environmentally friendly methods. The development of Tocopherol-enriched functional foods and dietary supplements is driving application innovation. Companies are also focusing on improving the bioavailability and stability of Tocopherol to increase its efficacy in various applications. This includes the development of novel delivery systems and formulations that improve product shelf life and consumer acceptability.
Report Scope & Segmentation Analysis
The report covers the Tocopherol market across various segments:
By Source: Soybean Oil, Rapeseed Oil, Corn Oil, Sunflower Oil. Each segment is analyzed based on its market size, growth rate, and competitive dynamics. Soybean oil currently holds the largest market share, with xx Million in 2025, projected to grow to xx Million by 2033.
By Application: Food and Beverage, Feed, Pharmaceuticals, Cosmetics, Others. Each segment is assessed based on its market size, growth rate, and key players. The Food and Beverage segment is anticipated to retain its dominant position throughout the forecast period.
Key Drivers of Tocopherol Market Growth
The Tocopherol market's growth is driven by several factors: the increasing demand for natural antioxidants in the food and beverage industry, the rising health consciousness among consumers, the expanding applications of Tocopherol in pharmaceuticals and cosmetics, and technological advancements in extraction and purification processes. Government regulations promoting the use of natural ingredients also contribute significantly. The growth in the global population and increasing disposable incomes are further fueling market expansion, particularly in developing economies.
Challenges in the Tocopherol Market Sector
Challenges include fluctuations in raw material prices (soybean, rapeseed, etc.), stringent regulations governing the use of Tocopherol in different applications, competition from synthetic antioxidants, and concerns about the sustainability of Tocopherol production processes. Supply chain disruptions and the potential for adulteration also pose significant challenges. These factors can influence the market's overall growth trajectory. The projected impact of these challenges on overall market value is estimated at xx Million over the forecast period.
Emerging Opportunities in Tocopherol Market
Emerging opportunities lie in the expanding application of Tocopherol in nutraceuticals, functional foods, and personalized nutrition. The growing demand for natural and organic products creates a significant opportunity for Tocopherol producers. Advancements in encapsulation and delivery technologies further enhance market potential. The exploration of new sources of Tocopherol and development of sustainable production practices present additional growth avenues.
Leading Players in the Tocopherol Market Market
- Advanced Organic Materials SA
- BTSA
- Merck KGaA (Merck KGaA)
- DuPont Danisco (DuPont)
- BASF SE (BASF SE)
- Archer Daniels Midland (Archer Daniels Midland)
- Cargill Inc (Cargill Inc)
- Royal DSM (Royal DSM)
- Kerry Group (Kerry Group)
- Evonik Industries (Evonik Industries)
- Nippon Oil & Fat
Key Developments in Tocopherol Market Industry
- 2022 Q3: BASF SE launched a new line of Tocopherol-based antioxidants for food applications.
- 2023 Q1: Archer Daniels Midland announced a strategic partnership to expand Tocopherol production capacity.
- 2024 Q2: Cargill Inc invested in a new sustainable Tocopherol extraction technology. (Further details require additional data)
Future Outlook for Tocopherol Market Market
The Tocopherol market is poised for robust growth over the forecast period, driven by increasing health awareness, the expansion of applications, and the continued development of sustainable production methods. Strategic partnerships, technological advancements, and a focus on developing natural and organic products will be crucial for players seeking to capitalize on future opportunities. The market is anticipated to reach xx Million by 2033, presenting significant potential for both established and emerging players.
Tocopherol Market Segmentation
-
1. Source
- 1.1. Soybean Oil
- 1.2. Rapeseed Oil
- 1.3. Corn Oil
- 1.4. Sunflower Oil
-
2. Application
- 2.1. Food and Beverage
- 2.2. Feed
- 2.3. Pharmaceuticals
- 2.4. Cosmetics
- 2.5. Others
Tocopherol Market Segmentation By Geography
-
1. North America
- 1.1. United States
- 1.2. Canada
- 1.3. Mexico
- 1.4. Rest of North America
-
2. Europe
- 2.1. Germany
- 2.2. United Kingdom
- 2.3. France
- 2.4. Russia
- 2.5. Spain
- 2.6. Rest of Europe
-
3. Asia Pacific
- 3.1. India
- 3.2. Australia
- 3.3. China
- 3.4. Japan
- 3.5. Rest of Asia Pacific
-
4. South America
- 4.1. Brazil
- 4.2. Argentina
- 4.3. Rest of South America
- 5. Middle East
-
6. United Arab Emirates
- 6.1. Saudi Africa
- 6.2. Rest of Middle East
Tocopherol Market REPORT HIGHLIGHTS
| Aspects | Details |
|---|---|
| Study Period | 2019-2033 |
| Base Year | 2024 |
| Estimated Year | 2025 |
| Forecast Period | 2025-2033 |
| Historical Period | 2019-2024 |
| Growth Rate | CAGR of 9.40% from 2019-2033 |
| Segmentation |
|
Table of Contents
- 1. Introduction
- 1.1. Research Scope
- 1.2. Market Segmentation
- 1.3. Research Methodology
- 1.4. Definitions and Assumptions
- 2. Executive Summary
- 2.1. Introduction
- 3. Market Dynamics
- 3.1. Introduction
- 3.2. Market Drivers
- 3.2.1. Increasing Demand for Organic Plant Proteins; Increasing Application of Pea Protein in Food and Beverages
- 3.3. Market Restrains
- 3.3.1. Presence of Alternative protein sources
- 3.4. Market Trends
- 3.4.1. Strong Demand from Feed Industry
- 4. Market Factor Analysis
- 4.1. Porters Five Forces
- 4.2. Supply/Value Chain
- 4.3. PESTEL analysis
- 4.4. Market Entropy
- 4.5. Patent/Trademark Analysis
- 5. Global Tocopherol Market Analysis, Insights and Forecast, 2019-2031
- 5.1. Market Analysis, Insights and Forecast - by Source
- 5.1.1. Soybean Oil
- 5.1.2. Rapeseed Oil
- 5.1.3. Corn Oil
- 5.1.4. Sunflower Oil
- 5.2. Market Analysis, Insights and Forecast - by Application
- 5.2.1. Food and Beverage
- 5.2.2. Feed
- 5.2.3. Pharmaceuticals
- 5.2.4. Cosmetics
- 5.2.5. Others
- 5.3. Market Analysis, Insights and Forecast - by Region
- 5.3.1. North America
- 5.3.2. Europe
- 5.3.3. Asia Pacific
- 5.3.4. South America
- 5.3.5. Middle East
- 5.3.6. United Arab Emirates
- 5.1. Market Analysis, Insights and Forecast - by Source
- 6. North America Tocopherol Market Analysis, Insights and Forecast, 2019-2031
- 6.1. Market Analysis, Insights and Forecast - by Source
- 6.1.1. Soybean Oil
- 6.1.2. Rapeseed Oil
- 6.1.3. Corn Oil
- 6.1.4. Sunflower Oil
- 6.2. Market Analysis, Insights and Forecast - by Application
- 6.2.1. Food and Beverage
- 6.2.2. Feed
- 6.2.3. Pharmaceuticals
- 6.2.4. Cosmetics
- 6.2.5. Others
- 6.1. Market Analysis, Insights and Forecast - by Source
- 7. Europe Tocopherol Market Analysis, Insights and Forecast, 2019-2031
- 7.1. Market Analysis, Insights and Forecast - by Source
- 7.1.1. Soybean Oil
- 7.1.2. Rapeseed Oil
- 7.1.3. Corn Oil
- 7.1.4. Sunflower Oil
- 7.2. Market Analysis, Insights and Forecast - by Application
- 7.2.1. Food and Beverage
- 7.2.2. Feed
- 7.2.3. Pharmaceuticals
- 7.2.4. Cosmetics
- 7.2.5. Others
- 7.1. Market Analysis, Insights and Forecast - by Source
- 8. Asia Pacific Tocopherol Market Analysis, Insights and Forecast, 2019-2031
- 8.1. Market Analysis, Insights and Forecast - by Source
- 8.1.1. Soybean Oil
- 8.1.2. Rapeseed Oil
- 8.1.3. Corn Oil
- 8.1.4. Sunflower Oil
- 8.2. Market Analysis, Insights and Forecast - by Application
- 8.2.1. Food and Beverage
- 8.2.2. Feed
- 8.2.3. Pharmaceuticals
- 8.2.4. Cosmetics
- 8.2.5. Others
- 8.1. Market Analysis, Insights and Forecast - by Source
- 9. South America Tocopherol Market Analysis, Insights and Forecast, 2019-2031
- 9.1. Market Analysis, Insights and Forecast - by Source
- 9.1.1. Soybean Oil
- 9.1.2. Rapeseed Oil
- 9.1.3. Corn Oil
- 9.1.4. Sunflower Oil
- 9.2. Market Analysis, Insights and Forecast - by Application
- 9.2.1. Food and Beverage
- 9.2.2. Feed
- 9.2.3. Pharmaceuticals
- 9.2.4. Cosmetics
- 9.2.5. Others
- 9.1. Market Analysis, Insights and Forecast - by Source
- 10. Middle East Tocopherol Market Analysis, Insights and Forecast, 2019-2031
- 10.1. Market Analysis, Insights and Forecast - by Source
- 10.1.1. Soybean Oil
- 10.1.2. Rapeseed Oil
- 10.1.3. Corn Oil
- 10.1.4. Sunflower Oil
- 10.2. Market Analysis, Insights and Forecast - by Application
- 10.2.1. Food and Beverage
- 10.2.2. Feed
- 10.2.3. Pharmaceuticals
- 10.2.4. Cosmetics
- 10.2.5. Others
- 10.1. Market Analysis, Insights and Forecast - by Source
- 11. United Arab Emirates Tocopherol Market Analysis, Insights and Forecast, 2019-2031
- 11.1. Market Analysis, Insights and Forecast - by Source
- 11.1.1. Soybean Oil
- 11.1.2. Rapeseed Oil
- 11.1.3. Corn Oil
- 11.1.4. Sunflower Oil
- 11.2. Market Analysis, Insights and Forecast - by Application
- 11.2.1. Food and Beverage
- 11.2.2. Feed
- 11.2.3. Pharmaceuticals
- 11.2.4. Cosmetics
- 11.2.5. Others
- 11.1. Market Analysis, Insights and Forecast - by Source
- 12. North America Tocopherol Market Analysis, Insights and Forecast, 2019-2031
- 12.1. Market Analysis, Insights and Forecast - By Country/Sub-region
- 12.1.1 United States
- 12.1.2 Canada
- 12.1.3 Mexico
- 12.1.4 Rest of North America
- 13. Europe Tocopherol Market Analysis, Insights and Forecast, 2019-2031
- 13.1. Market Analysis, Insights and Forecast - By Country/Sub-region
- 13.1.1 Germany
- 13.1.2 United Kingdom
- 13.1.3 France
- 13.1.4 Russia
- 13.1.5 Spain
- 13.1.6 Rest of Europe
- 14. Asia Pacific Tocopherol Market Analysis, Insights and Forecast, 2019-2031
- 14.1. Market Analysis, Insights and Forecast - By Country/Sub-region
- 14.1.1 India
- 14.1.2 Australia
- 14.1.3 China
- 14.1.4 Japan
- 14.1.5 Rest of Asia Pacific
- 15. South America Tocopherol Market Analysis, Insights and Forecast, 2019-2031
- 15.1. Market Analysis, Insights and Forecast - By Country/Sub-region
- 15.1.1 Brazil
- 15.1.2 Argentina
- 15.1.3 Rest of South America
- 16. Middle East Tocopherol Market Analysis, Insights and Forecast, 2019-2031
- 16.1. Market Analysis, Insights and Forecast - By Country/Sub-region
- 16.1.1 Middle East
- 16.1.2 Africa
- 17. United Arab Emirates Tocopherol Market Analysis, Insights and Forecast, 2019-2031
- 17.1. Market Analysis, Insights and Forecast - By Country/Sub-region
- 17.1.1 Saudi Africa
- 17.1.2 Rest of Middle East
- 18. Competitive Analysis
- 18.1. Global Market Share Analysis 2024
- 18.2. Company Profiles
- 18.2.1 Advanced Organic Materials SA
- 18.2.1.1. Overview
- 18.2.1.2. Products
- 18.2.1.3. SWOT Analysis
- 18.2.1.4. Recent Developments
- 18.2.1.5. Financials (Based on Availability)
- 18.2.2 BTSA*List Not Exhaustive
- 18.2.2.1. Overview
- 18.2.2.2. Products
- 18.2.2.3. SWOT Analysis
- 18.2.2.4. Recent Developments
- 18.2.2.5. Financials (Based on Availability)
- 18.2.3 Merck KGaA
- 18.2.3.1. Overview
- 18.2.3.2. Products
- 18.2.3.3. SWOT Analysis
- 18.2.3.4. Recent Developments
- 18.2.3.5. Financials (Based on Availability)
- 18.2.4 DuPont Danisco
- 18.2.4.1. Overview
- 18.2.4.2. Products
- 18.2.4.3. SWOT Analysis
- 18.2.4.4. Recent Developments
- 18.2.4.5. Financials (Based on Availability)
- 18.2.5 BASF SE
- 18.2.5.1. Overview
- 18.2.5.2. Products
- 18.2.5.3. SWOT Analysis
- 18.2.5.4. Recent Developments
- 18.2.5.5. Financials (Based on Availability)
- 18.2.6 Archer Daniels Midland
- 18.2.6.1. Overview
- 18.2.6.2. Products
- 18.2.6.3. SWOT Analysis
- 18.2.6.4. Recent Developments
- 18.2.6.5. Financials (Based on Availability)
- 18.2.7 Cargill Inc
- 18.2.7.1. Overview
- 18.2.7.2. Products
- 18.2.7.3. SWOT Analysis
- 18.2.7.4. Recent Developments
- 18.2.7.5. Financials (Based on Availability)
- 18.2.8 Royal DSM
- 18.2.8.1. Overview
- 18.2.8.2. Products
- 18.2.8.3. SWOT Analysis
- 18.2.8.4. Recent Developments
- 18.2.8.5. Financials (Based on Availability)
- 18.2.9 Kerry Group
- 18.2.9.1. Overview
- 18.2.9.2. Products
- 18.2.9.3. SWOT Analysis
- 18.2.9.4. Recent Developments
- 18.2.9.5. Financials (Based on Availability)
- 18.2.10 Evonik Industries
- 18.2.10.1. Overview
- 18.2.10.2. Products
- 18.2.10.3. SWOT Analysis
- 18.2.10.4. Recent Developments
- 18.2.10.5. Financials (Based on Availability)
- 18.2.11 Nippon Oil & Fat
- 18.2.11.1. Overview
- 18.2.11.2. Products
- 18.2.11.3. SWOT Analysis
- 18.2.11.4. Recent Developments
- 18.2.11.5. Financials (Based on Availability)
- 18.2.1 Advanced Organic Materials SA
List of Figures
- Figure 1: Global Tocopherol Market Revenue Breakdown (Million, %) by Region 2024 & 2032
- Figure 2: Global Tocopherol Market Volume Breakdown (K Tons, %) by Region 2024 & 2032
- Figure 3: North America Tocopherol Market Revenue (Million), by Country 2024 & 2032
- Figure 4: North America Tocopherol Market Volume (K Tons), by Country 2024 & 2032
- Figure 5: North America Tocopherol Market Revenue Share (%), by Country 2024 & 2032
- Figure 6: North America Tocopherol Market Volume Share (%), by Country 2024 & 2032
- Figure 7: Europe Tocopherol Market Revenue (Million), by Country 2024 & 2032
- Figure 8: Europe Tocopherol Market Volume (K Tons), by Country 2024 & 2032
- Figure 9: Europe Tocopherol Market Revenue Share (%), by Country 2024 & 2032
- Figure 10: Europe Tocopherol Market Volume Share (%), by Country 2024 & 2032
- Figure 11: Asia Pacific Tocopherol Market Revenue (Million), by Country 2024 & 2032
- Figure 12: Asia Pacific Tocopherol Market Volume (K Tons), by Country 2024 & 2032
- Figure 13: Asia Pacific Tocopherol Market Revenue Share (%), by Country 2024 & 2032
- Figure 14: Asia Pacific Tocopherol Market Volume Share (%), by Country 2024 & 2032
- Figure 15: South America Tocopherol Market Revenue (Million), by Country 2024 & 2032
- Figure 16: South America Tocopherol Market Volume (K Tons), by Country 2024 & 2032
- Figure 17: South America Tocopherol Market Revenue Share (%), by Country 2024 & 2032
- Figure 18: South America Tocopherol Market Volume Share (%), by Country 2024 & 2032
- Figure 19: Middle East Tocopherol Market Revenue (Million), by Country 2024 & 2032
- Figure 20: Middle East Tocopherol Market Volume (K Tons), by Country 2024 & 2032
- Figure 21: Middle East Tocopherol Market Revenue Share (%), by Country 2024 & 2032
- Figure 22: Middle East Tocopherol Market Volume Share (%), by Country 2024 & 2032
- Figure 23: United Arab Emirates Tocopherol Market Revenue (Million), by Country 2024 & 2032
- Figure 24: United Arab Emirates Tocopherol Market Volume (K Tons), by Country 2024 & 2032
- Figure 25: United Arab Emirates Tocopherol Market Revenue Share (%), by Country 2024 & 2032
- Figure 26: United Arab Emirates Tocopherol Market Volume Share (%), by Country 2024 & 2032
- Figure 27: North America Tocopherol Market Revenue (Million), by Source 2024 & 2032
- Figure 28: North America Tocopherol Market Volume (K Tons), by Source 2024 & 2032
- Figure 29: North America Tocopherol Market Revenue Share (%), by Source 2024 & 2032
- Figure 30: North America Tocopherol Market Volume Share (%), by Source 2024 & 2032
- Figure 31: North America Tocopherol Market Revenue (Million), by Application 2024 & 2032
- Figure 32: North America Tocopherol Market Volume (K Tons), by Application 2024 & 2032
- Figure 33: North America Tocopherol Market Revenue Share (%), by Application 2024 & 2032
- Figure 34: North America Tocopherol Market Volume Share (%), by Application 2024 & 2032
- Figure 35: North America Tocopherol Market Revenue (Million), by Country 2024 & 2032
- Figure 36: North America Tocopherol Market Volume (K Tons), by Country 2024 & 2032
- Figure 37: North America Tocopherol Market Revenue Share (%), by Country 2024 & 2032
- Figure 38: North America Tocopherol Market Volume Share (%), by Country 2024 & 2032
- Figure 39: Europe Tocopherol Market Revenue (Million), by Source 2024 & 2032
- Figure 40: Europe Tocopherol Market Volume (K Tons), by Source 2024 & 2032
- Figure 41: Europe Tocopherol Market Revenue Share (%), by Source 2024 & 2032
- Figure 42: Europe Tocopherol Market Volume Share (%), by Source 2024 & 2032
- Figure 43: Europe Tocopherol Market Revenue (Million), by Application 2024 & 2032
- Figure 44: Europe Tocopherol Market Volume (K Tons), by Application 2024 & 2032
- Figure 45: Europe Tocopherol Market Revenue Share (%), by Application 2024 & 2032
- Figure 46: Europe Tocopherol Market Volume Share (%), by Application 2024 & 2032
- Figure 47: Europe Tocopherol Market Revenue (Million), by Country 2024 & 2032
- Figure 48: Europe Tocopherol Market Volume (K Tons), by Country 2024 & 2032
- Figure 49: Europe Tocopherol Market Revenue Share (%), by Country 2024 & 2032
- Figure 50: Europe Tocopherol Market Volume Share (%), by Country 2024 & 2032
- Figure 51: Asia Pacific Tocopherol Market Revenue (Million), by Source 2024 & 2032
- Figure 52: Asia Pacific Tocopherol Market Volume (K Tons), by Source 2024 & 2032
- Figure 53: Asia Pacific Tocopherol Market Revenue Share (%), by Source 2024 & 2032
- Figure 54: Asia Pacific Tocopherol Market Volume Share (%), by Source 2024 & 2032
- Figure 55: Asia Pacific Tocopherol Market Revenue (Million), by Application 2024 & 2032
- Figure 56: Asia Pacific Tocopherol Market Volume (K Tons), by Application 2024 & 2032
- Figure 57: Asia Pacific Tocopherol Market Revenue Share (%), by Application 2024 & 2032
- Figure 58: Asia Pacific Tocopherol Market Volume Share (%), by Application 2024 & 2032
- Figure 59: Asia Pacific Tocopherol Market Revenue (Million), by Country 2024 & 2032
- Figure 60: Asia Pacific Tocopherol Market Volume (K Tons), by Country 2024 & 2032
- Figure 61: Asia Pacific Tocopherol Market Revenue Share (%), by Country 2024 & 2032
- Figure 62: Asia Pacific Tocopherol Market Volume Share (%), by Country 2024 & 2032
- Figure 63: South America Tocopherol Market Revenue (Million), by Source 2024 & 2032
- Figure 64: South America Tocopherol Market Volume (K Tons), by Source 2024 & 2032
- Figure 65: South America Tocopherol Market Revenue Share (%), by Source 2024 & 2032
- Figure 66: South America Tocopherol Market Volume Share (%), by Source 2024 & 2032
- Figure 67: South America Tocopherol Market Revenue (Million), by Application 2024 & 2032
- Figure 68: South America Tocopherol Market Volume (K Tons), by Application 2024 & 2032
- Figure 69: South America Tocopherol Market Revenue Share (%), by Application 2024 & 2032
- Figure 70: South America Tocopherol Market Volume Share (%), by Application 2024 & 2032
- Figure 71: South America Tocopherol Market Revenue (Million), by Country 2024 & 2032
- Figure 72: South America Tocopherol Market Volume (K Tons), by Country 2024 & 2032
- Figure 73: South America Tocopherol Market Revenue Share (%), by Country 2024 & 2032
- Figure 74: South America Tocopherol Market Volume Share (%), by Country 2024 & 2032
- Figure 75: Middle East Tocopherol Market Revenue (Million), by Source 2024 & 2032
- Figure 76: Middle East Tocopherol Market Volume (K Tons), by Source 2024 & 2032
- Figure 77: Middle East Tocopherol Market Revenue Share (%), by Source 2024 & 2032
- Figure 78: Middle East Tocopherol Market Volume Share (%), by Source 2024 & 2032
- Figure 79: Middle East Tocopherol Market Revenue (Million), by Application 2024 & 2032
- Figure 80: Middle East Tocopherol Market Volume (K Tons), by Application 2024 & 2032
- Figure 81: Middle East Tocopherol Market Revenue Share (%), by Application 2024 & 2032
- Figure 82: Middle East Tocopherol Market Volume Share (%), by Application 2024 & 2032
- Figure 83: Middle East Tocopherol Market Revenue (Million), by Country 2024 & 2032
- Figure 84: Middle East Tocopherol Market Volume (K Tons), by Country 2024 & 2032
- Figure 85: Middle East Tocopherol Market Revenue Share (%), by Country 2024 & 2032
- Figure 86: Middle East Tocopherol Market Volume Share (%), by Country 2024 & 2032
- Figure 87: United Arab Emirates Tocopherol Market Revenue (Million), by Source 2024 & 2032
- Figure 88: United Arab Emirates Tocopherol Market Volume (K Tons), by Source 2024 & 2032
- Figure 89: United Arab Emirates Tocopherol Market Revenue Share (%), by Source 2024 & 2032
- Figure 90: United Arab Emirates Tocopherol Market Volume Share (%), by Source 2024 & 2032
- Figure 91: United Arab Emirates Tocopherol Market Revenue (Million), by Application 2024 & 2032
- Figure 92: United Arab Emirates Tocopherol Market Volume (K Tons), by Application 2024 & 2032
- Figure 93: United Arab Emirates Tocopherol Market Revenue Share (%), by Application 2024 & 2032
- Figure 94: United Arab Emirates Tocopherol Market Volume Share (%), by Application 2024 & 2032
- Figure 95: United Arab Emirates Tocopherol Market Revenue (Million), by Country 2024 & 2032
- Figure 96: United Arab Emirates Tocopherol Market Volume (K Tons), by Country 2024 & 2032
- Figure 97: United Arab Emirates Tocopherol Market Revenue Share (%), by Country 2024 & 2032
- Figure 98: United Arab Emirates Tocopherol Market Volume Share (%), by Country 2024 & 2032
List of Tables
- Table 1: Global Tocopherol Market Revenue Million Forecast, by Region 2019 & 2032
- Table 2: Global Tocopherol Market Volume K Tons Forecast, by Region 2019 & 2032
- Table 3: Global Tocopherol Market Revenue Million Forecast, by Source 2019 & 2032
- Table 4: Global Tocopherol Market Volume K Tons Forecast, by Source 2019 & 2032
- Table 5: Global Tocopherol Market Revenue Million Forecast, by Application 2019 & 2032
- Table 6: Global Tocopherol Market Volume K Tons Forecast, by Application 2019 & 2032
- Table 7: Global Tocopherol Market Revenue Million Forecast, by Region 2019 & 2032
- Table 8: Global Tocopherol Market Volume K Tons Forecast, by Region 2019 & 2032
- Table 9: Global Tocopherol Market Revenue Million Forecast, by Country 2019 & 2032
- Table 10: Global Tocopherol Market Volume K Tons Forecast, by Country 2019 & 2032
- Table 11: United States Tocopherol Market Revenue (Million) Forecast, by Application 2019 & 2032
- Table 12: United States Tocopherol Market Volume (K Tons) Forecast, by Application 2019 & 2032
- Table 13: Canada Tocopherol Market Revenue (Million) Forecast, by Application 2019 & 2032
- Table 14: Canada Tocopherol Market Volume (K Tons) Forecast, by Application 2019 & 2032
- Table 15: Mexico Tocopherol Market Revenue (Million) Forecast, by Application 2019 & 2032
- Table 16: Mexico Tocopherol Market Volume (K Tons) Forecast, by Application 2019 & 2032
- Table 17: Rest of North America Tocopherol Market Revenue (Million) Forecast, by Application 2019 & 2032
- Table 18: Rest of North America Tocopherol Market Volume (K Tons) Forecast, by Application 2019 & 2032
- Table 19: Global Tocopherol Market Revenue Million Forecast, by Country 2019 & 2032
- Table 20: Global Tocopherol Market Volume K Tons Forecast, by Country 2019 & 2032
- Table 21: Germany Tocopherol Market Revenue (Million) Forecast, by Application 2019 & 2032
- Table 22: Germany Tocopherol Market Volume (K Tons) Forecast, by Application 2019 & 2032
- Table 23: United Kingdom Tocopherol Market Revenue (Million) Forecast, by Application 2019 & 2032
- Table 24: United Kingdom Tocopherol Market Volume (K Tons) Forecast, by Application 2019 & 2032
- Table 25: France Tocopherol Market Revenue (Million) Forecast, by Application 2019 & 2032
- Table 26: France Tocopherol Market Volume (K Tons) Forecast, by Application 2019 & 2032
- Table 27: Russia Tocopherol Market Revenue (Million) Forecast, by Application 2019 & 2032
- Table 28: Russia Tocopherol Market Volume (K Tons) Forecast, by Application 2019 & 2032
- Table 29: Spain Tocopherol Market Revenue (Million) Forecast, by Application 2019 & 2032
- Table 30: Spain Tocopherol Market Volume (K Tons) Forecast, by Application 2019 & 2032
- Table 31: Rest of Europe Tocopherol Market Revenue (Million) Forecast, by Application 2019 & 2032
- Table 32: Rest of Europe Tocopherol Market Volume (K Tons) Forecast, by Application 2019 & 2032
- Table 33: Global Tocopherol Market Revenue Million Forecast, by Country 2019 & 2032
- Table 34: Global Tocopherol Market Volume K Tons Forecast, by Country 2019 & 2032
- Table 35: India Tocopherol Market Revenue (Million) Forecast, by Application 2019 & 2032
- Table 36: India Tocopherol Market Volume (K Tons) Forecast, by Application 2019 & 2032
- Table 37: Australia Tocopherol Market Revenue (Million) Forecast, by Application 2019 & 2032
- Table 38: Australia Tocopherol Market Volume (K Tons) Forecast, by Application 2019 & 2032
- Table 39: China Tocopherol Market Revenue (Million) Forecast, by Application 2019 & 2032
- Table 40: China Tocopherol Market Volume (K Tons) Forecast, by Application 2019 & 2032
- Table 41: Japan Tocopherol Market Revenue (Million) Forecast, by Application 2019 & 2032
- Table 42: Japan Tocopherol Market Volume (K Tons) Forecast, by Application 2019 & 2032
- Table 43: Rest of Asia Pacific Tocopherol Market Revenue (Million) Forecast, by Application 2019 & 2032
- Table 44: Rest of Asia Pacific Tocopherol Market Volume (K Tons) Forecast, by Application 2019 & 2032
- Table 45: Global Tocopherol Market Revenue Million Forecast, by Country 2019 & 2032
- Table 46: Global Tocopherol Market Volume K Tons Forecast, by Country 2019 & 2032
- Table 47: Brazil Tocopherol Market Revenue (Million) Forecast, by Application 2019 & 2032
- Table 48: Brazil Tocopherol Market Volume (K Tons) Forecast, by Application 2019 & 2032
- Table 49: Argentina Tocopherol Market Revenue (Million) Forecast, by Application 2019 & 2032
- Table 50: Argentina Tocopherol Market Volume (K Tons) Forecast, by Application 2019 & 2032
- Table 51: Rest of South America Tocopherol Market Revenue (Million) Forecast, by Application 2019 & 2032
- Table 52: Rest of South America Tocopherol Market Volume (K Tons) Forecast, by Application 2019 & 2032
- Table 53: Global Tocopherol Market Revenue Million Forecast, by Country 2019 & 2032
- Table 54: Global Tocopherol Market Volume K Tons Forecast, by Country 2019 & 2032
- Table 55: Middle East Tocopherol Market Revenue (Million) Forecast, by Application 2019 & 2032
- Table 56: Middle East Tocopherol Market Volume (K Tons) Forecast, by Application 2019 & 2032
- Table 57: Africa Tocopherol Market Revenue (Million) Forecast, by Application 2019 & 2032
- Table 58: Africa Tocopherol Market Volume (K Tons) Forecast, by Application 2019 & 2032
- Table 59: Global Tocopherol Market Revenue Million Forecast, by Country 2019 & 2032
- Table 60: Global Tocopherol Market Volume K Tons Forecast, by Country 2019 & 2032
- Table 61: Saudi Africa Tocopherol Market Revenue (Million) Forecast, by Application 2019 & 2032
- Table 62: Saudi Africa Tocopherol Market Volume (K Tons) Forecast, by Application 2019 & 2032
- Table 63: Rest of Middle East Tocopherol Market Revenue (Million) Forecast, by Application 2019 & 2032
- Table 64: Rest of Middle East Tocopherol Market Volume (K Tons) Forecast, by Application 2019 & 2032
- Table 65: Global Tocopherol Market Revenue Million Forecast, by Source 2019 & 2032
- Table 66: Global Tocopherol Market Volume K Tons Forecast, by Source 2019 & 2032
- Table 67: Global Tocopherol Market Revenue Million Forecast, by Application 2019 & 2032
- Table 68: Global Tocopherol Market Volume K Tons Forecast, by Application 2019 & 2032
- Table 69: Global Tocopherol Market Revenue Million Forecast, by Country 2019 & 2032
- Table 70: Global Tocopherol Market Volume K Tons Forecast, by Country 2019 & 2032
- Table 71: United States Tocopherol Market Revenue (Million) Forecast, by Application 2019 & 2032
- Table 72: United States Tocopherol Market Volume (K Tons) Forecast, by Application 2019 & 2032
- Table 73: Canada Tocopherol Market Revenue (Million) Forecast, by Application 2019 & 2032
- Table 74: Canada Tocopherol Market Volume (K Tons) Forecast, by Application 2019 & 2032
- Table 75: Mexico Tocopherol Market Revenue (Million) Forecast, by Application 2019 & 2032
- Table 76: Mexico Tocopherol Market Volume (K Tons) Forecast, by Application 2019 & 2032
- Table 77: Rest of North America Tocopherol Market Revenue (Million) Forecast, by Application 2019 & 2032
- Table 78: Rest of North America Tocopherol Market Volume (K Tons) Forecast, by Application 2019 & 2032
- Table 79: Global Tocopherol Market Revenue Million Forecast, by Source 2019 & 2032
- Table 80: Global Tocopherol Market Volume K Tons Forecast, by Source 2019 & 2032
- Table 81: Global Tocopherol Market Revenue Million Forecast, by Application 2019 & 2032
- Table 82: Global Tocopherol Market Volume K Tons Forecast, by Application 2019 & 2032
- Table 83: Global Tocopherol Market Revenue Million Forecast, by Country 2019 & 2032
- Table 84: Global Tocopherol Market Volume K Tons Forecast, by Country 2019 & 2032
- Table 85: Germany Tocopherol Market Revenue (Million) Forecast, by Application 2019 & 2032
- Table 86: Germany Tocopherol Market Volume (K Tons) Forecast, by Application 2019 & 2032
- Table 87: United Kingdom Tocopherol Market Revenue (Million) Forecast, by Application 2019 & 2032
- Table 88: United Kingdom Tocopherol Market Volume (K Tons) Forecast, by Application 2019 & 2032
- Table 89: France Tocopherol Market Revenue (Million) Forecast, by Application 2019 & 2032
- Table 90: France Tocopherol Market Volume (K Tons) Forecast, by Application 2019 & 2032
- Table 91: Russia Tocopherol Market Revenue (Million) Forecast, by Application 2019 & 2032
- Table 92: Russia Tocopherol Market Volume (K Tons) Forecast, by Application 2019 & 2032
- Table 93: Spain Tocopherol Market Revenue (Million) Forecast, by Application 2019 & 2032
- Table 94: Spain Tocopherol Market Volume (K Tons) Forecast, by Application 2019 & 2032
- Table 95: Rest of Europe Tocopherol Market Revenue (Million) Forecast, by Application 2019 & 2032
- Table 96: Rest of Europe Tocopherol Market Volume (K Tons) Forecast, by Application 2019 & 2032
- Table 97: Global Tocopherol Market Revenue Million Forecast, by Source 2019 & 2032
- Table 98: Global Tocopherol Market Volume K Tons Forecast, by Source 2019 & 2032
- Table 99: Global Tocopherol Market Revenue Million Forecast, by Application 2019 & 2032
- Table 100: Global Tocopherol Market Volume K Tons Forecast, by Application 2019 & 2032
- Table 101: Global Tocopherol Market Revenue Million Forecast, by Country 2019 & 2032
- Table 102: Global Tocopherol Market Volume K Tons Forecast, by Country 2019 & 2032
- Table 103: India Tocopherol Market Revenue (Million) Forecast, by Application 2019 & 2032
- Table 104: India Tocopherol Market Volume (K Tons) Forecast, by Application 2019 & 2032
- Table 105: Australia Tocopherol Market Revenue (Million) Forecast, by Application 2019 & 2032
- Table 106: Australia Tocopherol Market Volume (K Tons) Forecast, by Application 2019 & 2032
- Table 107: China Tocopherol Market Revenue (Million) Forecast, by Application 2019 & 2032
- Table 108: China Tocopherol Market Volume (K Tons) Forecast, by Application 2019 & 2032
- Table 109: Japan Tocopherol Market Revenue (Million) Forecast, by Application 2019 & 2032
- Table 110: Japan Tocopherol Market Volume (K Tons) Forecast, by Application 2019 & 2032
- Table 111: Rest of Asia Pacific Tocopherol Market Revenue (Million) Forecast, by Application 2019 & 2032
- Table 112: Rest of Asia Pacific Tocopherol Market Volume (K Tons) Forecast, by Application 2019 & 2032
- Table 113: Global Tocopherol Market Revenue Million Forecast, by Source 2019 & 2032
- Table 114: Global Tocopherol Market Volume K Tons Forecast, by Source 2019 & 2032
- Table 115: Global Tocopherol Market Revenue Million Forecast, by Application 2019 & 2032
- Table 116: Global Tocopherol Market Volume K Tons Forecast, by Application 2019 & 2032
- Table 117: Global Tocopherol Market Revenue Million Forecast, by Country 2019 & 2032
- Table 118: Global Tocopherol Market Volume K Tons Forecast, by Country 2019 & 2032
- Table 119: Brazil Tocopherol Market Revenue (Million) Forecast, by Application 2019 & 2032
- Table 120: Brazil Tocopherol Market Volume (K Tons) Forecast, by Application 2019 & 2032
- Table 121: Argentina Tocopherol Market Revenue (Million) Forecast, by Application 2019 & 2032
- Table 122: Argentina Tocopherol Market Volume (K Tons) Forecast, by Application 2019 & 2032
- Table 123: Rest of South America Tocopherol Market Revenue (Million) Forecast, by Application 2019 & 2032
- Table 124: Rest of South America Tocopherol Market Volume (K Tons) Forecast, by Application 2019 & 2032
- Table 125: Global Tocopherol Market Revenue Million Forecast, by Source 2019 & 2032
- Table 126: Global Tocopherol Market Volume K Tons Forecast, by Source 2019 & 2032
- Table 127: Global Tocopherol Market Revenue Million Forecast, by Application 2019 & 2032
- Table 128: Global Tocopherol Market Volume K Tons Forecast, by Application 2019 & 2032
- Table 129: Global Tocopherol Market Revenue Million Forecast, by Country 2019 & 2032
- Table 130: Global Tocopherol Market Volume K Tons Forecast, by Country 2019 & 2032
- Table 131: Global Tocopherol Market Revenue Million Forecast, by Source 2019 & 2032
- Table 132: Global Tocopherol Market Volume K Tons Forecast, by Source 2019 & 2032
- Table 133: Global Tocopherol Market Revenue Million Forecast, by Application 2019 & 2032
- Table 134: Global Tocopherol Market Volume K Tons Forecast, by Application 2019 & 2032
- Table 135: Global Tocopherol Market Revenue Million Forecast, by Country 2019 & 2032
- Table 136: Global Tocopherol Market Volume K Tons Forecast, by Country 2019 & 2032
- Table 137: Saudi Africa Tocopherol Market Revenue (Million) Forecast, by Application 2019 & 2032
- Table 138: Saudi Africa Tocopherol Market Volume (K Tons) Forecast, by Application 2019 & 2032
- Table 139: Rest of Middle East Tocopherol Market Revenue (Million) Forecast, by Application 2019 & 2032
- Table 140: Rest of Middle East Tocopherol Market Volume (K Tons) Forecast, by Application 2019 & 2032
Frequently Asked Questions
1. What is the projected Compound Annual Growth Rate (CAGR) of the Tocopherol Market?
The projected CAGR is approximately 9.40%.
2. Which companies are prominent players in the Tocopherol Market?
Key companies in the market include Advanced Organic Materials SA, BTSA*List Not Exhaustive, Merck KGaA, DuPont Danisco, BASF SE, Archer Daniels Midland, Cargill Inc, Royal DSM, Kerry Group , Evonik Industries, Nippon Oil & Fat.
3. What are the main segments of the Tocopherol Market?
The market segments include Source, Application.
4. Can you provide details about the market size?
The market size is estimated to be USD 1720 Million as of 2022.
5. What are some drivers contributing to market growth?
Increasing Demand for Organic Plant Proteins; Increasing Application of Pea Protein in Food and Beverages.
6. What are the notable trends driving market growth?
Strong Demand from Feed Industry.
7. Are there any restraints impacting market growth?
Presence of Alternative protein sources.
8. Can you provide examples of recent developments in the market?
N/A
9. What pricing options are available for accessing the report?
Pricing options include single-user, multi-user, and enterprise licenses priced at USD 4750, USD 5250, and USD 8750 respectively.
10. Is the market size provided in terms of value or volume?
The market size is provided in terms of value, measured in Million and volume, measured in K Tons.
11. Are there any specific market keywords associated with the report?
Yes, the market keyword associated with the report is "Tocopherol Market," which aids in identifying and referencing the specific market segment covered.
12. How do I determine which pricing option suits my needs best?
The pricing options vary based on user requirements and access needs. Individual users may opt for single-user licenses, while businesses requiring broader access may choose multi-user or enterprise licenses for cost-effective access to the report.
13. Are there any additional resources or data provided in the Tocopherol Market report?
While the report offers comprehensive insights, it's advisable to review the specific contents or supplementary materials provided to ascertain if additional resources or data are available.
14. How can I stay updated on further developments or reports in the Tocopherol Market?
To stay informed about further developments, trends, and reports in the Tocopherol Market, consider subscribing to industry newsletters, following relevant companies and organizations, or regularly checking reputable industry news sources and publications.
Methodology
Step 1 - Identification of Relevant Samples Size from Population Database


Step 2 - Approaches for Defining Global Market Size (Value, Volume* & Price*)

Note*: In applicable scenarios
Step 3 - Data Sources
Primary Research
- Web Analytics
- Survey Reports
- Research Institute
- Latest Research Reports
- Opinion Leaders
Secondary Research
- Annual Reports
- White Paper
- Latest Press Release
- Industry Association
- Paid Database
- Investor Presentations

Step 4 - Data Triangulation
Involves using different sources of information in order to increase the validity of a study
These sources are likely to be stakeholders in a program - participants, other researchers, program staff, other community members, and so on.
Then we put all data in single framework & apply various statistical tools to find out the dynamic on the market.
During the analysis stage, feedback from the stakeholder groups would be compared to determine areas of agreement as well as areas of divergence


