
Key Insights
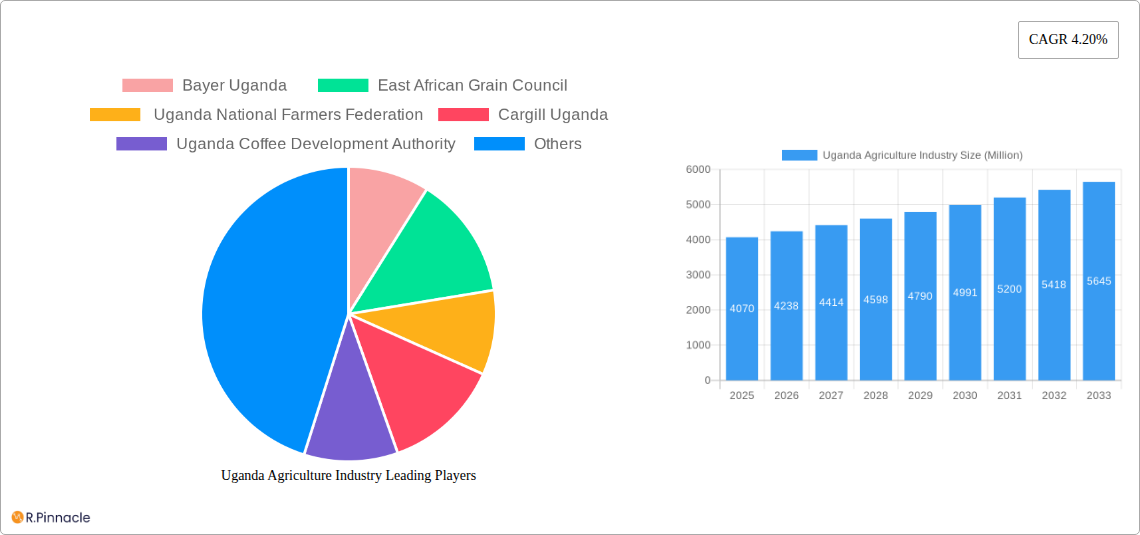
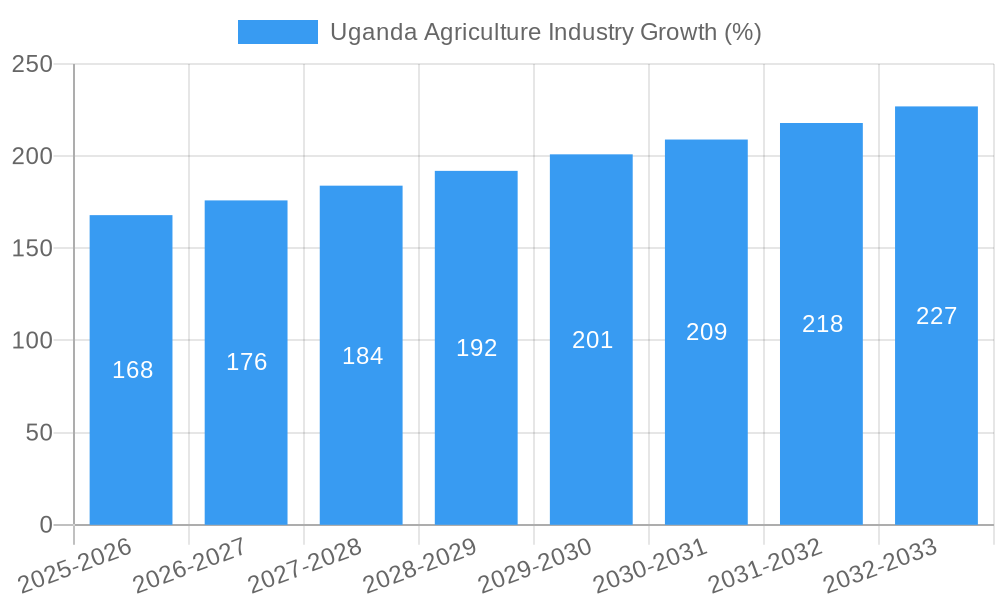
The Ugandan agricultural industry, valued at $4.07 billion in 2025, is projected to experience robust growth, with a Compound Annual Growth Rate (CAGR) of 4.20% from 2025 to 2033. This growth is driven by several factors. Increased demand for food products due to population growth and rising incomes fuels market expansion. Government initiatives promoting agricultural modernization, including investments in irrigation infrastructure and improved farming techniques, significantly contribute to higher yields and efficiency. Furthermore, a growing emphasis on value addition and export diversification, leveraging Uganda's favorable climate for diverse crops, contributes to the sector's expanding value chain. Key segments within the industry, including cereals and grains, oilseeds and pulses, and fruits and vegetables, exhibit diverse growth trajectories, influenced by specific factors impacting each sector (e.g., fluctuating global commodity prices, evolving consumer preferences, and the prevalence of specific pests or diseases). Leading players like Bayer Uganda, Cargill Uganda, and the Uganda National Farmers Federation play a crucial role in shaping market dynamics through their activities in production, processing, distribution, and export.
However, the industry faces challenges that could impact its trajectory. Limited access to credit and financing for smallholder farmers remains a significant constraint, hindering expansion and technological adoption. Climate change, manifested in unpredictable rainfall patterns and increased frequency of extreme weather events, poses a significant risk to crop yields and overall productivity. Infrastructure limitations, such as inadequate storage facilities and transportation networks, impede efficient market access and contribute to post-harvest losses. Addressing these challenges through targeted policy interventions, investments in rural infrastructure, and promotion of climate-smart agriculture practices will be crucial to ensuring the sustained growth and resilience of the Ugandan agricultural sector.
Uganda Agriculture Industry Report: 2019-2033
This comprehensive report provides an in-depth analysis of the Uganda agriculture industry, offering invaluable insights for industry professionals, investors, and policymakers. Covering the period from 2019 to 2033, with a base year of 2025, this report meticulously examines market dynamics, growth drivers, challenges, and future opportunities within this vital sector. The study utilizes data from the historical period (2019-2024) and forecasts market trends until 2033.
Uganda Agriculture Industry Market Structure & Innovation Trends
This section analyzes the competitive landscape of Uganda's agriculture industry, including market concentration, innovation drivers, regulatory frameworks, and M&A activities. We delve into the market share held by key players like Bayer Uganda, Cargill Uganda, and the Uganda Coffee Development Authority, examining their strategies and influence on the market. The report also explores the impact of regulatory frameworks on innovation and competition, evaluating the role of organizations such as the East African Grain Council and the Uganda National Farmers Federation. We analyze the volume and value of M&A deals within the sector during the study period, estimating a total M&A deal value of approximately $xx Million.
- Market Concentration: Analysis of market share among leading players (e.g., Bayer Uganda, Cargill Uganda).
- Innovation Drivers: Examination of technological advancements, government policies, and consumer demand driving innovation.
- Regulatory Frameworks: Assessment of the impact of regulations on market participants and investment.
- Product Substitutes: Identification of alternative products and their influence on market dynamics.
- End-User Demographics: Characterization of the target consumers and their purchasing behaviors.
- M&A Activities: Overview of merger and acquisition activity, including deal values and strategic implications.
Uganda Agriculture Industry Market Dynamics & Trends
This section examines the market growth drivers and challenges faced by the Uganda agriculture industry, offering detailed insight into market size, value and volume. We estimate the market value to be around $xx Million. The report analyzes the CAGR (Compound Annual Growth Rate) for key segments (Cereals and Grains, Oilseeds and Pulses, Fruits and Vegetables) and discusses the factors influencing market penetration. Technological disruptions, evolving consumer preferences, and competitive dynamics are comprehensively evaluated. The impact of factors like climate change, population growth, and urbanization on the industry are also explored.
Dominant Regions & Segments in Uganda Agriculture Industry
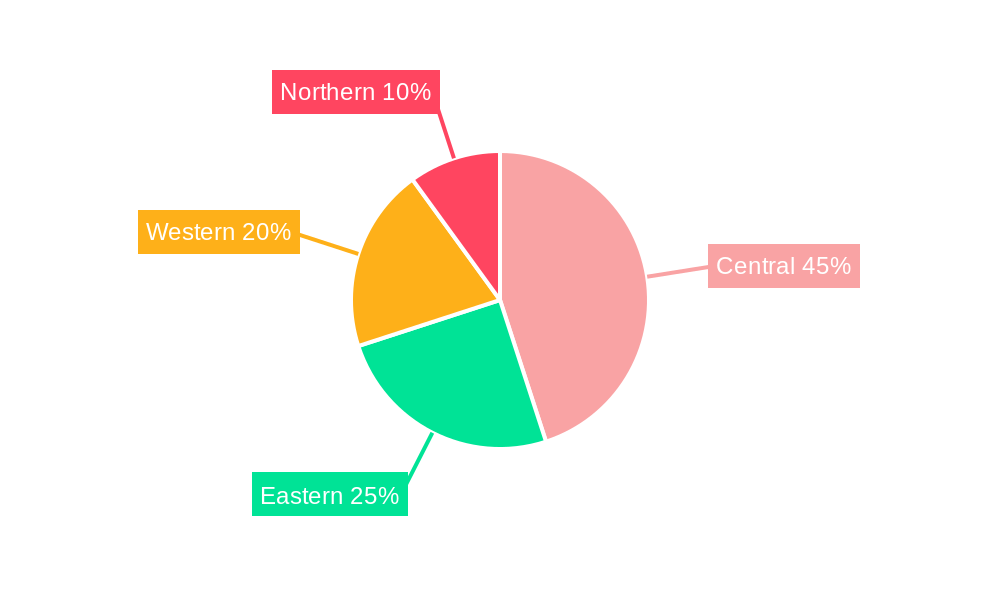
This section identifies the leading regions and segments within the Ugandan agricultural landscape, offering a granular view of production, consumption, import, export, and price trends for Cereals and Grains, Oilseeds and Pulses, and Fruits and Vegetables. The analysis considers factors like infrastructure, economic policies and agricultural practices in determining regional and segmental dominance. The report highlights the regions with the highest production and consumption values and explores factors driving their success.
- Cereals and Grains: Analysis of production, consumption, import, export, and price trends. Key drivers will be detailed using bullet points.
- Oilseeds and Pulses: Similar analysis as above.
- Fruits and Vegetables: Similar analysis as above.
- Key Drivers:
- Government support programs
- Infrastructure development (irrigation, transportation)
- Favorable climatic conditions
- Export market opportunities
- Key Drivers:
Uganda Agriculture Industry Product Innovations
This section provides a concise overview of recent product innovations in the Ugandan agriculture sector, highlighting new technologies, applications, and the competitive advantages they offer. We focus on the adoption of improved seeds, precision farming techniques, and other technological advancements that are shaping the industry's future.
Report Scope & Segmentation Analysis
This report segments the Uganda agriculture industry by product type: Cereals and Grains, Oilseeds and Pulses, and Fruits and Vegetables. Each segment is analyzed in terms of production, consumption, import, export, and price trends. The report provides growth projections, market size estimations (value and volume) for each segment during the forecast period (2025-2033), and identifies key competitive dynamics within each market segment.
- Cereals and Grains: Detailed analysis including growth projections and market size in Millions.
- Oilseeds and Pulses: Detailed analysis including growth projections and market size in Millions.
- Fruits and Vegetables: Detailed analysis including growth projections and market size in Millions.
Key Drivers of Uganda Agriculture Industry Growth
Several factors contribute to the growth of Uganda's agriculture industry. These include government initiatives promoting agricultural development, increased investment in agricultural technologies, growing domestic demand, and favorable climatic conditions in certain regions. The expansion of export markets and improved infrastructure are also contributing significantly.
Challenges in the Uganda Agriculture Industry Sector
Despite its potential, the Uganda agriculture industry faces significant challenges. These include limited access to credit and finance for farmers, inadequate infrastructure (storage, transportation), climate change impacts (droughts, floods), and price volatility in global markets. These factors lead to lower yields, post-harvest losses, and reduced farmer income. The total estimated impact of these challenges is approximately $xx Million in annual losses.
Emerging Opportunities in Uganda Agriculture Industry
Several opportunities exist for growth within the Ugandan agriculture sector. These include the adoption of climate-smart agriculture practices, the development of value-added agricultural products, the expansion of export markets, and the investment in agricultural technology and infrastructure. The burgeoning demand for organic and sustainably produced food presents another significant opportunity.
Leading Players in the Uganda Agriculture Industry Market
- Bayer Uganda
- East African Grain Council
- Uganda National Farmers Federation
- Cargill Uganda
- Uganda Coffee Development Authority
Key Developments in Uganda Agriculture Industry
- November 2022: Launch of biological control agents for the Mango mealybug. This initiative aims to mitigate pest infestations and improve mango production.
- August 2022: Government plan to increase coffee production from 402,000 tons to 1.2 Million tons annually by 2025. This ambitious plan aims to boost the coffee sector's contribution to the national economy.
- November 2021: Formation of Hortifresh, a farmers' cooperative focused on enhancing the cultivation of fruits and vegetables. This development aims to improve the competitiveness of Uganda’s horticulture sector.
Future Outlook for Uganda Agriculture Industry Market
The future of Uganda's agriculture industry appears promising, driven by sustained government investment in infrastructure and technology, growing domestic and export demand, and the adoption of climate-smart agricultural practices. Strategic opportunities lie in value chain development, improved market access, and leveraging technology to boost efficiency and productivity. The projected market value by 2033 is expected to reach $xx Million.
Uganda Agriculture Industry Segmentation
-
1. Type (Pr
- 1.1. Cereals and Grains
- 1.2. Oilseeds and Pulses
- 1.3. Fruits and Vegetables
-
2. Type (Pr
- 2.1. Cereals and Grains
- 2.2. Oilseeds and Pulses
- 2.3. Fruits and Vegetables
Uganda Agriculture Industry Segmentation By Geography
- 1. Uganda
Uganda Agriculture Industry REPORT HIGHLIGHTS
| Aspects | Details |
|---|---|
| Study Period | 2019-2033 |
| Base Year | 2024 |
| Estimated Year | 2025 |
| Forecast Period | 2025-2033 |
| Historical Period | 2019-2024 |
| Growth Rate | CAGR of 4.20% from 2019-2033 |
| Segmentation |
|
Table of Contents
- 1. Introduction
- 1.1. Research Scope
- 1.2. Market Segmentation
- 1.3. Research Methodology
- 1.4. Definitions and Assumptions
- 2. Executive Summary
- 2.1. Introduction
- 3. Market Dynamics
- 3.1. Introduction
- 3.2. Market Drivers
- 3.2.1. Rising Consumption of Cashew Nuts in the Country; Favorable Government Initiatives
- 3.3. Market Restrains
- 3.3.1. Hazardous Climatic Condition Hinders Cashew Production; Stringent Regulations Related to Food Quality Standards
- 3.4. Market Trends
- 3.4.1. Agriculture Contributes Highly to Uganda’s GDP
- 4. Market Factor Analysis
- 4.1. Porters Five Forces
- 4.2. Supply/Value Chain
- 4.3. PESTEL analysis
- 4.4. Market Entropy
- 4.5. Patent/Trademark Analysis
- 5. Uganda Agriculture Industry Analysis, Insights and Forecast, 2019-2031
- 5.1. Market Analysis, Insights and Forecast - by Type (Pr
- 5.1.1. Cereals and Grains
- 5.1.2. Oilseeds and Pulses
- 5.1.3. Fruits and Vegetables
- 5.2. Market Analysis, Insights and Forecast - by Type (Pr
- 5.2.1. Cereals and Grains
- 5.2.2. Oilseeds and Pulses
- 5.2.3. Fruits and Vegetables
- 5.3. Market Analysis, Insights and Forecast - by Region
- 5.3.1. Uganda
- 5.1. Market Analysis, Insights and Forecast - by Type (Pr
- 6. Competitive Analysis
- 6.1. Market Share Analysis 2024
- 6.2. Company Profiles
- 6.2.1 Bayer Uganda
- 6.2.1.1. Overview
- 6.2.1.2. Products
- 6.2.1.3. SWOT Analysis
- 6.2.1.4. Recent Developments
- 6.2.1.5. Financials (Based on Availability)
- 6.2.2 East African Grain Council
- 6.2.2.1. Overview
- 6.2.2.2. Products
- 6.2.2.3. SWOT Analysis
- 6.2.2.4. Recent Developments
- 6.2.2.5. Financials (Based on Availability)
- 6.2.3 Uganda National Farmers Federation
- 6.2.3.1. Overview
- 6.2.3.2. Products
- 6.2.3.3. SWOT Analysis
- 6.2.3.4. Recent Developments
- 6.2.3.5. Financials (Based on Availability)
- 6.2.4 Cargill Uganda
- 6.2.4.1. Overview
- 6.2.4.2. Products
- 6.2.4.3. SWOT Analysis
- 6.2.4.4. Recent Developments
- 6.2.4.5. Financials (Based on Availability)
- 6.2.5 Uganda Coffee Development Authority
- 6.2.5.1. Overview
- 6.2.5.2. Products
- 6.2.5.3. SWOT Analysis
- 6.2.5.4. Recent Developments
- 6.2.5.5. Financials (Based on Availability)
- 6.2.1 Bayer Uganda
List of Figures
- Figure 1: Uganda Agriculture Industry Revenue Breakdown (Million, %) by Product 2024 & 2032
- Figure 2: Uganda Agriculture Industry Share (%) by Company 2024
List of Tables
- Table 1: Uganda Agriculture Industry Revenue Million Forecast, by Region 2019 & 2032
- Table 2: Uganda Agriculture Industry Revenue Million Forecast, by Type (Pr 2019 & 2032
- Table 3: Uganda Agriculture Industry Revenue Million Forecast, by Type (Pr 2019 & 2032
- Table 4: Uganda Agriculture Industry Revenue Million Forecast, by Region 2019 & 2032
- Table 5: Uganda Agriculture Industry Revenue Million Forecast, by Country 2019 & 2032
- Table 6: Uganda Agriculture Industry Revenue Million Forecast, by Type (Pr 2019 & 2032
- Table 7: Uganda Agriculture Industry Revenue Million Forecast, by Type (Pr 2019 & 2032
- Table 8: Uganda Agriculture Industry Revenue Million Forecast, by Country 2019 & 2032
Frequently Asked Questions
1. What is the projected Compound Annual Growth Rate (CAGR) of the Uganda Agriculture Industry?
The projected CAGR is approximately 4.20%.
2. Which companies are prominent players in the Uganda Agriculture Industry?
Key companies in the market include Bayer Uganda , East African Grain Council , Uganda National Farmers Federation, Cargill Uganda, Uganda Coffee Development Authority .
3. What are the main segments of the Uganda Agriculture Industry?
The market segments include Type (Pr, Type (Pr.
4. Can you provide details about the market size?
The market size is estimated to be USD 4.07 Million as of 2022.
5. What are some drivers contributing to market growth?
Rising Consumption of Cashew Nuts in the Country; Favorable Government Initiatives.
6. What are the notable trends driving market growth?
Agriculture Contributes Highly to Uganda’s GDP.
7. Are there any restraints impacting market growth?
Hazardous Climatic Condition Hinders Cashew Production; Stringent Regulations Related to Food Quality Standards.
8. Can you provide examples of recent developments in the market?
November 2022: The Government of Uganda, through the Ministry of Agriculture, Animal Industries, and Fisheries (MAAIF), together with development partners, launched and released biological control agents for the Mango mealybug (Rastococcus invaders).
9. What pricing options are available for accessing the report?
Pricing options include single-user, multi-user, and enterprise licenses priced at USD 3800, USD 4500, and USD 5800 respectively.
10. Is the market size provided in terms of value or volume?
The market size is provided in terms of value, measured in Million.
11. Are there any specific market keywords associated with the report?
Yes, the market keyword associated with the report is "Uganda Agriculture Industry," which aids in identifying and referencing the specific market segment covered.
12. How do I determine which pricing option suits my needs best?
The pricing options vary based on user requirements and access needs. Individual users may opt for single-user licenses, while businesses requiring broader access may choose multi-user or enterprise licenses for cost-effective access to the report.
13. Are there any additional resources or data provided in the Uganda Agriculture Industry report?
While the report offers comprehensive insights, it's advisable to review the specific contents or supplementary materials provided to ascertain if additional resources or data are available.
14. How can I stay updated on further developments or reports in the Uganda Agriculture Industry?
To stay informed about further developments, trends, and reports in the Uganda Agriculture Industry, consider subscribing to industry newsletters, following relevant companies and organizations, or regularly checking reputable industry news sources and publications.
Methodology
Step 1 - Identification of Relevant Samples Size from Population Database


Step 2 - Approaches for Defining Global Market Size (Value, Volume* & Price*)

Note*: In applicable scenarios
Step 3 - Data Sources
Primary Research
- Web Analytics
- Survey Reports
- Research Institute
- Latest Research Reports
- Opinion Leaders
Secondary Research
- Annual Reports
- White Paper
- Latest Press Release
- Industry Association
- Paid Database
- Investor Presentations

Step 4 - Data Triangulation
Involves using different sources of information in order to increase the validity of a study
These sources are likely to be stakeholders in a program - participants, other researchers, program staff, other community members, and so on.
Then we put all data in single framework & apply various statistical tools to find out the dynamic on the market.
During the analysis stage, feedback from the stakeholder groups would be compared to determine areas of agreement as well as areas of divergence


