

Key Insights
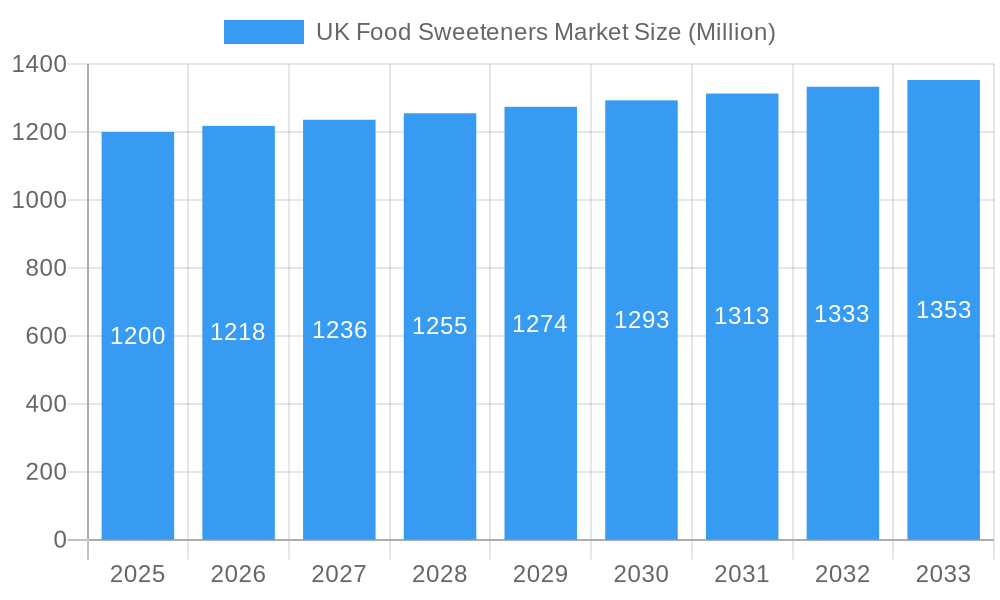
The UK food sweeteners market, projected at £1.69 billion in 2025, is poised for robust expansion with a Compound Annual Growth Rate (CAGR) of 5.61% through 2033. This growth is propelled by escalating consumer preference for reduced-calorie and healthier food and beverage choices. Key market drivers include rising health consciousness, increased awareness of sugar's adverse effects, and the growing prevalence of lifestyle diseases like diabetes and obesity, which are encouraging the adoption of sugar alternatives. The expanding food and beverage industry, particularly in confectionery and beverage segments, further fuels demand. Market segmentation includes product types such as sucrose, starch sweeteners, sugar alcohols, and high-intensity sweeteners, serving applications in dairy, bakery, soups, sauces, dressings, confectionery, and beverages. Major industry participants like Cargill, Tate & Lyle, and Ingredion are actively engaged in innovation and strategic collaborations to enhance market standing. Regional consumption patterns across England, Wales, Scotland, and Northern Ireland are influenced by local dietary habits and economic conditions.
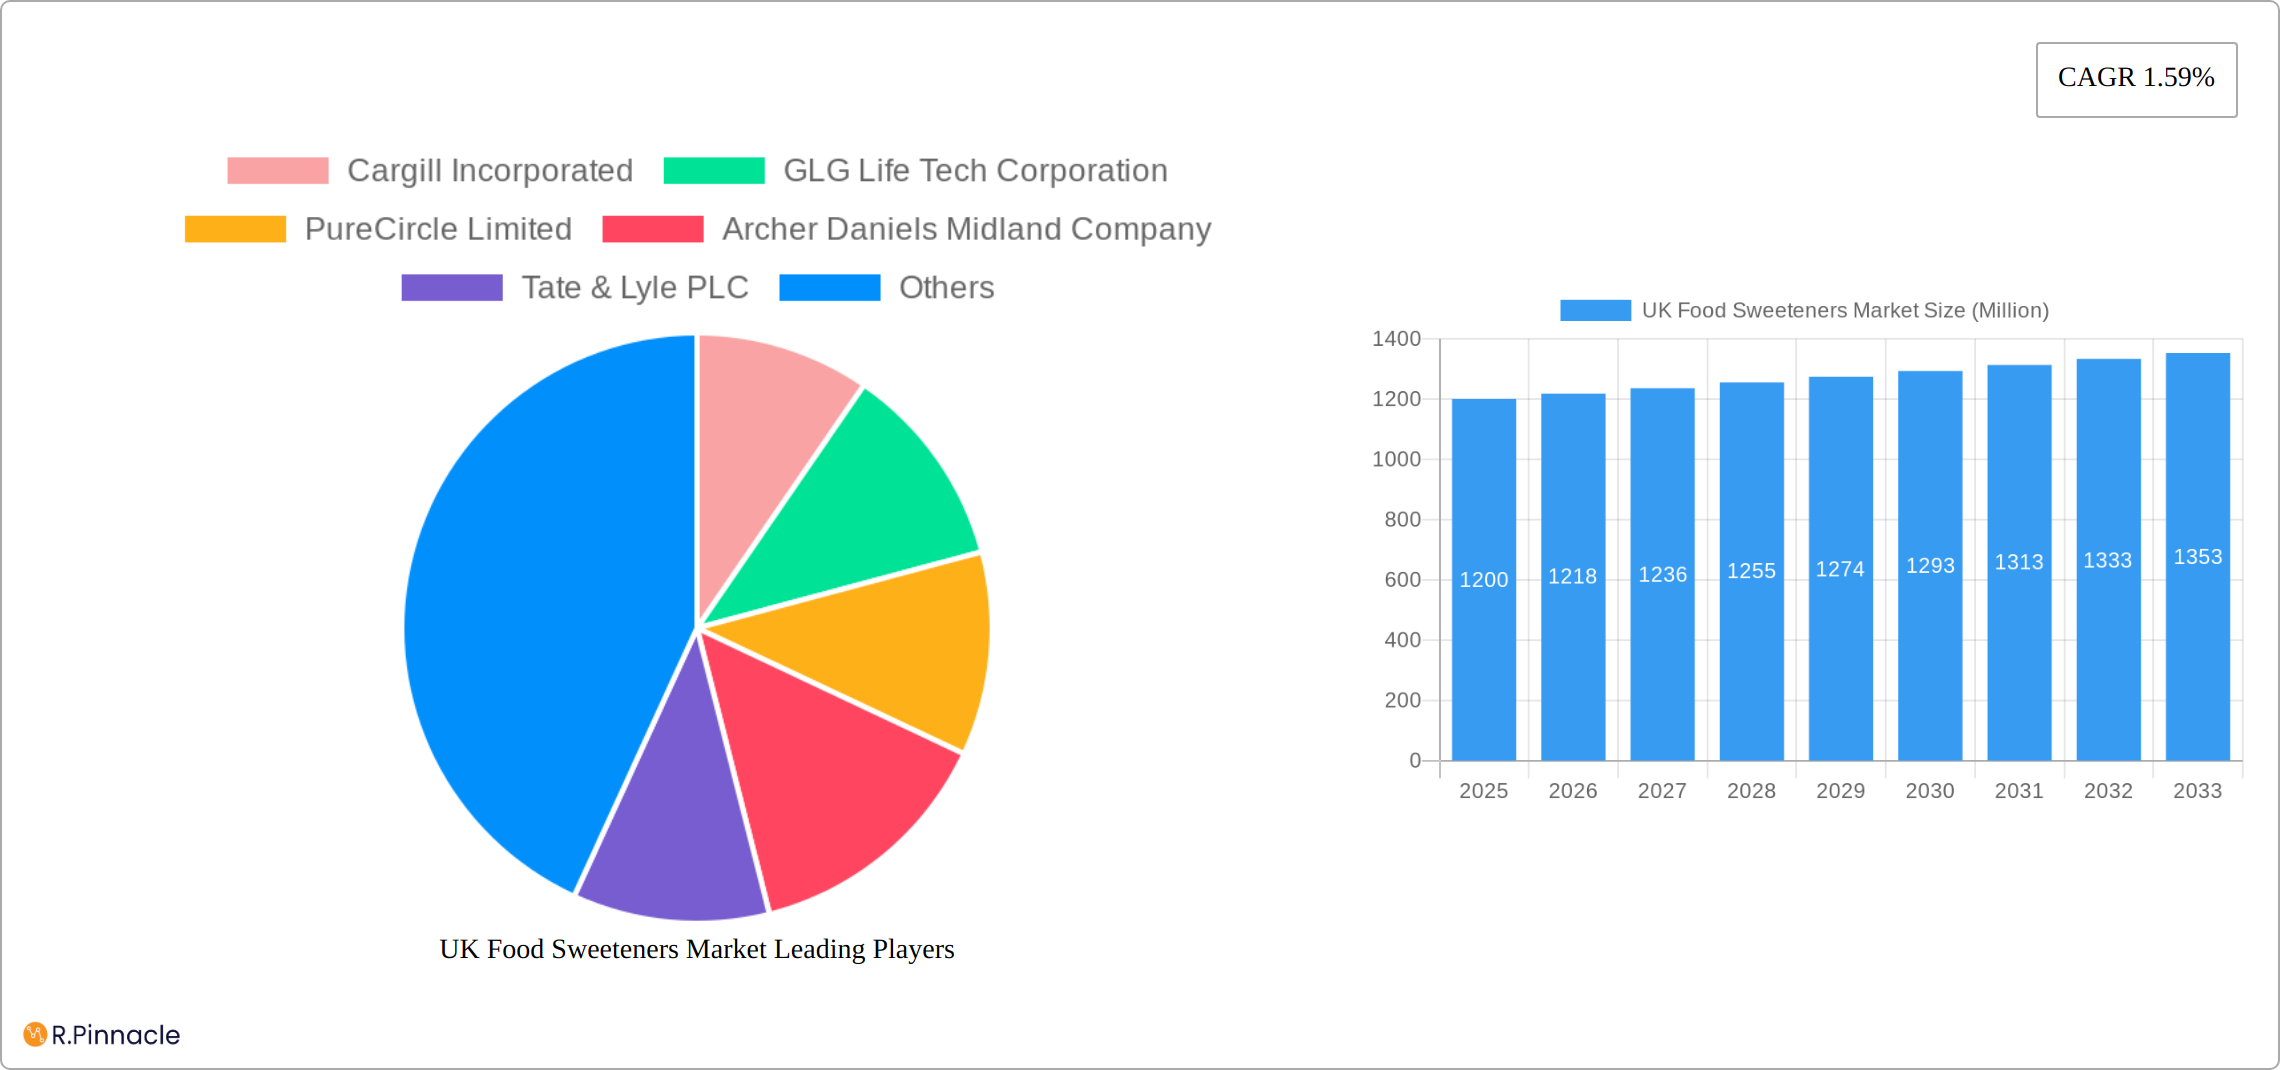
UK Food Sweeteners Market Market Size (In Billion)
The forecast period (2025-2033) indicates sustained market growth, emphasizing innovation in natural and healthier sweetener technologies. The competitive landscape remains dynamic, with leading players investing in research and development to introduce novel products with improved taste profiles and fewer side effects. This focus on consumer well-being and the persistent demand for sugar-reduced products underpin a positive market outlook.
UK Food Sweeteners Market Company Market Share
This comprehensive analysis offers critical insights into the UK food sweeteners market for industry stakeholders and investors. The report examines the market from 2019 to 2033, with detailed projections for 2025 and the subsequent forecast period. Key companies analyzed include Cargill Incorporated, GLG Life Tech Corporation, PureCircle Limited, Archer Daniels Midland Company, Tate & Lyle PLC, DuPont, Ingredion Incorporated, and Tereos S.A.
UK Food Sweeteners Market Structure & Innovation Trends
This section analyzes the competitive landscape, innovation drivers, and regulatory environment of the UK food sweeteners market. The market is moderately concentrated, with several major players holding significant market share. However, the presence of smaller, specialized firms fosters innovation. The report quantifies market concentration using metrics like the Herfindahl-Hirschman Index (HHI) (xx) and assesses the market share of key players (e.g., Cargill holds approximately xx% market share in 2025).
- Market Concentration: xx
- Innovation Drivers: Growing demand for healthier alternatives, stringent regulations on sugar content, and advancements in sweetener technology.
- Regulatory Frameworks: EU food regulations and UK-specific labeling requirements significantly impact market dynamics.
- Product Substitutes: The market faces competition from natural sweeteners and emerging sugar substitutes, influencing consumer choices and pricing strategies.
- End-User Demographics: The report analyzes consumer preferences across age groups, dietary habits, and health concerns.
- M&A Activities: The report details significant mergers and acquisitions (M&A) in the UK food sweeteners market over the historical period (2019-2024), highlighting deal values (e.g., a total of £xx Million in M&A activity).
UK Food Sweeteners Market Dynamics & Trends
The UK food sweeteners market is experiencing dynamic growth, driven by several factors. Consumer demand for healthier food options and reduced sugar intake is a key driver, fueling the popularity of high-intensity sweeteners (HIS) and sugar alcohols. Technological advancements enable the development of novel sweeteners with improved functionality and taste profiles. The rising prevalence of obesity and related health issues further underscores the demand for healthier alternatives. This has led to a Compound Annual Growth Rate (CAGR) of xx% during the historical period and a projected CAGR of xx% during the forecast period. Market penetration for HIS is estimated at xx% in 2025. Competitive dynamics are intense, with companies focusing on product differentiation, innovation, and strategic partnerships to maintain market share.
Dominant Regions & Segments in UK Food Sweeteners Market
The UK food sweeteners market exhibits diverse consumption patterns and preferences across its regions. While precise regional market share data is currently unavailable, a detailed analysis reveals key factors driving substantial growth within specific segments. This dynamic market is shaped by evolving consumer preferences, health consciousness, and innovative product development.
By Product Type:
- Sucrose: Remains the dominant sweetener, benefiting from established consumer familiarity and widespread use across numerous food and beverage applications. Its versatility and cost-effectiveness contribute to its continued market leadership.
- Starch Sweeteners: This segment demonstrates consistent growth, driven by its cost-effectiveness and functional properties making it a popular choice for various food manufacturing processes.
- Sugar Alcohols: Increasingly popular due to their perceived health benefits and reduced caloric content compared to traditional sugars. This segment benefits from the growing health-conscious consumer base.
- High-Intensity Sweeteners (HIS): Experience robust growth, fueled by the rising demand for low-calorie and sugar-reduced options. Ongoing innovations are enhancing their taste profiles and expanding their applications.
By Application:
- Beverages: This remains the largest application segment, with sweeteners playing a crucial role in the formulation of soft drinks, juices, and other popular beverages.
- Confectionery: A significant segment where sweeteners are essential for achieving the desired sweetness and texture in a wide range of confectionery products.
- Dairy: Steady growth is observed in this segment, driven by the incorporation of sweeteners into yogurts, ice creams, and other dairy-based products.
- Bakery: A substantial segment that relies on sweeteners for achieving the desired sweetness and texture in bread, cakes, pastries, and other baked goods.
- Soups, Sauces & Dressings: This segment shows promising growth, with sweeteners enhancing flavour profiles and overall palatability.
UK Food Sweeteners Market Product Innovations
Recent innovations focus on developing novel sweeteners with enhanced taste profiles, improved functionality, and health benefits. These innovations address consumer preferences for reduced sugar and calorie intake. Stevia, erythritol, and other natural sweeteners are gaining traction, while advancements in HIS production are driving cost reduction and improved taste. The market is witnessing the introduction of hybrid sweeteners combining the functionalities of different sweetener types.
Report Scope & Segmentation Analysis
This report segments the UK food sweeteners market by product type (Sucrose, Starch Sweeteners and Sugar Alcohols, High Intensity Sweeteners (HIS)) and application (Dairy, Bakery, Soups, Sauces & Dressings, Confectionery, Beverages, Other Applications). Each segment's growth projection, market size, and competitive dynamics are extensively analyzed, considering factors such as market share, innovation, and regulatory influences. The market size for Sucrose in 2025 is estimated at £xx Million, with projected growth to £xx Million by 2033. Similarly, the HIS segment is projected to grow from £xx Million in 2025 to £xx Million by 2033.
Key Drivers of UK Food Sweeteners Market Growth
Key growth drivers include:
- Growing health consciousness: Demand for low-calorie and sugar-free options.
- Technological advancements: Development of novel sweeteners with improved properties.
- Stringent regulations: Government initiatives promoting healthier food choices.
Challenges in the UK Food Sweeteners Market Sector
Challenges include:
- Regulatory hurdles: Strict labeling and approval processes.
- Supply chain issues: Potential disruptions affecting raw material availability and pricing.
- Intense competition: Pressure from established and emerging players.
Emerging Opportunities in UK Food Sweeteners Market
Emerging opportunities include:
- Growing demand for natural sweeteners: Opportunities in organic and sustainably sourced sweeteners.
- Functional sweeteners: Sweeteners with added health benefits (e.g., prebiotics, probiotics).
- Personalized nutrition: Tailored sweetener solutions for specific dietary needs.
Leading Players in the UK Food Sweeteners Market Market
Key Developments in UK Food Sweeteners Market Industry
- October 2024: Launch of a new stevia-based sweetener by X company.
- June 2023: Acquisition of Y company by Z company.
- (Further developments will be detailed in the full report)
Future Outlook for UK Food Sweeteners Market Market
The UK food sweeteners market is poised for continued growth, driven by evolving consumer preferences, technological advancements, and favorable regulatory environments. The market's future potential lies in the development of innovative sweeteners that meet diverse consumer needs. Strategic partnerships and investments in research and development will further propel market growth.
UK Food Sweeteners Market Segmentation
-
1. Product Type
- 1.1. Sucrose
-
1.2. Starch Sweeteners and Sugar Alcohols
- 1.2.1. Dextrose
- 1.2.2. High Fructose Corn Syrup (HFCS)
- 1.2.3. Maltodextrin
- 1.2.4. Sorbitol
- 1.2.5. Xylitol
- 1.2.6. Other Starch Sweeteners and Sugar Alcohols
-
1.3. High Intensity Sweeteners (HIS)
- 1.3.1. Sucralose
- 1.3.2. Aspartame
- 1.3.3. Saccharin
- 1.3.4. Cyclamate
- 1.3.5. Ace-K
- 1.3.6. Neotame
- 1.3.7. Stevia
- 1.3.8. Other High Intensity Sweeteners
-
2. Application
- 2.1. Dairy
- 2.2. Bakery
- 2.3. Soups, Sauces and Dressings
- 2.4. Confectionery
- 2.5. Beverages
- 2.6. Other Applications
UK Food Sweeteners Market Segmentation By Geography
-
1. North America
- 1.1. United States
- 1.2. Canada
- 1.3. Mexico
-
2. South America
- 2.1. Brazil
- 2.2. Argentina
- 2.3. Rest of South America
-
3. Europe
- 3.1. United Kingdom
- 3.2. Germany
- 3.3. France
- 3.4. Italy
- 3.5. Spain
- 3.6. Russia
- 3.7. Benelux
- 3.8. Nordics
- 3.9. Rest of Europe
-
4. Middle East & Africa
- 4.1. Turkey
- 4.2. Israel
- 4.3. GCC
- 4.4. North Africa
- 4.5. South Africa
- 4.6. Rest of Middle East & Africa
-
5. Asia Pacific
- 5.1. China
- 5.2. India
- 5.3. Japan
- 5.4. South Korea
- 5.5. ASEAN
- 5.6. Oceania
- 5.7. Rest of Asia Pacific
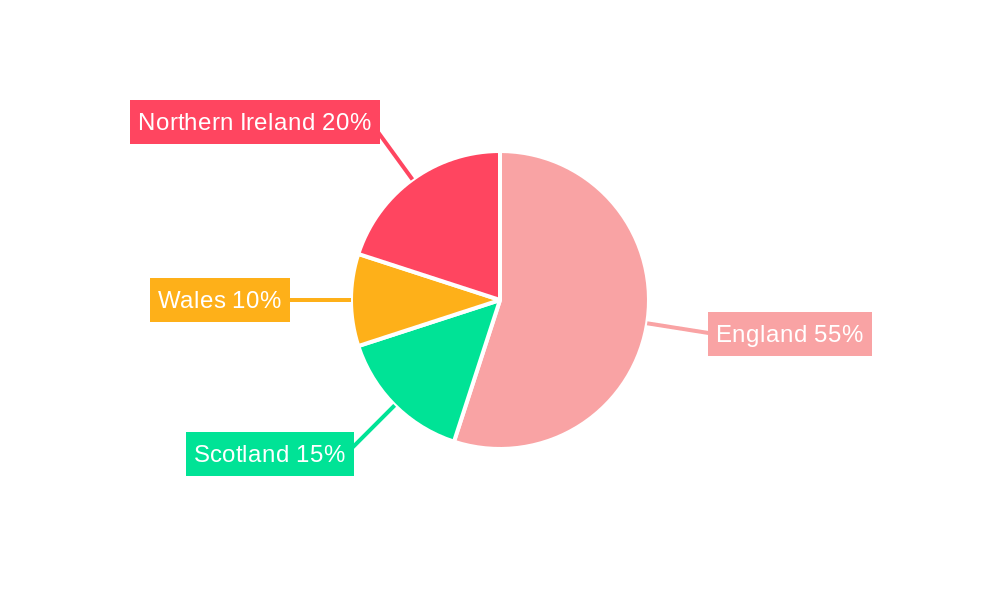
UK Food Sweeteners Market Regional Market Share
Geographic Coverage of UK Food Sweeteners Market
UK Food Sweeteners Market REPORT HIGHLIGHTS
| Aspects | Details |
|---|---|
| Study Period | 2020-2034 |
| Base Year | 2025 |
| Estimated Year | 2026 |
| Forecast Period | 2026-2034 |
| Historical Period | 2020-2025 |
| Growth Rate | CAGR of 5.61% from 2020-2034 |
| Segmentation |
|
Table of Contents
- 1. Introduction
- 1.1. Research Scope
- 1.2. Market Segmentation
- 1.3. Research Methodology
- 1.4. Definitions and Assumptions
- 2. Executive Summary
- 2.1. Introduction
- 3. Market Dynamics
- 3.1. Introduction
- 3.2. Market Drivers
- 3.2.1. Rising Application in Dietary Supplements
- 3.3. Market Restrains
- 3.3.1. Increasing prevalence of hydroglycemia
- 3.4. Market Trends
- 3.4.1. Xylitol Accounts For The Largest Share
- 4. Market Factor Analysis
- 4.1. Porters Five Forces
- 4.2. Supply/Value Chain
- 4.3. PESTEL analysis
- 4.4. Market Entropy
- 4.5. Patent/Trademark Analysis
- 5. Global UK Food Sweeteners Market Analysis, Insights and Forecast, 2020-2032
- 5.1. Market Analysis, Insights and Forecast - by Product Type
- 5.1.1. Sucrose
- 5.1.2. Starch Sweeteners and Sugar Alcohols
- 5.1.2.1. Dextrose
- 5.1.2.2. High Fructose Corn Syrup (HFCS)
- 5.1.2.3. Maltodextrin
- 5.1.2.4. Sorbitol
- 5.1.2.5. Xylitol
- 5.1.2.6. Other Starch Sweeteners and Sugar Alcohols
- 5.1.3. High Intensity Sweeteners (HIS)
- 5.1.3.1. Sucralose
- 5.1.3.2. Aspartame
- 5.1.3.3. Saccharin
- 5.1.3.4. Cyclamate
- 5.1.3.5. Ace-K
- 5.1.3.6. Neotame
- 5.1.3.7. Stevia
- 5.1.3.8. Other High Intensity Sweeteners
- 5.2. Market Analysis, Insights and Forecast - by Application
- 5.2.1. Dairy
- 5.2.2. Bakery
- 5.2.3. Soups, Sauces and Dressings
- 5.2.4. Confectionery
- 5.2.5. Beverages
- 5.2.6. Other Applications
- 5.3. Market Analysis, Insights and Forecast - by Region
- 5.3.1. North America
- 5.3.2. South America
- 5.3.3. Europe
- 5.3.4. Middle East & Africa
- 5.3.5. Asia Pacific
- 5.1. Market Analysis, Insights and Forecast - by Product Type
- 6. North America UK Food Sweeteners Market Analysis, Insights and Forecast, 2020-2032
- 6.1. Market Analysis, Insights and Forecast - by Product Type
- 6.1.1. Sucrose
- 6.1.2. Starch Sweeteners and Sugar Alcohols
- 6.1.2.1. Dextrose
- 6.1.2.2. High Fructose Corn Syrup (HFCS)
- 6.1.2.3. Maltodextrin
- 6.1.2.4. Sorbitol
- 6.1.2.5. Xylitol
- 6.1.2.6. Other Starch Sweeteners and Sugar Alcohols
- 6.1.3. High Intensity Sweeteners (HIS)
- 6.1.3.1. Sucralose
- 6.1.3.2. Aspartame
- 6.1.3.3. Saccharin
- 6.1.3.4. Cyclamate
- 6.1.3.5. Ace-K
- 6.1.3.6. Neotame
- 6.1.3.7. Stevia
- 6.1.3.8. Other High Intensity Sweeteners
- 6.2. Market Analysis, Insights and Forecast - by Application
- 6.2.1. Dairy
- 6.2.2. Bakery
- 6.2.3. Soups, Sauces and Dressings
- 6.2.4. Confectionery
- 6.2.5. Beverages
- 6.2.6. Other Applications
- 6.1. Market Analysis, Insights and Forecast - by Product Type
- 7. South America UK Food Sweeteners Market Analysis, Insights and Forecast, 2020-2032
- 7.1. Market Analysis, Insights and Forecast - by Product Type
- 7.1.1. Sucrose
- 7.1.2. Starch Sweeteners and Sugar Alcohols
- 7.1.2.1. Dextrose
- 7.1.2.2. High Fructose Corn Syrup (HFCS)
- 7.1.2.3. Maltodextrin
- 7.1.2.4. Sorbitol
- 7.1.2.5. Xylitol
- 7.1.2.6. Other Starch Sweeteners and Sugar Alcohols
- 7.1.3. High Intensity Sweeteners (HIS)
- 7.1.3.1. Sucralose
- 7.1.3.2. Aspartame
- 7.1.3.3. Saccharin
- 7.1.3.4. Cyclamate
- 7.1.3.5. Ace-K
- 7.1.3.6. Neotame
- 7.1.3.7. Stevia
- 7.1.3.8. Other High Intensity Sweeteners
- 7.2. Market Analysis, Insights and Forecast - by Application
- 7.2.1. Dairy
- 7.2.2. Bakery
- 7.2.3. Soups, Sauces and Dressings
- 7.2.4. Confectionery
- 7.2.5. Beverages
- 7.2.6. Other Applications
- 7.1. Market Analysis, Insights and Forecast - by Product Type
- 8. Europe UK Food Sweeteners Market Analysis, Insights and Forecast, 2020-2032
- 8.1. Market Analysis, Insights and Forecast - by Product Type
- 8.1.1. Sucrose
- 8.1.2. Starch Sweeteners and Sugar Alcohols
- 8.1.2.1. Dextrose
- 8.1.2.2. High Fructose Corn Syrup (HFCS)
- 8.1.2.3. Maltodextrin
- 8.1.2.4. Sorbitol
- 8.1.2.5. Xylitol
- 8.1.2.6. Other Starch Sweeteners and Sugar Alcohols
- 8.1.3. High Intensity Sweeteners (HIS)
- 8.1.3.1. Sucralose
- 8.1.3.2. Aspartame
- 8.1.3.3. Saccharin
- 8.1.3.4. Cyclamate
- 8.1.3.5. Ace-K
- 8.1.3.6. Neotame
- 8.1.3.7. Stevia
- 8.1.3.8. Other High Intensity Sweeteners
- 8.2. Market Analysis, Insights and Forecast - by Application
- 8.2.1. Dairy
- 8.2.2. Bakery
- 8.2.3. Soups, Sauces and Dressings
- 8.2.4. Confectionery
- 8.2.5. Beverages
- 8.2.6. Other Applications
- 8.1. Market Analysis, Insights and Forecast - by Product Type
- 9. Middle East & Africa UK Food Sweeteners Market Analysis, Insights and Forecast, 2020-2032
- 9.1. Market Analysis, Insights and Forecast - by Product Type
- 9.1.1. Sucrose
- 9.1.2. Starch Sweeteners and Sugar Alcohols
- 9.1.2.1. Dextrose
- 9.1.2.2. High Fructose Corn Syrup (HFCS)
- 9.1.2.3. Maltodextrin
- 9.1.2.4. Sorbitol
- 9.1.2.5. Xylitol
- 9.1.2.6. Other Starch Sweeteners and Sugar Alcohols
- 9.1.3. High Intensity Sweeteners (HIS)
- 9.1.3.1. Sucralose
- 9.1.3.2. Aspartame
- 9.1.3.3. Saccharin
- 9.1.3.4. Cyclamate
- 9.1.3.5. Ace-K
- 9.1.3.6. Neotame
- 9.1.3.7. Stevia
- 9.1.3.8. Other High Intensity Sweeteners
- 9.2. Market Analysis, Insights and Forecast - by Application
- 9.2.1. Dairy
- 9.2.2. Bakery
- 9.2.3. Soups, Sauces and Dressings
- 9.2.4. Confectionery
- 9.2.5. Beverages
- 9.2.6. Other Applications
- 9.1. Market Analysis, Insights and Forecast - by Product Type
- 10. Asia Pacific UK Food Sweeteners Market Analysis, Insights and Forecast, 2020-2032
- 10.1. Market Analysis, Insights and Forecast - by Product Type
- 10.1.1. Sucrose
- 10.1.2. Starch Sweeteners and Sugar Alcohols
- 10.1.2.1. Dextrose
- 10.1.2.2. High Fructose Corn Syrup (HFCS)
- 10.1.2.3. Maltodextrin
- 10.1.2.4. Sorbitol
- 10.1.2.5. Xylitol
- 10.1.2.6. Other Starch Sweeteners and Sugar Alcohols
- 10.1.3. High Intensity Sweeteners (HIS)
- 10.1.3.1. Sucralose
- 10.1.3.2. Aspartame
- 10.1.3.3. Saccharin
- 10.1.3.4. Cyclamate
- 10.1.3.5. Ace-K
- 10.1.3.6. Neotame
- 10.1.3.7. Stevia
- 10.1.3.8. Other High Intensity Sweeteners
- 10.2. Market Analysis, Insights and Forecast - by Application
- 10.2.1. Dairy
- 10.2.2. Bakery
- 10.2.3. Soups, Sauces and Dressings
- 10.2.4. Confectionery
- 10.2.5. Beverages
- 10.2.6. Other Applications
- 10.1. Market Analysis, Insights and Forecast - by Product Type
- 11. Competitive Analysis
- 11.1. Global Market Share Analysis 2025
- 11.2. Company Profiles
- 11.2.1 Cargill Incorporated
- 11.2.1.1. Overview
- 11.2.1.2. Products
- 11.2.1.3. SWOT Analysis
- 11.2.1.4. Recent Developments
- 11.2.1.5. Financials (Based on Availability)
- 11.2.2 GLG Life Tech Corporation
- 11.2.2.1. Overview
- 11.2.2.2. Products
- 11.2.2.3. SWOT Analysis
- 11.2.2.4. Recent Developments
- 11.2.2.5. Financials (Based on Availability)
- 11.2.3 PureCircle Limited
- 11.2.3.1. Overview
- 11.2.3.2. Products
- 11.2.3.3. SWOT Analysis
- 11.2.3.4. Recent Developments
- 11.2.3.5. Financials (Based on Availability)
- 11.2.4 Archer Daniels Midland Company
- 11.2.4.1. Overview
- 11.2.4.2. Products
- 11.2.4.3. SWOT Analysis
- 11.2.4.4. Recent Developments
- 11.2.4.5. Financials (Based on Availability)
- 11.2.5 Tate & Lyle PLC
- 11.2.5.1. Overview
- 11.2.5.2. Products
- 11.2.5.3. SWOT Analysis
- 11.2.5.4. Recent Developments
- 11.2.5.5. Financials (Based on Availability)
- 11.2.6 DuPont
- 11.2.6.1. Overview
- 11.2.6.2. Products
- 11.2.6.3. SWOT Analysis
- 11.2.6.4. Recent Developments
- 11.2.6.5. Financials (Based on Availability)
- 11.2.7 Ingredion Incorporated
- 11.2.7.1. Overview
- 11.2.7.2. Products
- 11.2.7.3. SWOT Analysis
- 11.2.7.4. Recent Developments
- 11.2.7.5. Financials (Based on Availability)
- 11.2.8 Tereos S A *List Not Exhaustive
- 11.2.8.1. Overview
- 11.2.8.2. Products
- 11.2.8.3. SWOT Analysis
- 11.2.8.4. Recent Developments
- 11.2.8.5. Financials (Based on Availability)
- 11.2.1 Cargill Incorporated
List of Figures
- Figure 1: Global UK Food Sweeteners Market Revenue Breakdown (billion, %) by Region 2025 & 2033
- Figure 2: Global UK Food Sweeteners Market Volume Breakdown (K Tons, %) by Region 2025 & 2033
- Figure 3: North America UK Food Sweeteners Market Revenue (billion), by Product Type 2025 & 2033
- Figure 4: North America UK Food Sweeteners Market Volume (K Tons), by Product Type 2025 & 2033
- Figure 5: North America UK Food Sweeteners Market Revenue Share (%), by Product Type 2025 & 2033
- Figure 6: North America UK Food Sweeteners Market Volume Share (%), by Product Type 2025 & 2033
- Figure 7: North America UK Food Sweeteners Market Revenue (billion), by Application 2025 & 2033
- Figure 8: North America UK Food Sweeteners Market Volume (K Tons), by Application 2025 & 2033
- Figure 9: North America UK Food Sweeteners Market Revenue Share (%), by Application 2025 & 2033
- Figure 10: North America UK Food Sweeteners Market Volume Share (%), by Application 2025 & 2033
- Figure 11: North America UK Food Sweeteners Market Revenue (billion), by Country 2025 & 2033
- Figure 12: North America UK Food Sweeteners Market Volume (K Tons), by Country 2025 & 2033
- Figure 13: North America UK Food Sweeteners Market Revenue Share (%), by Country 2025 & 2033
- Figure 14: North America UK Food Sweeteners Market Volume Share (%), by Country 2025 & 2033
- Figure 15: South America UK Food Sweeteners Market Revenue (billion), by Product Type 2025 & 2033
- Figure 16: South America UK Food Sweeteners Market Volume (K Tons), by Product Type 2025 & 2033
- Figure 17: South America UK Food Sweeteners Market Revenue Share (%), by Product Type 2025 & 2033
- Figure 18: South America UK Food Sweeteners Market Volume Share (%), by Product Type 2025 & 2033
- Figure 19: South America UK Food Sweeteners Market Revenue (billion), by Application 2025 & 2033
- Figure 20: South America UK Food Sweeteners Market Volume (K Tons), by Application 2025 & 2033
- Figure 21: South America UK Food Sweeteners Market Revenue Share (%), by Application 2025 & 2033
- Figure 22: South America UK Food Sweeteners Market Volume Share (%), by Application 2025 & 2033
- Figure 23: South America UK Food Sweeteners Market Revenue (billion), by Country 2025 & 2033
- Figure 24: South America UK Food Sweeteners Market Volume (K Tons), by Country 2025 & 2033
- Figure 25: South America UK Food Sweeteners Market Revenue Share (%), by Country 2025 & 2033
- Figure 26: South America UK Food Sweeteners Market Volume Share (%), by Country 2025 & 2033
- Figure 27: Europe UK Food Sweeteners Market Revenue (billion), by Product Type 2025 & 2033
- Figure 28: Europe UK Food Sweeteners Market Volume (K Tons), by Product Type 2025 & 2033
- Figure 29: Europe UK Food Sweeteners Market Revenue Share (%), by Product Type 2025 & 2033
- Figure 30: Europe UK Food Sweeteners Market Volume Share (%), by Product Type 2025 & 2033
- Figure 31: Europe UK Food Sweeteners Market Revenue (billion), by Application 2025 & 2033
- Figure 32: Europe UK Food Sweeteners Market Volume (K Tons), by Application 2025 & 2033
- Figure 33: Europe UK Food Sweeteners Market Revenue Share (%), by Application 2025 & 2033
- Figure 34: Europe UK Food Sweeteners Market Volume Share (%), by Application 2025 & 2033
- Figure 35: Europe UK Food Sweeteners Market Revenue (billion), by Country 2025 & 2033
- Figure 36: Europe UK Food Sweeteners Market Volume (K Tons), by Country 2025 & 2033
- Figure 37: Europe UK Food Sweeteners Market Revenue Share (%), by Country 2025 & 2033
- Figure 38: Europe UK Food Sweeteners Market Volume Share (%), by Country 2025 & 2033
- Figure 39: Middle East & Africa UK Food Sweeteners Market Revenue (billion), by Product Type 2025 & 2033
- Figure 40: Middle East & Africa UK Food Sweeteners Market Volume (K Tons), by Product Type 2025 & 2033
- Figure 41: Middle East & Africa UK Food Sweeteners Market Revenue Share (%), by Product Type 2025 & 2033
- Figure 42: Middle East & Africa UK Food Sweeteners Market Volume Share (%), by Product Type 2025 & 2033
- Figure 43: Middle East & Africa UK Food Sweeteners Market Revenue (billion), by Application 2025 & 2033
- Figure 44: Middle East & Africa UK Food Sweeteners Market Volume (K Tons), by Application 2025 & 2033
- Figure 45: Middle East & Africa UK Food Sweeteners Market Revenue Share (%), by Application 2025 & 2033
- Figure 46: Middle East & Africa UK Food Sweeteners Market Volume Share (%), by Application 2025 & 2033
- Figure 47: Middle East & Africa UK Food Sweeteners Market Revenue (billion), by Country 2025 & 2033
- Figure 48: Middle East & Africa UK Food Sweeteners Market Volume (K Tons), by Country 2025 & 2033
- Figure 49: Middle East & Africa UK Food Sweeteners Market Revenue Share (%), by Country 2025 & 2033
- Figure 50: Middle East & Africa UK Food Sweeteners Market Volume Share (%), by Country 2025 & 2033
- Figure 51: Asia Pacific UK Food Sweeteners Market Revenue (billion), by Product Type 2025 & 2033
- Figure 52: Asia Pacific UK Food Sweeteners Market Volume (K Tons), by Product Type 2025 & 2033
- Figure 53: Asia Pacific UK Food Sweeteners Market Revenue Share (%), by Product Type 2025 & 2033
- Figure 54: Asia Pacific UK Food Sweeteners Market Volume Share (%), by Product Type 2025 & 2033
- Figure 55: Asia Pacific UK Food Sweeteners Market Revenue (billion), by Application 2025 & 2033
- Figure 56: Asia Pacific UK Food Sweeteners Market Volume (K Tons), by Application 2025 & 2033
- Figure 57: Asia Pacific UK Food Sweeteners Market Revenue Share (%), by Application 2025 & 2033
- Figure 58: Asia Pacific UK Food Sweeteners Market Volume Share (%), by Application 2025 & 2033
- Figure 59: Asia Pacific UK Food Sweeteners Market Revenue (billion), by Country 2025 & 2033
- Figure 60: Asia Pacific UK Food Sweeteners Market Volume (K Tons), by Country 2025 & 2033
- Figure 61: Asia Pacific UK Food Sweeteners Market Revenue Share (%), by Country 2025 & 2033
- Figure 62: Asia Pacific UK Food Sweeteners Market Volume Share (%), by Country 2025 & 2033
List of Tables
- Table 1: Global UK Food Sweeteners Market Revenue billion Forecast, by Product Type 2020 & 2033
- Table 2: Global UK Food Sweeteners Market Volume K Tons Forecast, by Product Type 2020 & 2033
- Table 3: Global UK Food Sweeteners Market Revenue billion Forecast, by Application 2020 & 2033
- Table 4: Global UK Food Sweeteners Market Volume K Tons Forecast, by Application 2020 & 2033
- Table 5: Global UK Food Sweeteners Market Revenue billion Forecast, by Region 2020 & 2033
- Table 6: Global UK Food Sweeteners Market Volume K Tons Forecast, by Region 2020 & 2033
- Table 7: Global UK Food Sweeteners Market Revenue billion Forecast, by Product Type 2020 & 2033
- Table 8: Global UK Food Sweeteners Market Volume K Tons Forecast, by Product Type 2020 & 2033
- Table 9: Global UK Food Sweeteners Market Revenue billion Forecast, by Application 2020 & 2033
- Table 10: Global UK Food Sweeteners Market Volume K Tons Forecast, by Application 2020 & 2033
- Table 11: Global UK Food Sweeteners Market Revenue billion Forecast, by Country 2020 & 2033
- Table 12: Global UK Food Sweeteners Market Volume K Tons Forecast, by Country 2020 & 2033
- Table 13: United States UK Food Sweeteners Market Revenue (billion) Forecast, by Application 2020 & 2033
- Table 14: United States UK Food Sweeteners Market Volume (K Tons) Forecast, by Application 2020 & 2033
- Table 15: Canada UK Food Sweeteners Market Revenue (billion) Forecast, by Application 2020 & 2033
- Table 16: Canada UK Food Sweeteners Market Volume (K Tons) Forecast, by Application 2020 & 2033
- Table 17: Mexico UK Food Sweeteners Market Revenue (billion) Forecast, by Application 2020 & 2033
- Table 18: Mexico UK Food Sweeteners Market Volume (K Tons) Forecast, by Application 2020 & 2033
- Table 19: Global UK Food Sweeteners Market Revenue billion Forecast, by Product Type 2020 & 2033
- Table 20: Global UK Food Sweeteners Market Volume K Tons Forecast, by Product Type 2020 & 2033
- Table 21: Global UK Food Sweeteners Market Revenue billion Forecast, by Application 2020 & 2033
- Table 22: Global UK Food Sweeteners Market Volume K Tons Forecast, by Application 2020 & 2033
- Table 23: Global UK Food Sweeteners Market Revenue billion Forecast, by Country 2020 & 2033
- Table 24: Global UK Food Sweeteners Market Volume K Tons Forecast, by Country 2020 & 2033
- Table 25: Brazil UK Food Sweeteners Market Revenue (billion) Forecast, by Application 2020 & 2033
- Table 26: Brazil UK Food Sweeteners Market Volume (K Tons) Forecast, by Application 2020 & 2033
- Table 27: Argentina UK Food Sweeteners Market Revenue (billion) Forecast, by Application 2020 & 2033
- Table 28: Argentina UK Food Sweeteners Market Volume (K Tons) Forecast, by Application 2020 & 2033
- Table 29: Rest of South America UK Food Sweeteners Market Revenue (billion) Forecast, by Application 2020 & 2033
- Table 30: Rest of South America UK Food Sweeteners Market Volume (K Tons) Forecast, by Application 2020 & 2033
- Table 31: Global UK Food Sweeteners Market Revenue billion Forecast, by Product Type 2020 & 2033
- Table 32: Global UK Food Sweeteners Market Volume K Tons Forecast, by Product Type 2020 & 2033
- Table 33: Global UK Food Sweeteners Market Revenue billion Forecast, by Application 2020 & 2033
- Table 34: Global UK Food Sweeteners Market Volume K Tons Forecast, by Application 2020 & 2033
- Table 35: Global UK Food Sweeteners Market Revenue billion Forecast, by Country 2020 & 2033
- Table 36: Global UK Food Sweeteners Market Volume K Tons Forecast, by Country 2020 & 2033
- Table 37: United Kingdom UK Food Sweeteners Market Revenue (billion) Forecast, by Application 2020 & 2033
- Table 38: United Kingdom UK Food Sweeteners Market Volume (K Tons) Forecast, by Application 2020 & 2033
- Table 39: Germany UK Food Sweeteners Market Revenue (billion) Forecast, by Application 2020 & 2033
- Table 40: Germany UK Food Sweeteners Market Volume (K Tons) Forecast, by Application 2020 & 2033
- Table 41: France UK Food Sweeteners Market Revenue (billion) Forecast, by Application 2020 & 2033
- Table 42: France UK Food Sweeteners Market Volume (K Tons) Forecast, by Application 2020 & 2033
- Table 43: Italy UK Food Sweeteners Market Revenue (billion) Forecast, by Application 2020 & 2033
- Table 44: Italy UK Food Sweeteners Market Volume (K Tons) Forecast, by Application 2020 & 2033
- Table 45: Spain UK Food Sweeteners Market Revenue (billion) Forecast, by Application 2020 & 2033
- Table 46: Spain UK Food Sweeteners Market Volume (K Tons) Forecast, by Application 2020 & 2033
- Table 47: Russia UK Food Sweeteners Market Revenue (billion) Forecast, by Application 2020 & 2033
- Table 48: Russia UK Food Sweeteners Market Volume (K Tons) Forecast, by Application 2020 & 2033
- Table 49: Benelux UK Food Sweeteners Market Revenue (billion) Forecast, by Application 2020 & 2033
- Table 50: Benelux UK Food Sweeteners Market Volume (K Tons) Forecast, by Application 2020 & 2033
- Table 51: Nordics UK Food Sweeteners Market Revenue (billion) Forecast, by Application 2020 & 2033
- Table 52: Nordics UK Food Sweeteners Market Volume (K Tons) Forecast, by Application 2020 & 2033
- Table 53: Rest of Europe UK Food Sweeteners Market Revenue (billion) Forecast, by Application 2020 & 2033
- Table 54: Rest of Europe UK Food Sweeteners Market Volume (K Tons) Forecast, by Application 2020 & 2033
- Table 55: Global UK Food Sweeteners Market Revenue billion Forecast, by Product Type 2020 & 2033
- Table 56: Global UK Food Sweeteners Market Volume K Tons Forecast, by Product Type 2020 & 2033
- Table 57: Global UK Food Sweeteners Market Revenue billion Forecast, by Application 2020 & 2033
- Table 58: Global UK Food Sweeteners Market Volume K Tons Forecast, by Application 2020 & 2033
- Table 59: Global UK Food Sweeteners Market Revenue billion Forecast, by Country 2020 & 2033
- Table 60: Global UK Food Sweeteners Market Volume K Tons Forecast, by Country 2020 & 2033
- Table 61: Turkey UK Food Sweeteners Market Revenue (billion) Forecast, by Application 2020 & 2033
- Table 62: Turkey UK Food Sweeteners Market Volume (K Tons) Forecast, by Application 2020 & 2033
- Table 63: Israel UK Food Sweeteners Market Revenue (billion) Forecast, by Application 2020 & 2033
- Table 64: Israel UK Food Sweeteners Market Volume (K Tons) Forecast, by Application 2020 & 2033
- Table 65: GCC UK Food Sweeteners Market Revenue (billion) Forecast, by Application 2020 & 2033
- Table 66: GCC UK Food Sweeteners Market Volume (K Tons) Forecast, by Application 2020 & 2033
- Table 67: North Africa UK Food Sweeteners Market Revenue (billion) Forecast, by Application 2020 & 2033
- Table 68: North Africa UK Food Sweeteners Market Volume (K Tons) Forecast, by Application 2020 & 2033
- Table 69: South Africa UK Food Sweeteners Market Revenue (billion) Forecast, by Application 2020 & 2033
- Table 70: South Africa UK Food Sweeteners Market Volume (K Tons) Forecast, by Application 2020 & 2033
- Table 71: Rest of Middle East & Africa UK Food Sweeteners Market Revenue (billion) Forecast, by Application 2020 & 2033
- Table 72: Rest of Middle East & Africa UK Food Sweeteners Market Volume (K Tons) Forecast, by Application 2020 & 2033
- Table 73: Global UK Food Sweeteners Market Revenue billion Forecast, by Product Type 2020 & 2033
- Table 74: Global UK Food Sweeteners Market Volume K Tons Forecast, by Product Type 2020 & 2033
- Table 75: Global UK Food Sweeteners Market Revenue billion Forecast, by Application 2020 & 2033
- Table 76: Global UK Food Sweeteners Market Volume K Tons Forecast, by Application 2020 & 2033
- Table 77: Global UK Food Sweeteners Market Revenue billion Forecast, by Country 2020 & 2033
- Table 78: Global UK Food Sweeteners Market Volume K Tons Forecast, by Country 2020 & 2033
- Table 79: China UK Food Sweeteners Market Revenue (billion) Forecast, by Application 2020 & 2033
- Table 80: China UK Food Sweeteners Market Volume (K Tons) Forecast, by Application 2020 & 2033
- Table 81: India UK Food Sweeteners Market Revenue (billion) Forecast, by Application 2020 & 2033
- Table 82: India UK Food Sweeteners Market Volume (K Tons) Forecast, by Application 2020 & 2033
- Table 83: Japan UK Food Sweeteners Market Revenue (billion) Forecast, by Application 2020 & 2033
- Table 84: Japan UK Food Sweeteners Market Volume (K Tons) Forecast, by Application 2020 & 2033
- Table 85: South Korea UK Food Sweeteners Market Revenue (billion) Forecast, by Application 2020 & 2033
- Table 86: South Korea UK Food Sweeteners Market Volume (K Tons) Forecast, by Application 2020 & 2033
- Table 87: ASEAN UK Food Sweeteners Market Revenue (billion) Forecast, by Application 2020 & 2033
- Table 88: ASEAN UK Food Sweeteners Market Volume (K Tons) Forecast, by Application 2020 & 2033
- Table 89: Oceania UK Food Sweeteners Market Revenue (billion) Forecast, by Application 2020 & 2033
- Table 90: Oceania UK Food Sweeteners Market Volume (K Tons) Forecast, by Application 2020 & 2033
- Table 91: Rest of Asia Pacific UK Food Sweeteners Market Revenue (billion) Forecast, by Application 2020 & 2033
- Table 92: Rest of Asia Pacific UK Food Sweeteners Market Volume (K Tons) Forecast, by Application 2020 & 2033
Frequently Asked Questions
1. What is the projected Compound Annual Growth Rate (CAGR) of the UK Food Sweeteners Market?
The projected CAGR is approximately 5.61%.
2. Which companies are prominent players in the UK Food Sweeteners Market?
Key companies in the market include Cargill Incorporated, GLG Life Tech Corporation, PureCircle Limited, Archer Daniels Midland Company, Tate & Lyle PLC, DuPont, Ingredion Incorporated, Tereos S A *List Not Exhaustive.
3. What are the main segments of the UK Food Sweeteners Market?
The market segments include Product Type, Application.
4. Can you provide details about the market size?
The market size is estimated to be USD 1.69 billion as of 2022.
5. What are some drivers contributing to market growth?
Rising Application in Dietary Supplements.
6. What are the notable trends driving market growth?
Xylitol Accounts For The Largest Share.
7. Are there any restraints impacting market growth?
Increasing prevalence of hydroglycemia.
8. Can you provide examples of recent developments in the market?
N/A
9. What pricing options are available for accessing the report?
Pricing options include single-user, multi-user, and enterprise licenses priced at USD 3800, USD 4500, and USD 5800 respectively.
10. Is the market size provided in terms of value or volume?
The market size is provided in terms of value, measured in billion and volume, measured in K Tons.
11. Are there any specific market keywords associated with the report?
Yes, the market keyword associated with the report is "UK Food Sweeteners Market," which aids in identifying and referencing the specific market segment covered.
12. How do I determine which pricing option suits my needs best?
The pricing options vary based on user requirements and access needs. Individual users may opt for single-user licenses, while businesses requiring broader access may choose multi-user or enterprise licenses for cost-effective access to the report.
13. Are there any additional resources or data provided in the UK Food Sweeteners Market report?
While the report offers comprehensive insights, it's advisable to review the specific contents or supplementary materials provided to ascertain if additional resources or data are available.
14. How can I stay updated on further developments or reports in the UK Food Sweeteners Market?
To stay informed about further developments, trends, and reports in the UK Food Sweeteners Market, consider subscribing to industry newsletters, following relevant companies and organizations, or regularly checking reputable industry news sources and publications.
Methodology
Step 1 - Identification of Relevant Samples Size from Population Database


Step 2 - Approaches for Defining Global Market Size (Value, Volume* & Price*)

Note*: In applicable scenarios
Step 3 - Data Sources
Primary Research
- Web Analytics
- Survey Reports
- Research Institute
- Latest Research Reports
- Opinion Leaders
Secondary Research
- Annual Reports
- White Paper
- Latest Press Release
- Industry Association
- Paid Database
- Investor Presentations

Step 4 - Data Triangulation
Involves using different sources of information in order to increase the validity of a study
These sources are likely to be stakeholders in a program - participants, other researchers, program staff, other community members, and so on.
Then we put all data in single framework & apply various statistical tools to find out the dynamic on the market.
During the analysis stage, feedback from the stakeholder groups would be compared to determine areas of agreement as well as areas of divergence