
Key Insights
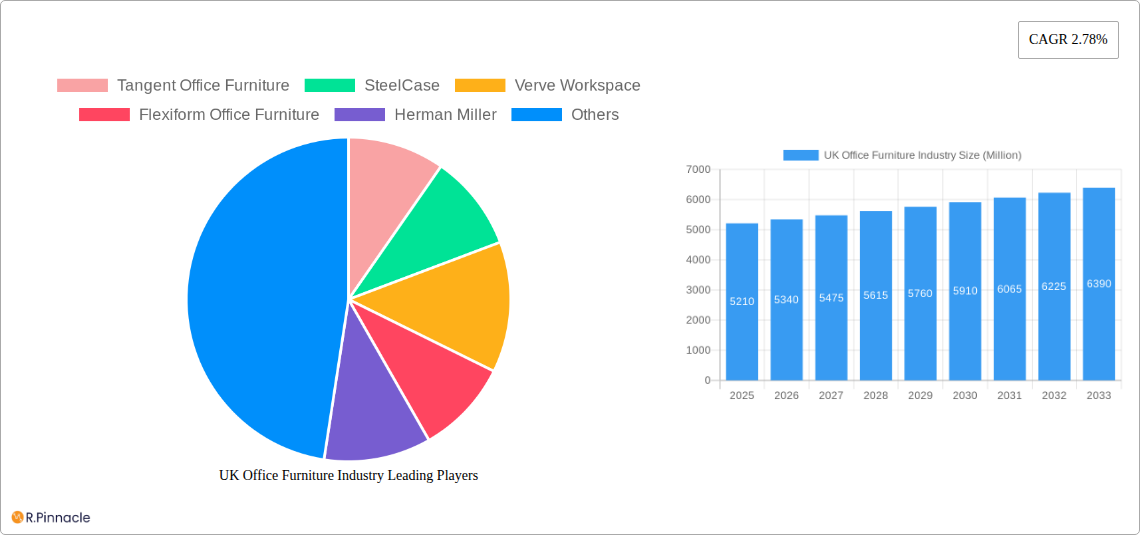
The UK office furniture market, valued at £5.21 billion in 2025, is projected to experience steady growth, driven by several key factors. The increasing adoption of hybrid work models necessitates adaptable and ergonomic furniture solutions, fueling demand for adjustable desks, comfortable seating, and storage solutions designed for both home and office use. Furthermore, the ongoing focus on employee wellbeing and productivity is driving investment in high-quality, ergonomic furniture that promotes a healthy and comfortable work environment. Businesses are increasingly prioritizing creating functional and aesthetically pleasing workspaces, leading to a preference for modern designs and sustainable materials. This trend benefits manufacturers offering innovative and environmentally conscious products. The market is segmented across various product categories, including seating, tables, storage, desks, and other office furniture, with seating and desks likely commanding the largest market share. Distribution channels are diverse, encompassing home centers, flagship stores, specialty stores, and online retailers, reflecting the evolving consumer purchasing habits. Competition is robust, with both established global players and smaller, specialized UK manufacturers vying for market share. The anticipated CAGR of 2.78% suggests a moderate but consistent expansion over the forecast period (2025-2033).
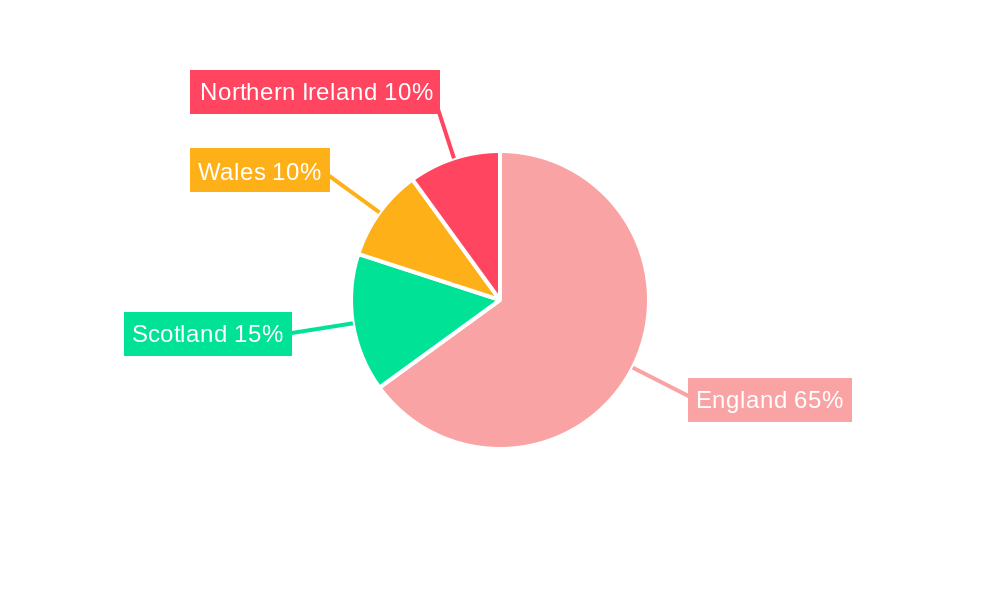
Growth is expected to be influenced by economic conditions, with periods of economic uncertainty potentially impacting investment in new office furniture. However, the long-term trend towards improved workplace ergonomics and aesthetics is anticipated to outweigh short-term economic fluctuations. The regional distribution within the UK (England, Wales, Scotland, Northern Ireland) likely reflects population density and business concentration, with London and other major urban centers showing higher demand. The market's resilience hinges on continued investment in office infrastructure, both by large corporations and smaller businesses, and the ongoing adaptation of office spaces to meet the evolving needs of a modern workforce. The rising popularity of co-working spaces also presents a significant growth opportunity for office furniture suppliers, catering to the demand for flexible and shared workspace solutions.
UK Office Furniture Industry Report: 2019-2033
This comprehensive report provides a detailed analysis of the UK office furniture industry, offering invaluable insights for industry professionals, investors, and strategic decision-makers. Covering the period 2019-2033, with a focus on 2025, this report unveils market trends, competitive dynamics, and future growth prospects. The report leverages extensive data analysis and expert insights to offer actionable intelligence.
Study Period: 2019-2033 Base Year: 2025 Estimated Year: 2025 Forecast Period: 2025-2033 Historical Period: 2019-2024
UK Office Furniture Industry Market Structure & Innovation Trends
This section analyzes the UK office furniture market's structure, identifying key players, market concentration, and innovation drivers. The report examines the regulatory landscape, explores the impact of product substitutes, and delves into end-user demographics. Furthermore, it details significant mergers and acquisitions (M&A) activities, providing insights into deal values and their market implications. The estimated market size for 2025 is £xx Million.
- Market Concentration: The report details the market share held by key players like Steelcase, Herman Miller, and Knoll, providing a comprehensive overview of the competitive landscape. The level of market concentration will be assessed, highlighting the presence of dominant players or a more fragmented market.
- Innovation Drivers: Analysis focuses on factors driving innovation, including technological advancements, changing workplace design trends, and evolving consumer preferences. This includes exploring the rise of ergonomic furniture, smart office solutions, and sustainable materials.
- Regulatory Framework: The report examines the impact of relevant regulations and standards on the industry, such as health and safety regulations and environmental standards.
- Product Substitutes: The report identifies and analyzes potential substitutes for traditional office furniture, such as hot-desking arrangements and co-working spaces.
- End-User Demographics: The analysis considers the evolving needs and preferences of different end-user segments, including large corporations, SMEs, and government organizations.
- M&A Activities: The report details significant M&A activities within the industry during the historical period, including the USD 127.5 million acquisition of Halcon by Steelcase in May 2022. The report assesses the strategic rationale behind these deals and their impact on market competition. Total M&A deal value during the period is estimated to be £xx Million.
UK Office Furniture Industry Market Dynamics & Trends
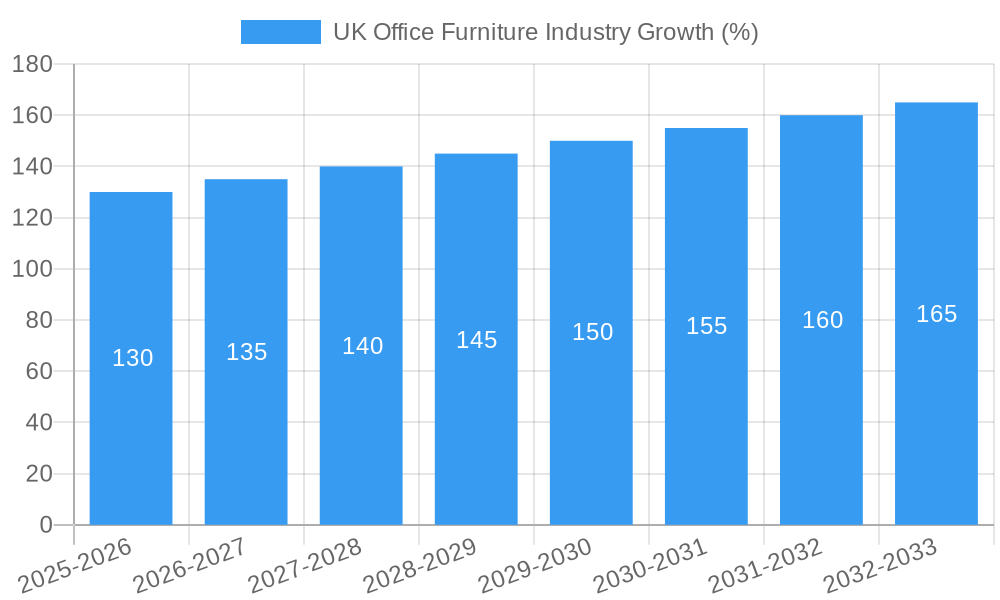
This section explores the dynamic forces shaping the UK office furniture market. It analyzes market growth drivers, technological disruptions, evolving consumer preferences, and the competitive dynamics within the industry. The report projects a CAGR of xx% for the forecast period (2025-2033). Market penetration rates for key segments will also be detailed.
(This section will contain approximately 600 words of detailed analysis expanding on the above points, providing specific data points, CAGR figures, and penetration rates based on the research conducted.)
Dominant Regions & Segments in UK Office Furniture Industry
This section identifies the leading regions and segments within the UK office furniture market. It provides a detailed analysis of the dominance of specific regions, considering factors such as economic policies and infrastructure development. For product types (Seating, Tables, Storage, Desks, Others) and distribution channels (Home Centers, Flagship Stores, Specialty Stores, Online Stores, Other Distribution Channels), the report will pinpoint the leading segment.
- Key Drivers of Regional Dominance:
- (Bullet points detailing key drivers for each dominant region and segment will be included here.)
- Dominance Analysis:
- (Paragraphs providing detailed analysis of the dominance of specific regions and segments. This will include market share data, growth trends, and contributing factors.)
UK Office Furniture Industry Product Innovations
This section summarizes recent product developments, highlighting technological advancements and their market relevance. It underscores the competitive advantages stemming from these innovations, emphasizing market fit and consumer acceptance. The section will discuss trends such as ergonomic design, smart office technology integration, and sustainable materials.
(This section will contain approximately 100-150 words detailing recent product launches, their features, and their impact on the market.)
Report Scope & Segmentation Analysis
This section provides a comprehensive overview of the market segmentation used in the report. It details market size projections, growth rates, and competitive dynamics for each segment.
- By Product Type: Seating, Tables, Storage, Desks, Others office furniture. (Paragraphs detailing market size, growth projections, and competitive dynamics for each product type will be included here.)
- By Distribution Channel: Home Centers, Flagship Stores, Specialty Stores, Online Stores, Other Distribution Channels. (Paragraphs detailing market size, growth projections, and competitive dynamics for each distribution channel will be included here.)
Key Drivers of UK Office Furniture Industry Growth
This section outlines the key factors driving the growth of the UK office furniture industry. These factors will be categorized as technological, economic, and regulatory.
(This section will contain approximately 150 words outlining key growth drivers, such as increasing office space demand, technological advancements in furniture design, and government incentives promoting sustainable office environments.)
Challenges in the UK Office Furniture Industry Sector
This section identifies and analyzes the key challenges facing the UK office furniture industry.
(This section will contain approximately 150 words detailing challenges such as rising material costs, supply chain disruptions, increasing competition, and changing consumer preferences. Quantifiable impacts of these challenges will be included where possible.)
Emerging Opportunities in UK Office Furniture Industry
This section highlights emerging opportunities within the UK office furniture industry. These will include new markets, technological advancements, and changes in consumer behavior.
(This section will contain approximately 150 words describing emerging opportunities such as the growth of the co-working space market, the increasing demand for ergonomic furniture, and the rise of sustainable and eco-friendly office furniture.)
Leading Players in the UK Office Furniture Industry Market
- Tangent Office Furniture
- SteelCase
- Verve Workspace
- Flexiform Office Furniture
- Herman Miller
- Verco Office Furniture
- Lee & Plumpton
- The Frem Group
- Margolis Furniture
- Knoll
- Metric Office Furniture
- HumanScale
- Urban Office
Key Developments in UK Office Furniture Industry
- May 2022: Steelcase Inc. acquired Halcon for USD 127.5 million.
- 2022: Steelcase Inc. reported first-quarter revenue of USD 740.7 million, a net loss of USD 11.4 million, and an adjusted loss per share of USD 0.05.
- 2022: Herman Miller launched the Zeph Chair in collaboration with Studio 7.5.
Future Outlook for UK Office Furniture Industry Market
This section summarizes the future potential of the UK office furniture market, highlighting growth accelerators and strategic opportunities. The report projects continued growth driven by factors such as the increasing demand for flexible and adaptable workspace solutions, advancements in ergonomic design, and a growing focus on sustainability. Strategic opportunities exist for companies that can effectively integrate technology, offer customized solutions, and cater to the evolving needs of modern workplaces.
(This section will contain approximately 150 words detailing the future outlook for the industry, including growth projections and strategic recommendations.)
UK Office Furniture Industry Segmentation
-
1. Type
- 1.1. Seating
- 1.2. Tables
- 1.3. Storage
- 1.4. Other Office Furniture
-
2. Distribution Channel
- 2.1. Home Centers
- 2.2. Flagship Stores
- 2.3. Specialty Stores
- 2.4. Online Stores
- 2.5. Other Distribution Channels
UK Office Furniture Industry Segmentation By Geography
-
1. North America
- 1.1. United States
- 1.2. Canada
- 1.3. Mexico
-
2. South America
- 2.1. Brazil
- 2.2. Argentina
- 2.3. Rest of South America
-
3. Europe
- 3.1. United Kingdom
- 3.2. Germany
- 3.3. France
- 3.4. Italy
- 3.5. Spain
- 3.6. Russia
- 3.7. Benelux
- 3.8. Nordics
- 3.9. Rest of Europe
-
4. Middle East & Africa
- 4.1. Turkey
- 4.2. Israel
- 4.3. GCC
- 4.4. North Africa
- 4.5. South Africa
- 4.6. Rest of Middle East & Africa
-
5. Asia Pacific
- 5.1. China
- 5.2. India
- 5.3. Japan
- 5.4. South Korea
- 5.5. ASEAN
- 5.6. Oceania
- 5.7. Rest of Asia Pacific
UK Office Furniture Industry REPORT HIGHLIGHTS
| Aspects | Details |
|---|---|
| Study Period | 2019-2033 |
| Base Year | 2024 |
| Estimated Year | 2025 |
| Forecast Period | 2025-2033 |
| Historical Period | 2019-2024 |
| Growth Rate | CAGR of 2.78% from 2019-2033 |
| Segmentation |
|
Table of Contents
- 1. Introduction
- 1.1. Research Scope
- 1.2. Market Segmentation
- 1.3. Research Methodology
- 1.4. Definitions and Assumptions
- 2. Executive Summary
- 2.1. Introduction
- 3. Market Dynamics
- 3.1. Introduction
- 3.2. Market Drivers
- 3.2.1. Tech-Integrated Furniture are Helping to Grow the Market
- 3.3. Market Restrains
- 3.3.1. Raw Material Cost Barrier to Growth
- 3.4. Market Trends
- 3.4.1. Growing Flexible Office Spaces in the Country
- 4. Market Factor Analysis
- 4.1. Porters Five Forces
- 4.2. Supply/Value Chain
- 4.3. PESTEL analysis
- 4.4. Market Entropy
- 4.5. Patent/Trademark Analysis
- 5. Global UK Office Furniture Industry Analysis, Insights and Forecast, 2019-2031
- 5.1. Market Analysis, Insights and Forecast - by Type
- 5.1.1. Seating
- 5.1.2. Tables
- 5.1.3. Storage
- 5.1.4. Other Office Furniture
- 5.2. Market Analysis, Insights and Forecast - by Distribution Channel
- 5.2.1. Home Centers
- 5.2.2. Flagship Stores
- 5.2.3. Specialty Stores
- 5.2.4. Online Stores
- 5.2.5. Other Distribution Channels
- 5.3. Market Analysis, Insights and Forecast - by Region
- 5.3.1. North America
- 5.3.2. South America
- 5.3.3. Europe
- 5.3.4. Middle East & Africa
- 5.3.5. Asia Pacific
- 5.1. Market Analysis, Insights and Forecast - by Type
- 6. North America UK Office Furniture Industry Analysis, Insights and Forecast, 2019-2031
- 6.1. Market Analysis, Insights and Forecast - by Type
- 6.1.1. Seating
- 6.1.2. Tables
- 6.1.3. Storage
- 6.1.4. Other Office Furniture
- 6.2. Market Analysis, Insights and Forecast - by Distribution Channel
- 6.2.1. Home Centers
- 6.2.2. Flagship Stores
- 6.2.3. Specialty Stores
- 6.2.4. Online Stores
- 6.2.5. Other Distribution Channels
- 6.1. Market Analysis, Insights and Forecast - by Type
- 7. South America UK Office Furniture Industry Analysis, Insights and Forecast, 2019-2031
- 7.1. Market Analysis, Insights and Forecast - by Type
- 7.1.1. Seating
- 7.1.2. Tables
- 7.1.3. Storage
- 7.1.4. Other Office Furniture
- 7.2. Market Analysis, Insights and Forecast - by Distribution Channel
- 7.2.1. Home Centers
- 7.2.2. Flagship Stores
- 7.2.3. Specialty Stores
- 7.2.4. Online Stores
- 7.2.5. Other Distribution Channels
- 7.1. Market Analysis, Insights and Forecast - by Type
- 8. Europe UK Office Furniture Industry Analysis, Insights and Forecast, 2019-2031
- 8.1. Market Analysis, Insights and Forecast - by Type
- 8.1.1. Seating
- 8.1.2. Tables
- 8.1.3. Storage
- 8.1.4. Other Office Furniture
- 8.2. Market Analysis, Insights and Forecast - by Distribution Channel
- 8.2.1. Home Centers
- 8.2.2. Flagship Stores
- 8.2.3. Specialty Stores
- 8.2.4. Online Stores
- 8.2.5. Other Distribution Channels
- 8.1. Market Analysis, Insights and Forecast - by Type
- 9. Middle East & Africa UK Office Furniture Industry Analysis, Insights and Forecast, 2019-2031
- 9.1. Market Analysis, Insights and Forecast - by Type
- 9.1.1. Seating
- 9.1.2. Tables
- 9.1.3. Storage
- 9.1.4. Other Office Furniture
- 9.2. Market Analysis, Insights and Forecast - by Distribution Channel
- 9.2.1. Home Centers
- 9.2.2. Flagship Stores
- 9.2.3. Specialty Stores
- 9.2.4. Online Stores
- 9.2.5. Other Distribution Channels
- 9.1. Market Analysis, Insights and Forecast - by Type
- 10. Asia Pacific UK Office Furniture Industry Analysis, Insights and Forecast, 2019-2031
- 10.1. Market Analysis, Insights and Forecast - by Type
- 10.1.1. Seating
- 10.1.2. Tables
- 10.1.3. Storage
- 10.1.4. Other Office Furniture
- 10.2. Market Analysis, Insights and Forecast - by Distribution Channel
- 10.2.1. Home Centers
- 10.2.2. Flagship Stores
- 10.2.3. Specialty Stores
- 10.2.4. Online Stores
- 10.2.5. Other Distribution Channels
- 10.1. Market Analysis, Insights and Forecast - by Type
- 11. England UK Office Furniture Industry Analysis, Insights and Forecast, 2019-2031
- 12. Wales UK Office Furniture Industry Analysis, Insights and Forecast, 2019-2031
- 13. Scotland UK Office Furniture Industry Analysis, Insights and Forecast, 2019-2031
- 14. Northern UK Office Furniture Industry Analysis, Insights and Forecast, 2019-2031
- 15. Ireland UK Office Furniture Industry Analysis, Insights and Forecast, 2019-2031
- 16. Competitive Analysis
- 16.1. Global Market Share Analysis 2024
- 16.2. Company Profiles
- 16.2.1 Tangent Office Furniture
- 16.2.1.1. Overview
- 16.2.1.2. Products
- 16.2.1.3. SWOT Analysis
- 16.2.1.4. Recent Developments
- 16.2.1.5. Financials (Based on Availability)
- 16.2.2 SteelCase
- 16.2.2.1. Overview
- 16.2.2.2. Products
- 16.2.2.3. SWOT Analysis
- 16.2.2.4. Recent Developments
- 16.2.2.5. Financials (Based on Availability)
- 16.2.3 Verve Workspace
- 16.2.3.1. Overview
- 16.2.3.2. Products
- 16.2.3.3. SWOT Analysis
- 16.2.3.4. Recent Developments
- 16.2.3.5. Financials (Based on Availability)
- 16.2.4 Flexiform Office Furniture
- 16.2.4.1. Overview
- 16.2.4.2. Products
- 16.2.4.3. SWOT Analysis
- 16.2.4.4. Recent Developments
- 16.2.4.5. Financials (Based on Availability)
- 16.2.5 Herman Miller
- 16.2.5.1. Overview
- 16.2.5.2. Products
- 16.2.5.3. SWOT Analysis
- 16.2.5.4. Recent Developments
- 16.2.5.5. Financials (Based on Availability)
- 16.2.6 Verco Office Furniture
- 16.2.6.1. Overview
- 16.2.6.2. Products
- 16.2.6.3. SWOT Analysis
- 16.2.6.4. Recent Developments
- 16.2.6.5. Financials (Based on Availability)
- 16.2.7 Lee & Plumpton
- 16.2.7.1. Overview
- 16.2.7.2. Products
- 16.2.7.3. SWOT Analysis
- 16.2.7.4. Recent Developments
- 16.2.7.5. Financials (Based on Availability)
- 16.2.8 The Frem Group
- 16.2.8.1. Overview
- 16.2.8.2. Products
- 16.2.8.3. SWOT Analysis
- 16.2.8.4. Recent Developments
- 16.2.8.5. Financials (Based on Availability)
- 16.2.9 Margolis Furniture
- 16.2.9.1. Overview
- 16.2.9.2. Products
- 16.2.9.3. SWOT Analysis
- 16.2.9.4. Recent Developments
- 16.2.9.5. Financials (Based on Availability)
- 16.2.10 Knoll
- 16.2.10.1. Overview
- 16.2.10.2. Products
- 16.2.10.3. SWOT Analysis
- 16.2.10.4. Recent Developments
- 16.2.10.5. Financials (Based on Availability)
- 16.2.11 Metric Office Furniture
- 16.2.11.1. Overview
- 16.2.11.2. Products
- 16.2.11.3. SWOT Analysis
- 16.2.11.4. Recent Developments
- 16.2.11.5. Financials (Based on Availability)
- 16.2.12 HumanScale
- 16.2.12.1. Overview
- 16.2.12.2. Products
- 16.2.12.3. SWOT Analysis
- 16.2.12.4. Recent Developments
- 16.2.12.5. Financials (Based on Availability)
- 16.2.13 Urban Office
- 16.2.13.1. Overview
- 16.2.13.2. Products
- 16.2.13.3. SWOT Analysis
- 16.2.13.4. Recent Developments
- 16.2.13.5. Financials (Based on Availability)
- 16.2.1 Tangent Office Furniture
List of Figures
- Figure 1: Global UK Office Furniture Industry Revenue Breakdown (Million, %) by Region 2024 & 2032
- Figure 2: Global UK Office Furniture Industry Volume Breakdown (K Unit, %) by Region 2024 & 2032
- Figure 3: United kingdom Region UK Office Furniture Industry Revenue (Million), by Country 2024 & 2032
- Figure 4: United kingdom Region UK Office Furniture Industry Volume (K Unit), by Country 2024 & 2032
- Figure 5: United kingdom Region UK Office Furniture Industry Revenue Share (%), by Country 2024 & 2032
- Figure 6: United kingdom Region UK Office Furniture Industry Volume Share (%), by Country 2024 & 2032
- Figure 7: North America UK Office Furniture Industry Revenue (Million), by Type 2024 & 2032
- Figure 8: North America UK Office Furniture Industry Volume (K Unit), by Type 2024 & 2032
- Figure 9: North America UK Office Furniture Industry Revenue Share (%), by Type 2024 & 2032
- Figure 10: North America UK Office Furniture Industry Volume Share (%), by Type 2024 & 2032
- Figure 11: North America UK Office Furniture Industry Revenue (Million), by Distribution Channel 2024 & 2032
- Figure 12: North America UK Office Furniture Industry Volume (K Unit), by Distribution Channel 2024 & 2032
- Figure 13: North America UK Office Furniture Industry Revenue Share (%), by Distribution Channel 2024 & 2032
- Figure 14: North America UK Office Furniture Industry Volume Share (%), by Distribution Channel 2024 & 2032
- Figure 15: North America UK Office Furniture Industry Revenue (Million), by Country 2024 & 2032
- Figure 16: North America UK Office Furniture Industry Volume (K Unit), by Country 2024 & 2032
- Figure 17: North America UK Office Furniture Industry Revenue Share (%), by Country 2024 & 2032
- Figure 18: North America UK Office Furniture Industry Volume Share (%), by Country 2024 & 2032
- Figure 19: South America UK Office Furniture Industry Revenue (Million), by Type 2024 & 2032
- Figure 20: South America UK Office Furniture Industry Volume (K Unit), by Type 2024 & 2032
- Figure 21: South America UK Office Furniture Industry Revenue Share (%), by Type 2024 & 2032
- Figure 22: South America UK Office Furniture Industry Volume Share (%), by Type 2024 & 2032
- Figure 23: South America UK Office Furniture Industry Revenue (Million), by Distribution Channel 2024 & 2032
- Figure 24: South America UK Office Furniture Industry Volume (K Unit), by Distribution Channel 2024 & 2032
- Figure 25: South America UK Office Furniture Industry Revenue Share (%), by Distribution Channel 2024 & 2032
- Figure 26: South America UK Office Furniture Industry Volume Share (%), by Distribution Channel 2024 & 2032
- Figure 27: South America UK Office Furniture Industry Revenue (Million), by Country 2024 & 2032
- Figure 28: South America UK Office Furniture Industry Volume (K Unit), by Country 2024 & 2032
- Figure 29: South America UK Office Furniture Industry Revenue Share (%), by Country 2024 & 2032
- Figure 30: South America UK Office Furniture Industry Volume Share (%), by Country 2024 & 2032
- Figure 31: Europe UK Office Furniture Industry Revenue (Million), by Type 2024 & 2032
- Figure 32: Europe UK Office Furniture Industry Volume (K Unit), by Type 2024 & 2032
- Figure 33: Europe UK Office Furniture Industry Revenue Share (%), by Type 2024 & 2032
- Figure 34: Europe UK Office Furniture Industry Volume Share (%), by Type 2024 & 2032
- Figure 35: Europe UK Office Furniture Industry Revenue (Million), by Distribution Channel 2024 & 2032
- Figure 36: Europe UK Office Furniture Industry Volume (K Unit), by Distribution Channel 2024 & 2032
- Figure 37: Europe UK Office Furniture Industry Revenue Share (%), by Distribution Channel 2024 & 2032
- Figure 38: Europe UK Office Furniture Industry Volume Share (%), by Distribution Channel 2024 & 2032
- Figure 39: Europe UK Office Furniture Industry Revenue (Million), by Country 2024 & 2032
- Figure 40: Europe UK Office Furniture Industry Volume (K Unit), by Country 2024 & 2032
- Figure 41: Europe UK Office Furniture Industry Revenue Share (%), by Country 2024 & 2032
- Figure 42: Europe UK Office Furniture Industry Volume Share (%), by Country 2024 & 2032
- Figure 43: Middle East & Africa UK Office Furniture Industry Revenue (Million), by Type 2024 & 2032
- Figure 44: Middle East & Africa UK Office Furniture Industry Volume (K Unit), by Type 2024 & 2032
- Figure 45: Middle East & Africa UK Office Furniture Industry Revenue Share (%), by Type 2024 & 2032
- Figure 46: Middle East & Africa UK Office Furniture Industry Volume Share (%), by Type 2024 & 2032
- Figure 47: Middle East & Africa UK Office Furniture Industry Revenue (Million), by Distribution Channel 2024 & 2032
- Figure 48: Middle East & Africa UK Office Furniture Industry Volume (K Unit), by Distribution Channel 2024 & 2032
- Figure 49: Middle East & Africa UK Office Furniture Industry Revenue Share (%), by Distribution Channel 2024 & 2032
- Figure 50: Middle East & Africa UK Office Furniture Industry Volume Share (%), by Distribution Channel 2024 & 2032
- Figure 51: Middle East & Africa UK Office Furniture Industry Revenue (Million), by Country 2024 & 2032
- Figure 52: Middle East & Africa UK Office Furniture Industry Volume (K Unit), by Country 2024 & 2032
- Figure 53: Middle East & Africa UK Office Furniture Industry Revenue Share (%), by Country 2024 & 2032
- Figure 54: Middle East & Africa UK Office Furniture Industry Volume Share (%), by Country 2024 & 2032
- Figure 55: Asia Pacific UK Office Furniture Industry Revenue (Million), by Type 2024 & 2032
- Figure 56: Asia Pacific UK Office Furniture Industry Volume (K Unit), by Type 2024 & 2032
- Figure 57: Asia Pacific UK Office Furniture Industry Revenue Share (%), by Type 2024 & 2032
- Figure 58: Asia Pacific UK Office Furniture Industry Volume Share (%), by Type 2024 & 2032
- Figure 59: Asia Pacific UK Office Furniture Industry Revenue (Million), by Distribution Channel 2024 & 2032
- Figure 60: Asia Pacific UK Office Furniture Industry Volume (K Unit), by Distribution Channel 2024 & 2032
- Figure 61: Asia Pacific UK Office Furniture Industry Revenue Share (%), by Distribution Channel 2024 & 2032
- Figure 62: Asia Pacific UK Office Furniture Industry Volume Share (%), by Distribution Channel 2024 & 2032
- Figure 63: Asia Pacific UK Office Furniture Industry Revenue (Million), by Country 2024 & 2032
- Figure 64: Asia Pacific UK Office Furniture Industry Volume (K Unit), by Country 2024 & 2032
- Figure 65: Asia Pacific UK Office Furniture Industry Revenue Share (%), by Country 2024 & 2032
- Figure 66: Asia Pacific UK Office Furniture Industry Volume Share (%), by Country 2024 & 2032
List of Tables
- Table 1: Global UK Office Furniture Industry Revenue Million Forecast, by Region 2019 & 2032
- Table 2: Global UK Office Furniture Industry Volume K Unit Forecast, by Region 2019 & 2032
- Table 3: Global UK Office Furniture Industry Revenue Million Forecast, by Type 2019 & 2032
- Table 4: Global UK Office Furniture Industry Volume K Unit Forecast, by Type 2019 & 2032
- Table 5: Global UK Office Furniture Industry Revenue Million Forecast, by Distribution Channel 2019 & 2032
- Table 6: Global UK Office Furniture Industry Volume K Unit Forecast, by Distribution Channel 2019 & 2032
- Table 7: Global UK Office Furniture Industry Revenue Million Forecast, by Region 2019 & 2032
- Table 8: Global UK Office Furniture Industry Volume K Unit Forecast, by Region 2019 & 2032
- Table 9: Global UK Office Furniture Industry Revenue Million Forecast, by Country 2019 & 2032
- Table 10: Global UK Office Furniture Industry Volume K Unit Forecast, by Country 2019 & 2032
- Table 11: England UK Office Furniture Industry Revenue (Million) Forecast, by Application 2019 & 2032
- Table 12: England UK Office Furniture Industry Volume (K Unit) Forecast, by Application 2019 & 2032
- Table 13: Wales UK Office Furniture Industry Revenue (Million) Forecast, by Application 2019 & 2032
- Table 14: Wales UK Office Furniture Industry Volume (K Unit) Forecast, by Application 2019 & 2032
- Table 15: Scotland UK Office Furniture Industry Revenue (Million) Forecast, by Application 2019 & 2032
- Table 16: Scotland UK Office Furniture Industry Volume (K Unit) Forecast, by Application 2019 & 2032
- Table 17: Northern UK Office Furniture Industry Revenue (Million) Forecast, by Application 2019 & 2032
- Table 18: Northern UK Office Furniture Industry Volume (K Unit) Forecast, by Application 2019 & 2032
- Table 19: Ireland UK Office Furniture Industry Revenue (Million) Forecast, by Application 2019 & 2032
- Table 20: Ireland UK Office Furniture Industry Volume (K Unit) Forecast, by Application 2019 & 2032
- Table 21: Global UK Office Furniture Industry Revenue Million Forecast, by Type 2019 & 2032
- Table 22: Global UK Office Furniture Industry Volume K Unit Forecast, by Type 2019 & 2032
- Table 23: Global UK Office Furniture Industry Revenue Million Forecast, by Distribution Channel 2019 & 2032
- Table 24: Global UK Office Furniture Industry Volume K Unit Forecast, by Distribution Channel 2019 & 2032
- Table 25: Global UK Office Furniture Industry Revenue Million Forecast, by Country 2019 & 2032
- Table 26: Global UK Office Furniture Industry Volume K Unit Forecast, by Country 2019 & 2032
- Table 27: United States UK Office Furniture Industry Revenue (Million) Forecast, by Application 2019 & 2032
- Table 28: United States UK Office Furniture Industry Volume (K Unit) Forecast, by Application 2019 & 2032
- Table 29: Canada UK Office Furniture Industry Revenue (Million) Forecast, by Application 2019 & 2032
- Table 30: Canada UK Office Furniture Industry Volume (K Unit) Forecast, by Application 2019 & 2032
- Table 31: Mexico UK Office Furniture Industry Revenue (Million) Forecast, by Application 2019 & 2032
- Table 32: Mexico UK Office Furniture Industry Volume (K Unit) Forecast, by Application 2019 & 2032
- Table 33: Global UK Office Furniture Industry Revenue Million Forecast, by Type 2019 & 2032
- Table 34: Global UK Office Furniture Industry Volume K Unit Forecast, by Type 2019 & 2032
- Table 35: Global UK Office Furniture Industry Revenue Million Forecast, by Distribution Channel 2019 & 2032
- Table 36: Global UK Office Furniture Industry Volume K Unit Forecast, by Distribution Channel 2019 & 2032
- Table 37: Global UK Office Furniture Industry Revenue Million Forecast, by Country 2019 & 2032
- Table 38: Global UK Office Furniture Industry Volume K Unit Forecast, by Country 2019 & 2032
- Table 39: Brazil UK Office Furniture Industry Revenue (Million) Forecast, by Application 2019 & 2032
- Table 40: Brazil UK Office Furniture Industry Volume (K Unit) Forecast, by Application 2019 & 2032
- Table 41: Argentina UK Office Furniture Industry Revenue (Million) Forecast, by Application 2019 & 2032
- Table 42: Argentina UK Office Furniture Industry Volume (K Unit) Forecast, by Application 2019 & 2032
- Table 43: Rest of South America UK Office Furniture Industry Revenue (Million) Forecast, by Application 2019 & 2032
- Table 44: Rest of South America UK Office Furniture Industry Volume (K Unit) Forecast, by Application 2019 & 2032
- Table 45: Global UK Office Furniture Industry Revenue Million Forecast, by Type 2019 & 2032
- Table 46: Global UK Office Furniture Industry Volume K Unit Forecast, by Type 2019 & 2032
- Table 47: Global UK Office Furniture Industry Revenue Million Forecast, by Distribution Channel 2019 & 2032
- Table 48: Global UK Office Furniture Industry Volume K Unit Forecast, by Distribution Channel 2019 & 2032
- Table 49: Global UK Office Furniture Industry Revenue Million Forecast, by Country 2019 & 2032
- Table 50: Global UK Office Furniture Industry Volume K Unit Forecast, by Country 2019 & 2032
- Table 51: United Kingdom UK Office Furniture Industry Revenue (Million) Forecast, by Application 2019 & 2032
- Table 52: United Kingdom UK Office Furniture Industry Volume (K Unit) Forecast, by Application 2019 & 2032
- Table 53: Germany UK Office Furniture Industry Revenue (Million) Forecast, by Application 2019 & 2032
- Table 54: Germany UK Office Furniture Industry Volume (K Unit) Forecast, by Application 2019 & 2032
- Table 55: France UK Office Furniture Industry Revenue (Million) Forecast, by Application 2019 & 2032
- Table 56: France UK Office Furniture Industry Volume (K Unit) Forecast, by Application 2019 & 2032
- Table 57: Italy UK Office Furniture Industry Revenue (Million) Forecast, by Application 2019 & 2032
- Table 58: Italy UK Office Furniture Industry Volume (K Unit) Forecast, by Application 2019 & 2032
- Table 59: Spain UK Office Furniture Industry Revenue (Million) Forecast, by Application 2019 & 2032
- Table 60: Spain UK Office Furniture Industry Volume (K Unit) Forecast, by Application 2019 & 2032
- Table 61: Russia UK Office Furniture Industry Revenue (Million) Forecast, by Application 2019 & 2032
- Table 62: Russia UK Office Furniture Industry Volume (K Unit) Forecast, by Application 2019 & 2032
- Table 63: Benelux UK Office Furniture Industry Revenue (Million) Forecast, by Application 2019 & 2032
- Table 64: Benelux UK Office Furniture Industry Volume (K Unit) Forecast, by Application 2019 & 2032
- Table 65: Nordics UK Office Furniture Industry Revenue (Million) Forecast, by Application 2019 & 2032
- Table 66: Nordics UK Office Furniture Industry Volume (K Unit) Forecast, by Application 2019 & 2032
- Table 67: Rest of Europe UK Office Furniture Industry Revenue (Million) Forecast, by Application 2019 & 2032
- Table 68: Rest of Europe UK Office Furniture Industry Volume (K Unit) Forecast, by Application 2019 & 2032
- Table 69: Global UK Office Furniture Industry Revenue Million Forecast, by Type 2019 & 2032
- Table 70: Global UK Office Furniture Industry Volume K Unit Forecast, by Type 2019 & 2032
- Table 71: Global UK Office Furniture Industry Revenue Million Forecast, by Distribution Channel 2019 & 2032
- Table 72: Global UK Office Furniture Industry Volume K Unit Forecast, by Distribution Channel 2019 & 2032
- Table 73: Global UK Office Furniture Industry Revenue Million Forecast, by Country 2019 & 2032
- Table 74: Global UK Office Furniture Industry Volume K Unit Forecast, by Country 2019 & 2032
- Table 75: Turkey UK Office Furniture Industry Revenue (Million) Forecast, by Application 2019 & 2032
- Table 76: Turkey UK Office Furniture Industry Volume (K Unit) Forecast, by Application 2019 & 2032
- Table 77: Israel UK Office Furniture Industry Revenue (Million) Forecast, by Application 2019 & 2032
- Table 78: Israel UK Office Furniture Industry Volume (K Unit) Forecast, by Application 2019 & 2032
- Table 79: GCC UK Office Furniture Industry Revenue (Million) Forecast, by Application 2019 & 2032
- Table 80: GCC UK Office Furniture Industry Volume (K Unit) Forecast, by Application 2019 & 2032
- Table 81: North Africa UK Office Furniture Industry Revenue (Million) Forecast, by Application 2019 & 2032
- Table 82: North Africa UK Office Furniture Industry Volume (K Unit) Forecast, by Application 2019 & 2032
- Table 83: South Africa UK Office Furniture Industry Revenue (Million) Forecast, by Application 2019 & 2032
- Table 84: South Africa UK Office Furniture Industry Volume (K Unit) Forecast, by Application 2019 & 2032
- Table 85: Rest of Middle East & Africa UK Office Furniture Industry Revenue (Million) Forecast, by Application 2019 & 2032
- Table 86: Rest of Middle East & Africa UK Office Furniture Industry Volume (K Unit) Forecast, by Application 2019 & 2032
- Table 87: Global UK Office Furniture Industry Revenue Million Forecast, by Type 2019 & 2032
- Table 88: Global UK Office Furniture Industry Volume K Unit Forecast, by Type 2019 & 2032
- Table 89: Global UK Office Furniture Industry Revenue Million Forecast, by Distribution Channel 2019 & 2032
- Table 90: Global UK Office Furniture Industry Volume K Unit Forecast, by Distribution Channel 2019 & 2032
- Table 91: Global UK Office Furniture Industry Revenue Million Forecast, by Country 2019 & 2032
- Table 92: Global UK Office Furniture Industry Volume K Unit Forecast, by Country 2019 & 2032
- Table 93: China UK Office Furniture Industry Revenue (Million) Forecast, by Application 2019 & 2032
- Table 94: China UK Office Furniture Industry Volume (K Unit) Forecast, by Application 2019 & 2032
- Table 95: India UK Office Furniture Industry Revenue (Million) Forecast, by Application 2019 & 2032
- Table 96: India UK Office Furniture Industry Volume (K Unit) Forecast, by Application 2019 & 2032
- Table 97: Japan UK Office Furniture Industry Revenue (Million) Forecast, by Application 2019 & 2032
- Table 98: Japan UK Office Furniture Industry Volume (K Unit) Forecast, by Application 2019 & 2032
- Table 99: South Korea UK Office Furniture Industry Revenue (Million) Forecast, by Application 2019 & 2032
- Table 100: South Korea UK Office Furniture Industry Volume (K Unit) Forecast, by Application 2019 & 2032
- Table 101: ASEAN UK Office Furniture Industry Revenue (Million) Forecast, by Application 2019 & 2032
- Table 102: ASEAN UK Office Furniture Industry Volume (K Unit) Forecast, by Application 2019 & 2032
- Table 103: Oceania UK Office Furniture Industry Revenue (Million) Forecast, by Application 2019 & 2032
- Table 104: Oceania UK Office Furniture Industry Volume (K Unit) Forecast, by Application 2019 & 2032
- Table 105: Rest of Asia Pacific UK Office Furniture Industry Revenue (Million) Forecast, by Application 2019 & 2032
- Table 106: Rest of Asia Pacific UK Office Furniture Industry Volume (K Unit) Forecast, by Application 2019 & 2032
Frequently Asked Questions
1. What is the projected Compound Annual Growth Rate (CAGR) of the UK Office Furniture Industry?
The projected CAGR is approximately 2.78%.
2. Which companies are prominent players in the UK Office Furniture Industry?
Key companies in the market include Tangent Office Furniture, SteelCase, Verve Workspace, Flexiform Office Furniture, Herman Miller, Verco Office Furniture, Lee & Plumpton, The Frem Group, Margolis Furniture, Knoll, Metric Office Furniture, HumanScale, Urban Office.
3. What are the main segments of the UK Office Furniture Industry?
The market segments include Type, Distribution Channel.
4. Can you provide details about the market size?
The market size is estimated to be USD 5.21 Million as of 2022.
5. What are some drivers contributing to market growth?
Tech-Integrated Furniture are Helping to Grow the Market.
6. What are the notable trends driving market growth?
Growing Flexible Office Spaces in the Country.
7. Are there any restraints impacting market growth?
Raw Material Cost Barrier to Growth.
8. Can you provide examples of recent developments in the market?
In 2022, Steelcase Inc. reported first-quarter revenue of USD 740.7 million, a net loss of USD 11.4 million, and an adjusted loss per share of USD 0.05. Steelcase Inc. acquired Halcon, a Minnesota-based designer and manufacturer of tailored wood furniture for the workplace, for USD 127.5 million in May 2022.
9. What pricing options are available for accessing the report?
Pricing options include single-user, multi-user, and enterprise licenses priced at USD 3800, USD 4500, and USD 5800 respectively.
10. Is the market size provided in terms of value or volume?
The market size is provided in terms of value, measured in Million and volume, measured in K Unit.
11. Are there any specific market keywords associated with the report?
Yes, the market keyword associated with the report is "UK Office Furniture Industry," which aids in identifying and referencing the specific market segment covered.
12. How do I determine which pricing option suits my needs best?
The pricing options vary based on user requirements and access needs. Individual users may opt for single-user licenses, while businesses requiring broader access may choose multi-user or enterprise licenses for cost-effective access to the report.
13. Are there any additional resources or data provided in the UK Office Furniture Industry report?
While the report offers comprehensive insights, it's advisable to review the specific contents or supplementary materials provided to ascertain if additional resources or data are available.
14. How can I stay updated on further developments or reports in the UK Office Furniture Industry?
To stay informed about further developments, trends, and reports in the UK Office Furniture Industry, consider subscribing to industry newsletters, following relevant companies and organizations, or regularly checking reputable industry news sources and publications.
Methodology
Step 1 - Identification of Relevant Samples Size from Population Database


Step 2 - Approaches for Defining Global Market Size (Value, Volume* & Price*)

Note*: In applicable scenarios
Step 3 - Data Sources
Primary Research
- Web Analytics
- Survey Reports
- Research Institute
- Latest Research Reports
- Opinion Leaders
Secondary Research
- Annual Reports
- White Paper
- Latest Press Release
- Industry Association
- Paid Database
- Investor Presentations

Step 4 - Data Triangulation
Involves using different sources of information in order to increase the validity of a study
These sources are likely to be stakeholders in a program - participants, other researchers, program staff, other community members, and so on.
Then we put all data in single framework & apply various statistical tools to find out the dynamic on the market.
During the analysis stage, feedback from the stakeholder groups would be compared to determine areas of agreement as well as areas of divergence


