
Key Insights
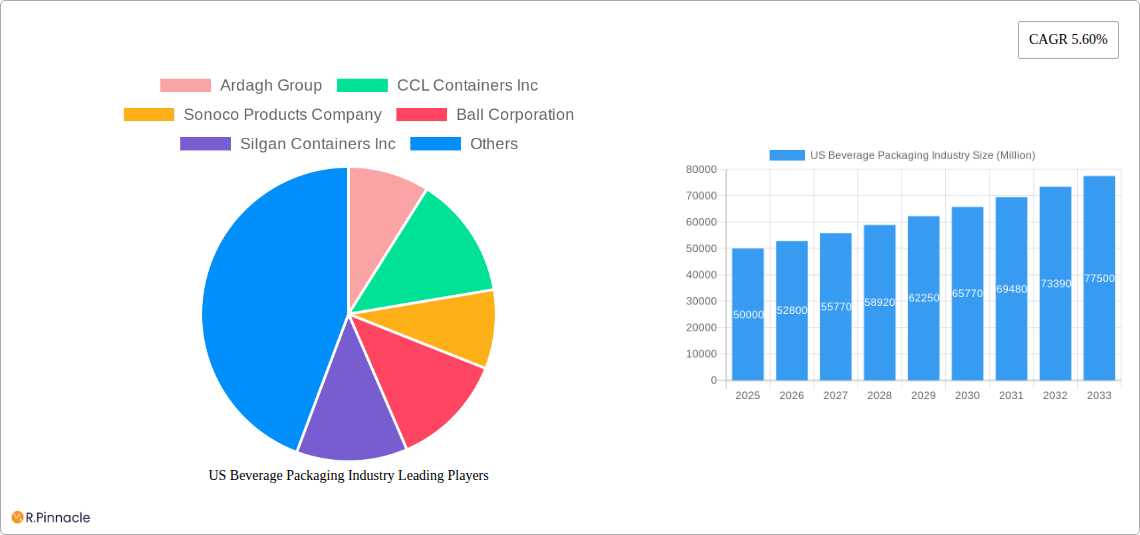
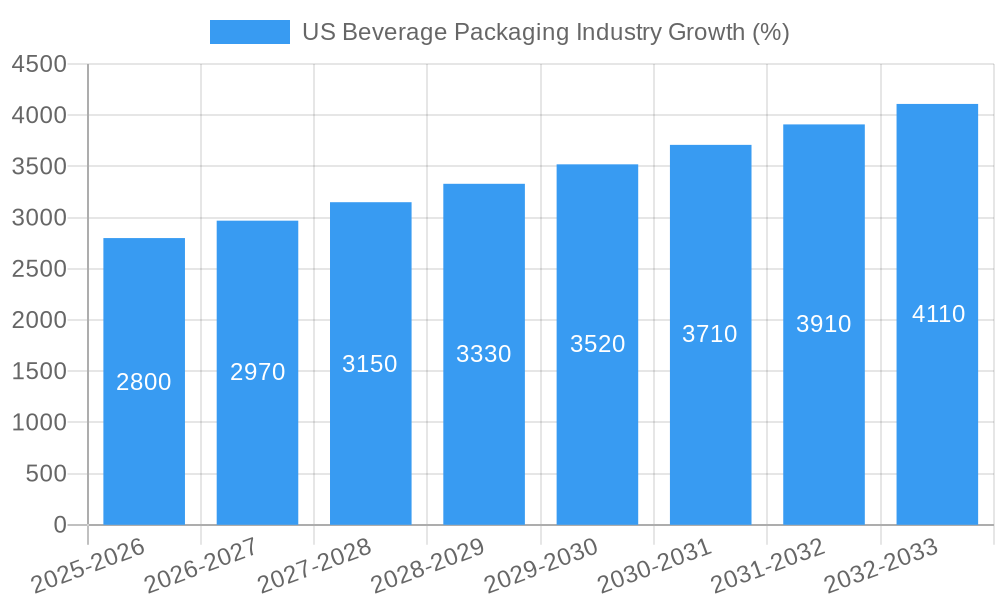
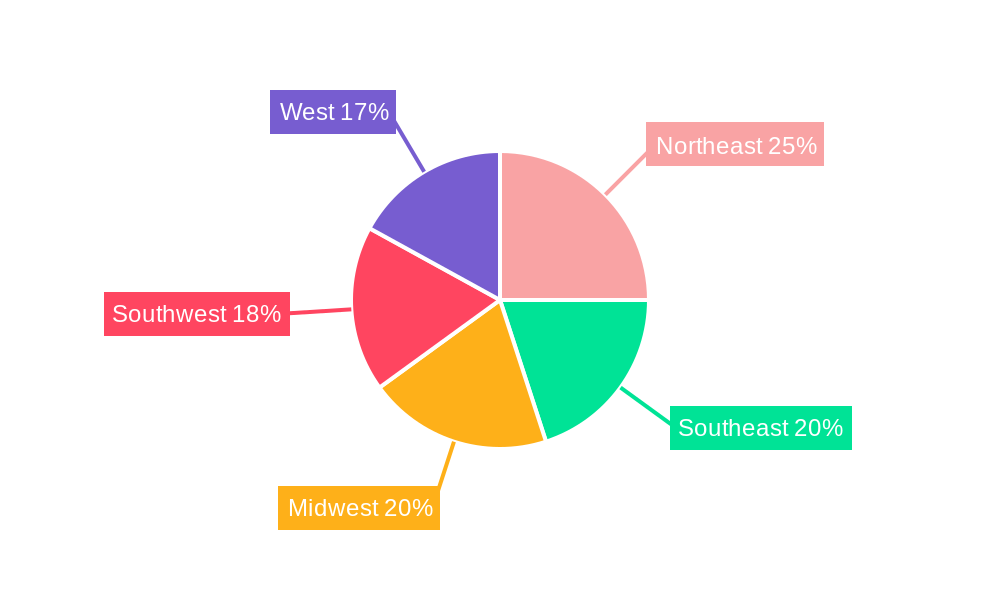
The US beverage packaging market, valued at approximately $50 billion in 2025, is poised for robust growth, exhibiting a compound annual growth rate (CAGR) of 5.60% from 2025 to 2033. This expansion is driven by several key factors. The rising demand for convenient and on-the-go beverage consumption fuels the need for diverse packaging formats, from lightweight plastic bottles ideal for individual servings to larger, reusable containers catering to household needs. Furthermore, increasing consumer awareness of sustainability is pushing the market towards eco-friendly solutions like recycled and biodegradable materials. Growth is further propelled by the thriving alcoholic beverage sector, specifically craft beers and premium spirits, which often utilize premium packaging to enhance brand image and appeal to discerning consumers. The market segmentation reflects these trends, with plastic, metal, and glass dominating material choices due to their established functionalities and relatively low cost. However, the growing interest in sustainability is gradually increasing the demand for paperboard and other eco-conscious options. Significant regional variations exist; the West and Northeast, due to their higher population density and consumer spending, are likely to contribute significantly to market growth.
Competition in the US beverage packaging market is fierce, with major players like Ardagh Group, Ball Corporation, and Amcor Limited constantly innovating to capture market share. These companies are investing heavily in research and development to create more sustainable and cost-effective packaging solutions. While the market faces challenges like fluctuating raw material prices and increasing regulations regarding plastic waste, the overall outlook remains optimistic. The industry's ability to adapt to evolving consumer preferences and environmental concerns, along with continuous technological advancements, will shape the future trajectory of the US beverage packaging market. The strategic focus on lightweighting, recyclability, and aesthetically appealing designs will remain pivotal to success in the coming years.
This comprehensive report provides a detailed analysis of the US beverage packaging industry, offering valuable insights for industry professionals, investors, and stakeholders. The study period covers 2019-2033, with a base year of 2025 and a forecast period of 2025-2033. The report leverages extensive data analysis and expert insights to offer a thorough understanding of market dynamics, trends, and future growth opportunities. Market size is presented in Millions throughout.
US Beverage Packaging Industry Market Structure & Innovation Trends
This section analyzes the competitive landscape of the US beverage packaging industry, exploring market concentration, innovation drivers, regulatory influences, and significant M&A activities. The report delves into the market share of key players such as Ardagh Group, CCL Containers Inc., Sonoco Products Company, Ball Corporation, Silgan Containers Inc., Amcor Limited, Berry Global Inc., Berlin Packaging, Westroc, Crown Holdings Inc., and Owens-Illinois Inc. We will examine the impact of regulatory frameworks on packaging materials, analyze the substitution of traditional materials with sustainable alternatives and assess the demographic shifts affecting consumer preferences. The report also includes a detailed analysis of M&A activity within the industry, including deal values and their implications for market structure. The overall market concentration is estimated at xx%, with the top five players holding a combined xx% market share in 2024. M&A activity from 2019-2024 totaled approximately $xx Million.
- Market Concentration: xx%
- Top 5 Players Market Share (2024): xx%
- M&A Activity (2019-2024): $xx Million
US Beverage Packaging Industry Market Dynamics & Trends
This section explores the key drivers and trends shaping the US beverage packaging market. We analyze market growth, technological disruptions such as the rise of sustainable packaging solutions and automation, shifting consumer preferences towards convenience and eco-friendly options, and the evolving competitive dynamics within the industry. The report projects a Compound Annual Growth Rate (CAGR) of xx% for the forecast period (2025-2033), driven by factors including the increasing demand for convenient packaging formats, growth in the beverage industry, and the rising adoption of sustainable packaging materials. Market penetration of sustainable packaging is expected to reach xx% by 2033.
Dominant Regions & Segments in US Beverage Packaging Industry
This section identifies the leading regions, countries, and market segments within the US beverage packaging industry. The analysis considers segmentation by material (plastic, metal, glass, paperboard), product type (bottles, cans, pouches, cartons, beer kegs), and application (alcoholic beverages, milk, energy drinks, other applications). The report identifies the dominant segments based on factors such as market size, growth rate, and key drivers specific to each segment.
Key Drivers by Segment:
- Metal: Driven by the growing demand for aluminum cans, particularly in the alcoholic beverages and energy drinks segments, due to their recyclability and lightweight properties. The Southwestern US expansion by Crown Holdings further solidifies this trend.
- Plastic: Growth is influenced by the cost-effectiveness of plastic packaging, although concerns about sustainability are impacting growth.
- Glass: The market for glass bottles is expected to maintain steady growth but faces competition from lighter and more convenient alternatives.
- Paperboard: Growth is driven by consumer demand for eco-friendly options and the suitability for cartons in various beverage applications.
Dominant Segments: The metal segment (primarily aluminum cans) is projected as the dominant segment due to growth in the alcoholic beverage sector. The energy drink segment is experiencing high growth within the metal category.
US Beverage Packaging Industry Product Innovations
This section highlights recent product innovations and technological advancements in the US beverage packaging market, focusing on materials, design, and functionality to meet evolving consumer needs and improve sustainability. Innovative packaging designs aim to enhance product shelf life, improve portability, and reduce environmental impact. The increasing adoption of lightweight materials and improved recycling technologies are driving significant innovations in the field.
Report Scope & Segmentation Analysis
This report provides a comprehensive analysis of the US beverage packaging market, segmented by material (plastic, metal, glass, paperboard), product type (bottles, cans, pouches, cartons, beer kegs), and application (alcoholic beverages, milk, energy drinks, other applications). Each segment's growth projections, market size, and competitive dynamics are meticulously analyzed, offering a granular understanding of the market landscape. For example, the metal segment is expected to dominate due to the rising popularity of aluminum cans, while the paperboard segment shows promise due to sustainability concerns.
Key Drivers of US Beverage Packaging Industry Growth
The growth of the US beverage packaging industry is driven by a combination of factors. Increased beverage consumption, particularly in the energy drinks and alcoholic beverages sectors, is a primary driver. Technological advancements enabling lighter, more sustainable, and more efficient packaging also fuel growth. Finally, favorable economic conditions and supportive regulatory frameworks contribute to the overall expansion of the market.
Challenges in the US Beverage Packaging Industry Sector
The US beverage packaging industry faces several challenges, including increasing raw material costs, fluctuations in the global supply chain, heightened competition, and stringent environmental regulations impacting packaging choices. These factors can lead to price increases, impacting profitability and potentially slowing growth. The industry is also grappling with meeting the growing demand for sustainable and eco-friendly packaging alternatives.
Emerging Opportunities in US Beverage Packaging Industry
The US beverage packaging industry presents several emerging opportunities. The rising demand for sustainable and eco-friendly packaging solutions opens up new avenues for innovation and growth. The increasing adoption of lightweight and smart packaging creates additional opportunities, while tapping into new beverage categories and expanding into emerging markets offers substantial potential.
Leading Players in the US Beverage Packaging Industry Market
- Ardagh Group
- CCL Containers Inc
- Sonoco Products Company
- Ball Corporation
- Silgan Containers Inc
- Amcor Limited
- Berry Global Inc
- Berlin Packaging
- Westroc
- Crown Holdings Inc
- Owens-Illinois Inc
Key Developments in US Beverage Packaging Industry Industry
- July 2021: Ball Corporation announced plans to significantly expand its manufacturing capacity with new facilities in the UK and Russia, driven by growing demand for aluminum cans.
- September 2021: Crown Holdings Inc. announced a new aluminum beverage can manufacturing facility in Mesquite, Nevada, to meet the increasing demand for beverage cans in the Southwestern US.
Future Outlook for US Beverage Packaging Industry Market
The future of the US beverage packaging industry looks promising, driven by continued growth in the beverage sector and increasing demand for sustainable and innovative packaging solutions. Strategic investments in advanced technologies, expansion into new markets, and a focus on sustainability will be key factors in shaping the industry's future success. The market is expected to experience steady growth, fueled by consumer demand and industry innovation.
US Beverage Packaging Industry Segmentation
-
1. Material
- 1.1. Plastic
- 1.2. Metal
- 1.3. Glass
- 1.4. Paperboard
-
2. Product Type
- 2.1. Bottles
- 2.2. Cans
- 2.3. Pouches
- 2.4. Cartons
- 2.5. Beer kegs
-
3. Application
- 3.1. Alcoholic Beverages
- 3.2. Milk
- 3.3. Energy Drinks
- 3.4. Other applications
US Beverage Packaging Industry Segmentation By Geography
-
1. North America
- 1.1. United States
- 1.2. Canada
- 1.3. Mexico
-
2. South America
- 2.1. Brazil
- 2.2. Argentina
- 2.3. Rest of South America
-
3. Europe
- 3.1. United Kingdom
- 3.2. Germany
- 3.3. France
- 3.4. Italy
- 3.5. Spain
- 3.6. Russia
- 3.7. Benelux
- 3.8. Nordics
- 3.9. Rest of Europe
-
4. Middle East & Africa
- 4.1. Turkey
- 4.2. Israel
- 4.3. GCC
- 4.4. North Africa
- 4.5. South Africa
- 4.6. Rest of Middle East & Africa
-
5. Asia Pacific
- 5.1. China
- 5.2. India
- 5.3. Japan
- 5.4. South Korea
- 5.5. ASEAN
- 5.6. Oceania
- 5.7. Rest of Asia Pacific
US Beverage Packaging Industry REPORT HIGHLIGHTS
| Aspects | Details |
|---|---|
| Study Period | 2019-2033 |
| Base Year | 2024 |
| Estimated Year | 2025 |
| Forecast Period | 2025-2033 |
| Historical Period | 2019-2024 |
| Growth Rate | CAGR of 5.60% from 2019-2033 |
| Segmentation |
|
Table of Contents
- 1. Introduction
- 1.1. Research Scope
- 1.2. Market Segmentation
- 1.3. Research Methodology
- 1.4. Definitions and Assumptions
- 2. Executive Summary
- 2.1. Introduction
- 3. Market Dynamics
- 3.1. Introduction
- 3.2. Market Drivers
- 3.2.1. Growing Demand for Bottled Beverages is Driving the Market in the Wine Industry; Increased Integration in the Premium Packaging Market Further Drives the Growth
- 3.3. Market Restrains
- 3.3.1. People's Attitude Towards Sustainable Forms of Packaging
- 3.4. Market Trends
- 3.4.1. Alcohol Beverages to hold significant market share
- 4. Market Factor Analysis
- 4.1. Porters Five Forces
- 4.2. Supply/Value Chain
- 4.3. PESTEL analysis
- 4.4. Market Entropy
- 4.5. Patent/Trademark Analysis
- 5. Global US Beverage Packaging Industry Analysis, Insights and Forecast, 2019-2031
- 5.1. Market Analysis, Insights and Forecast - by Material
- 5.1.1. Plastic
- 5.1.2. Metal
- 5.1.3. Glass
- 5.1.4. Paperboard
- 5.2. Market Analysis, Insights and Forecast - by Product Type
- 5.2.1. Bottles
- 5.2.2. Cans
- 5.2.3. Pouches
- 5.2.4. Cartons
- 5.2.5. Beer kegs
- 5.3. Market Analysis, Insights and Forecast - by Application
- 5.3.1. Alcoholic Beverages
- 5.3.2. Milk
- 5.3.3. Energy Drinks
- 5.3.4. Other applications
- 5.4. Market Analysis, Insights and Forecast - by Region
- 5.4.1. North America
- 5.4.2. South America
- 5.4.3. Europe
- 5.4.4. Middle East & Africa
- 5.4.5. Asia Pacific
- 5.1. Market Analysis, Insights and Forecast - by Material
- 6. North America US Beverage Packaging Industry Analysis, Insights and Forecast, 2019-2031
- 6.1. Market Analysis, Insights and Forecast - by Material
- 6.1.1. Plastic
- 6.1.2. Metal
- 6.1.3. Glass
- 6.1.4. Paperboard
- 6.2. Market Analysis, Insights and Forecast - by Product Type
- 6.2.1. Bottles
- 6.2.2. Cans
- 6.2.3. Pouches
- 6.2.4. Cartons
- 6.2.5. Beer kegs
- 6.3. Market Analysis, Insights and Forecast - by Application
- 6.3.1. Alcoholic Beverages
- 6.3.2. Milk
- 6.3.3. Energy Drinks
- 6.3.4. Other applications
- 6.1. Market Analysis, Insights and Forecast - by Material
- 7. South America US Beverage Packaging Industry Analysis, Insights and Forecast, 2019-2031
- 7.1. Market Analysis, Insights and Forecast - by Material
- 7.1.1. Plastic
- 7.1.2. Metal
- 7.1.3. Glass
- 7.1.4. Paperboard
- 7.2. Market Analysis, Insights and Forecast - by Product Type
- 7.2.1. Bottles
- 7.2.2. Cans
- 7.2.3. Pouches
- 7.2.4. Cartons
- 7.2.5. Beer kegs
- 7.3. Market Analysis, Insights and Forecast - by Application
- 7.3.1. Alcoholic Beverages
- 7.3.2. Milk
- 7.3.3. Energy Drinks
- 7.3.4. Other applications
- 7.1. Market Analysis, Insights and Forecast - by Material
- 8. Europe US Beverage Packaging Industry Analysis, Insights and Forecast, 2019-2031
- 8.1. Market Analysis, Insights and Forecast - by Material
- 8.1.1. Plastic
- 8.1.2. Metal
- 8.1.3. Glass
- 8.1.4. Paperboard
- 8.2. Market Analysis, Insights and Forecast - by Product Type
- 8.2.1. Bottles
- 8.2.2. Cans
- 8.2.3. Pouches
- 8.2.4. Cartons
- 8.2.5. Beer kegs
- 8.3. Market Analysis, Insights and Forecast - by Application
- 8.3.1. Alcoholic Beverages
- 8.3.2. Milk
- 8.3.3. Energy Drinks
- 8.3.4. Other applications
- 8.1. Market Analysis, Insights and Forecast - by Material
- 9. Middle East & Africa US Beverage Packaging Industry Analysis, Insights and Forecast, 2019-2031
- 9.1. Market Analysis, Insights and Forecast - by Material
- 9.1.1. Plastic
- 9.1.2. Metal
- 9.1.3. Glass
- 9.1.4. Paperboard
- 9.2. Market Analysis, Insights and Forecast - by Product Type
- 9.2.1. Bottles
- 9.2.2. Cans
- 9.2.3. Pouches
- 9.2.4. Cartons
- 9.2.5. Beer kegs
- 9.3. Market Analysis, Insights and Forecast - by Application
- 9.3.1. Alcoholic Beverages
- 9.3.2. Milk
- 9.3.3. Energy Drinks
- 9.3.4. Other applications
- 9.1. Market Analysis, Insights and Forecast - by Material
- 10. Asia Pacific US Beverage Packaging Industry Analysis, Insights and Forecast, 2019-2031
- 10.1. Market Analysis, Insights and Forecast - by Material
- 10.1.1. Plastic
- 10.1.2. Metal
- 10.1.3. Glass
- 10.1.4. Paperboard
- 10.2. Market Analysis, Insights and Forecast - by Product Type
- 10.2.1. Bottles
- 10.2.2. Cans
- 10.2.3. Pouches
- 10.2.4. Cartons
- 10.2.5. Beer kegs
- 10.3. Market Analysis, Insights and Forecast - by Application
- 10.3.1. Alcoholic Beverages
- 10.3.2. Milk
- 10.3.3. Energy Drinks
- 10.3.4. Other applications
- 10.1. Market Analysis, Insights and Forecast - by Material
- 11. Northeast US Beverage Packaging Industry Analysis, Insights and Forecast, 2019-2031
- 12. Southeast US Beverage Packaging Industry Analysis, Insights and Forecast, 2019-2031
- 13. Midwest US Beverage Packaging Industry Analysis, Insights and Forecast, 2019-2031
- 14. Southwest US Beverage Packaging Industry Analysis, Insights and Forecast, 2019-2031
- 15. West US Beverage Packaging Industry Analysis, Insights and Forecast, 2019-2031
- 16. Competitive Analysis
- 16.1. Global Market Share Analysis 2024
- 16.2. Company Profiles
- 16.2.1 Ardagh Group
- 16.2.1.1. Overview
- 16.2.1.2. Products
- 16.2.1.3. SWOT Analysis
- 16.2.1.4. Recent Developments
- 16.2.1.5. Financials (Based on Availability)
- 16.2.2 CCL Containers Inc
- 16.2.2.1. Overview
- 16.2.2.2. Products
- 16.2.2.3. SWOT Analysis
- 16.2.2.4. Recent Developments
- 16.2.2.5. Financials (Based on Availability)
- 16.2.3 Sonoco Products Company
- 16.2.3.1. Overview
- 16.2.3.2. Products
- 16.2.3.3. SWOT Analysis
- 16.2.3.4. Recent Developments
- 16.2.3.5. Financials (Based on Availability)
- 16.2.4 Ball Corporation
- 16.2.4.1. Overview
- 16.2.4.2. Products
- 16.2.4.3. SWOT Analysis
- 16.2.4.4. Recent Developments
- 16.2.4.5. Financials (Based on Availability)
- 16.2.5 Silgan Containers Inc
- 16.2.5.1. Overview
- 16.2.5.2. Products
- 16.2.5.3. SWOT Analysis
- 16.2.5.4. Recent Developments
- 16.2.5.5. Financials (Based on Availability)
- 16.2.6 Amcor Limited
- 16.2.6.1. Overview
- 16.2.6.2. Products
- 16.2.6.3. SWOT Analysis
- 16.2.6.4. Recent Developments
- 16.2.6.5. Financials (Based on Availability)
- 16.2.7 Berry Global Inc
- 16.2.7.1. Overview
- 16.2.7.2. Products
- 16.2.7.3. SWOT Analysis
- 16.2.7.4. Recent Developments
- 16.2.7.5. Financials (Based on Availability)
- 16.2.8 Berlin Packaging
- 16.2.8.1. Overview
- 16.2.8.2. Products
- 16.2.8.3. SWOT Analysis
- 16.2.8.4. Recent Developments
- 16.2.8.5. Financials (Based on Availability)
- 16.2.9 Westroc
- 16.2.9.1. Overview
- 16.2.9.2. Products
- 16.2.9.3. SWOT Analysis
- 16.2.9.4. Recent Developments
- 16.2.9.5. Financials (Based on Availability)
- 16.2.10 Crown Holdings Inc
- 16.2.10.1. Overview
- 16.2.10.2. Products
- 16.2.10.3. SWOT Analysis
- 16.2.10.4. Recent Developments
- 16.2.10.5. Financials (Based on Availability)
- 16.2.11 Owens-illinois Inc
- 16.2.11.1. Overview
- 16.2.11.2. Products
- 16.2.11.3. SWOT Analysis
- 16.2.11.4. Recent Developments
- 16.2.11.5. Financials (Based on Availability)
- 16.2.1 Ardagh Group
List of Figures
- Figure 1: Global US Beverage Packaging Industry Revenue Breakdown (Million, %) by Region 2024 & 2032
- Figure 2: United states US Beverage Packaging Industry Revenue (Million), by Country 2024 & 2032
- Figure 3: United states US Beverage Packaging Industry Revenue Share (%), by Country 2024 & 2032
- Figure 4: North America US Beverage Packaging Industry Revenue (Million), by Material 2024 & 2032
- Figure 5: North America US Beverage Packaging Industry Revenue Share (%), by Material 2024 & 2032
- Figure 6: North America US Beverage Packaging Industry Revenue (Million), by Product Type 2024 & 2032
- Figure 7: North America US Beverage Packaging Industry Revenue Share (%), by Product Type 2024 & 2032
- Figure 8: North America US Beverage Packaging Industry Revenue (Million), by Application 2024 & 2032
- Figure 9: North America US Beverage Packaging Industry Revenue Share (%), by Application 2024 & 2032
- Figure 10: North America US Beverage Packaging Industry Revenue (Million), by Country 2024 & 2032
- Figure 11: North America US Beverage Packaging Industry Revenue Share (%), by Country 2024 & 2032
- Figure 12: South America US Beverage Packaging Industry Revenue (Million), by Material 2024 & 2032
- Figure 13: South America US Beverage Packaging Industry Revenue Share (%), by Material 2024 & 2032
- Figure 14: South America US Beverage Packaging Industry Revenue (Million), by Product Type 2024 & 2032
- Figure 15: South America US Beverage Packaging Industry Revenue Share (%), by Product Type 2024 & 2032
- Figure 16: South America US Beverage Packaging Industry Revenue (Million), by Application 2024 & 2032
- Figure 17: South America US Beverage Packaging Industry Revenue Share (%), by Application 2024 & 2032
- Figure 18: South America US Beverage Packaging Industry Revenue (Million), by Country 2024 & 2032
- Figure 19: South America US Beverage Packaging Industry Revenue Share (%), by Country 2024 & 2032
- Figure 20: Europe US Beverage Packaging Industry Revenue (Million), by Material 2024 & 2032
- Figure 21: Europe US Beverage Packaging Industry Revenue Share (%), by Material 2024 & 2032
- Figure 22: Europe US Beverage Packaging Industry Revenue (Million), by Product Type 2024 & 2032
- Figure 23: Europe US Beverage Packaging Industry Revenue Share (%), by Product Type 2024 & 2032
- Figure 24: Europe US Beverage Packaging Industry Revenue (Million), by Application 2024 & 2032
- Figure 25: Europe US Beverage Packaging Industry Revenue Share (%), by Application 2024 & 2032
- Figure 26: Europe US Beverage Packaging Industry Revenue (Million), by Country 2024 & 2032
- Figure 27: Europe US Beverage Packaging Industry Revenue Share (%), by Country 2024 & 2032
- Figure 28: Middle East & Africa US Beverage Packaging Industry Revenue (Million), by Material 2024 & 2032
- Figure 29: Middle East & Africa US Beverage Packaging Industry Revenue Share (%), by Material 2024 & 2032
- Figure 30: Middle East & Africa US Beverage Packaging Industry Revenue (Million), by Product Type 2024 & 2032
- Figure 31: Middle East & Africa US Beverage Packaging Industry Revenue Share (%), by Product Type 2024 & 2032
- Figure 32: Middle East & Africa US Beverage Packaging Industry Revenue (Million), by Application 2024 & 2032
- Figure 33: Middle East & Africa US Beverage Packaging Industry Revenue Share (%), by Application 2024 & 2032
- Figure 34: Middle East & Africa US Beverage Packaging Industry Revenue (Million), by Country 2024 & 2032
- Figure 35: Middle East & Africa US Beverage Packaging Industry Revenue Share (%), by Country 2024 & 2032
- Figure 36: Asia Pacific US Beverage Packaging Industry Revenue (Million), by Material 2024 & 2032
- Figure 37: Asia Pacific US Beverage Packaging Industry Revenue Share (%), by Material 2024 & 2032
- Figure 38: Asia Pacific US Beverage Packaging Industry Revenue (Million), by Product Type 2024 & 2032
- Figure 39: Asia Pacific US Beverage Packaging Industry Revenue Share (%), by Product Type 2024 & 2032
- Figure 40: Asia Pacific US Beverage Packaging Industry Revenue (Million), by Application 2024 & 2032
- Figure 41: Asia Pacific US Beverage Packaging Industry Revenue Share (%), by Application 2024 & 2032
- Figure 42: Asia Pacific US Beverage Packaging Industry Revenue (Million), by Country 2024 & 2032
- Figure 43: Asia Pacific US Beverage Packaging Industry Revenue Share (%), by Country 2024 & 2032
List of Tables
- Table 1: Global US Beverage Packaging Industry Revenue Million Forecast, by Region 2019 & 2032
- Table 2: Global US Beverage Packaging Industry Revenue Million Forecast, by Material 2019 & 2032
- Table 3: Global US Beverage Packaging Industry Revenue Million Forecast, by Product Type 2019 & 2032
- Table 4: Global US Beverage Packaging Industry Revenue Million Forecast, by Application 2019 & 2032
- Table 5: Global US Beverage Packaging Industry Revenue Million Forecast, by Region 2019 & 2032
- Table 6: Global US Beverage Packaging Industry Revenue Million Forecast, by Country 2019 & 2032
- Table 7: Northeast US Beverage Packaging Industry Revenue (Million) Forecast, by Application 2019 & 2032
- Table 8: Southeast US Beverage Packaging Industry Revenue (Million) Forecast, by Application 2019 & 2032
- Table 9: Midwest US Beverage Packaging Industry Revenue (Million) Forecast, by Application 2019 & 2032
- Table 10: Southwest US Beverage Packaging Industry Revenue (Million) Forecast, by Application 2019 & 2032
- Table 11: West US Beverage Packaging Industry Revenue (Million) Forecast, by Application 2019 & 2032
- Table 12: Global US Beverage Packaging Industry Revenue Million Forecast, by Material 2019 & 2032
- Table 13: Global US Beverage Packaging Industry Revenue Million Forecast, by Product Type 2019 & 2032
- Table 14: Global US Beverage Packaging Industry Revenue Million Forecast, by Application 2019 & 2032
- Table 15: Global US Beverage Packaging Industry Revenue Million Forecast, by Country 2019 & 2032
- Table 16: United States US Beverage Packaging Industry Revenue (Million) Forecast, by Application 2019 & 2032
- Table 17: Canada US Beverage Packaging Industry Revenue (Million) Forecast, by Application 2019 & 2032
- Table 18: Mexico US Beverage Packaging Industry Revenue (Million) Forecast, by Application 2019 & 2032
- Table 19: Global US Beverage Packaging Industry Revenue Million Forecast, by Material 2019 & 2032
- Table 20: Global US Beverage Packaging Industry Revenue Million Forecast, by Product Type 2019 & 2032
- Table 21: Global US Beverage Packaging Industry Revenue Million Forecast, by Application 2019 & 2032
- Table 22: Global US Beverage Packaging Industry Revenue Million Forecast, by Country 2019 & 2032
- Table 23: Brazil US Beverage Packaging Industry Revenue (Million) Forecast, by Application 2019 & 2032
- Table 24: Argentina US Beverage Packaging Industry Revenue (Million) Forecast, by Application 2019 & 2032
- Table 25: Rest of South America US Beverage Packaging Industry Revenue (Million) Forecast, by Application 2019 & 2032
- Table 26: Global US Beverage Packaging Industry Revenue Million Forecast, by Material 2019 & 2032
- Table 27: Global US Beverage Packaging Industry Revenue Million Forecast, by Product Type 2019 & 2032
- Table 28: Global US Beverage Packaging Industry Revenue Million Forecast, by Application 2019 & 2032
- Table 29: Global US Beverage Packaging Industry Revenue Million Forecast, by Country 2019 & 2032
- Table 30: United Kingdom US Beverage Packaging Industry Revenue (Million) Forecast, by Application 2019 & 2032
- Table 31: Germany US Beverage Packaging Industry Revenue (Million) Forecast, by Application 2019 & 2032
- Table 32: France US Beverage Packaging Industry Revenue (Million) Forecast, by Application 2019 & 2032
- Table 33: Italy US Beverage Packaging Industry Revenue (Million) Forecast, by Application 2019 & 2032
- Table 34: Spain US Beverage Packaging Industry Revenue (Million) Forecast, by Application 2019 & 2032
- Table 35: Russia US Beverage Packaging Industry Revenue (Million) Forecast, by Application 2019 & 2032
- Table 36: Benelux US Beverage Packaging Industry Revenue (Million) Forecast, by Application 2019 & 2032
- Table 37: Nordics US Beverage Packaging Industry Revenue (Million) Forecast, by Application 2019 & 2032
- Table 38: Rest of Europe US Beverage Packaging Industry Revenue (Million) Forecast, by Application 2019 & 2032
- Table 39: Global US Beverage Packaging Industry Revenue Million Forecast, by Material 2019 & 2032
- Table 40: Global US Beverage Packaging Industry Revenue Million Forecast, by Product Type 2019 & 2032
- Table 41: Global US Beverage Packaging Industry Revenue Million Forecast, by Application 2019 & 2032
- Table 42: Global US Beverage Packaging Industry Revenue Million Forecast, by Country 2019 & 2032
- Table 43: Turkey US Beverage Packaging Industry Revenue (Million) Forecast, by Application 2019 & 2032
- Table 44: Israel US Beverage Packaging Industry Revenue (Million) Forecast, by Application 2019 & 2032
- Table 45: GCC US Beverage Packaging Industry Revenue (Million) Forecast, by Application 2019 & 2032
- Table 46: North Africa US Beverage Packaging Industry Revenue (Million) Forecast, by Application 2019 & 2032
- Table 47: South Africa US Beverage Packaging Industry Revenue (Million) Forecast, by Application 2019 & 2032
- Table 48: Rest of Middle East & Africa US Beverage Packaging Industry Revenue (Million) Forecast, by Application 2019 & 2032
- Table 49: Global US Beverage Packaging Industry Revenue Million Forecast, by Material 2019 & 2032
- Table 50: Global US Beverage Packaging Industry Revenue Million Forecast, by Product Type 2019 & 2032
- Table 51: Global US Beverage Packaging Industry Revenue Million Forecast, by Application 2019 & 2032
- Table 52: Global US Beverage Packaging Industry Revenue Million Forecast, by Country 2019 & 2032
- Table 53: China US Beverage Packaging Industry Revenue (Million) Forecast, by Application 2019 & 2032
- Table 54: India US Beverage Packaging Industry Revenue (Million) Forecast, by Application 2019 & 2032
- Table 55: Japan US Beverage Packaging Industry Revenue (Million) Forecast, by Application 2019 & 2032
- Table 56: South Korea US Beverage Packaging Industry Revenue (Million) Forecast, by Application 2019 & 2032
- Table 57: ASEAN US Beverage Packaging Industry Revenue (Million) Forecast, by Application 2019 & 2032
- Table 58: Oceania US Beverage Packaging Industry Revenue (Million) Forecast, by Application 2019 & 2032
- Table 59: Rest of Asia Pacific US Beverage Packaging Industry Revenue (Million) Forecast, by Application 2019 & 2032
Frequently Asked Questions
1. What is the projected Compound Annual Growth Rate (CAGR) of the US Beverage Packaging Industry?
The projected CAGR is approximately 5.60%.
2. Which companies are prominent players in the US Beverage Packaging Industry?
Key companies in the market include Ardagh Group, CCL Containers Inc, Sonoco Products Company, Ball Corporation, Silgan Containers Inc, Amcor Limited, Berry Global Inc, Berlin Packaging, Westroc, Crown Holdings Inc, Owens-illinois Inc.
3. What are the main segments of the US Beverage Packaging Industry?
The market segments include Material, Product Type, Application.
4. Can you provide details about the market size?
The market size is estimated to be USD XX Million as of 2022.
5. What are some drivers contributing to market growth?
Growing Demand for Bottled Beverages is Driving the Market in the Wine Industry; Increased Integration in the Premium Packaging Market Further Drives the Growth.
6. What are the notable trends driving market growth?
Alcohol Beverages to hold significant market share.
7. Are there any restraints impacting market growth?
People's Attitude Towards Sustainable Forms of Packaging.
8. Can you provide examples of recent developments in the market?
July 2021 - Ball Corporation is planning to significantly increase its manufacturing capacity, with new cutting-edge facilities in the UK and Russia. With an increasing consumer call for more sustainable purchasing options and a growing number of new brands and beverage categories choosing cans, demand for aluminum packaging is rapidly expanding around the world.
9. What pricing options are available for accessing the report?
Pricing options include single-user, multi-user, and enterprise licenses priced at USD 3800, USD 4500, and USD 5800 respectively.
10. Is the market size provided in terms of value or volume?
The market size is provided in terms of value, measured in Million.
11. Are there any specific market keywords associated with the report?
Yes, the market keyword associated with the report is "US Beverage Packaging Industry," which aids in identifying and referencing the specific market segment covered.
12. How do I determine which pricing option suits my needs best?
The pricing options vary based on user requirements and access needs. Individual users may opt for single-user licenses, while businesses requiring broader access may choose multi-user or enterprise licenses for cost-effective access to the report.
13. Are there any additional resources or data provided in the US Beverage Packaging Industry report?
While the report offers comprehensive insights, it's advisable to review the specific contents or supplementary materials provided to ascertain if additional resources or data are available.
14. How can I stay updated on further developments or reports in the US Beverage Packaging Industry?
To stay informed about further developments, trends, and reports in the US Beverage Packaging Industry, consider subscribing to industry newsletters, following relevant companies and organizations, or regularly checking reputable industry news sources and publications.
Methodology
Step 1 - Identification of Relevant Samples Size from Population Database


Step 2 - Approaches for Defining Global Market Size (Value, Volume* & Price*)

Note*: In applicable scenarios
Step 3 - Data Sources
Primary Research
- Web Analytics
- Survey Reports
- Research Institute
- Latest Research Reports
- Opinion Leaders
Secondary Research
- Annual Reports
- White Paper
- Latest Press Release
- Industry Association
- Paid Database
- Investor Presentations

Step 4 - Data Triangulation
Involves using different sources of information in order to increase the validity of a study
These sources are likely to be stakeholders in a program - participants, other researchers, program staff, other community members, and so on.
Then we put all data in single framework & apply various statistical tools to find out the dynamic on the market.
During the analysis stage, feedback from the stakeholder groups would be compared to determine areas of agreement as well as areas of divergence


