Emerging Trends in US Bio fungicides Industry: A Technology Perspective 2025-2033

US Bio fungicides Industry by Production Analysis, by Consumption Analysis, by Import Market Analysis (Value & Volume), by Export Market Analysis (Value & Volume), by Price Trend Analysis, by North America (United States, Canada, Mexico), by South America (Brazil, Argentina, Rest of South America), by Europe (United Kingdom, Germany, France, Italy, Spain, Russia, Benelux, Nordics, Rest of Europe), by Middle East & Africa (Turkey, Israel, GCC, North Africa, South Africa, Rest of Middle East & Africa), by Asia Pacific (China, India, Japan, South Korea, ASEAN, Oceania, Rest of Asia Pacific) Forecast 2025-2033

Jun 26 2025
Base Year: 2024

197 Pages
Main Logo

Emerging Trends in US Bio fungicides Industry: A Technology Perspective 2025-2033


Home
Industries
Agriculture
sponsor image

Tailored for you

  • In-depth Analysis Tailored to Specified Regions or Segments
  • Company Profiles Customized to User Preferences
  • Comprehensive Insights Focused on Specific Segments or Regions
  • Customized Evaluation of Competitive Landscape to Meet Your Needs
  • Tailored Customization to Address Other Specific Requirements
Ask for customization


Key Insights

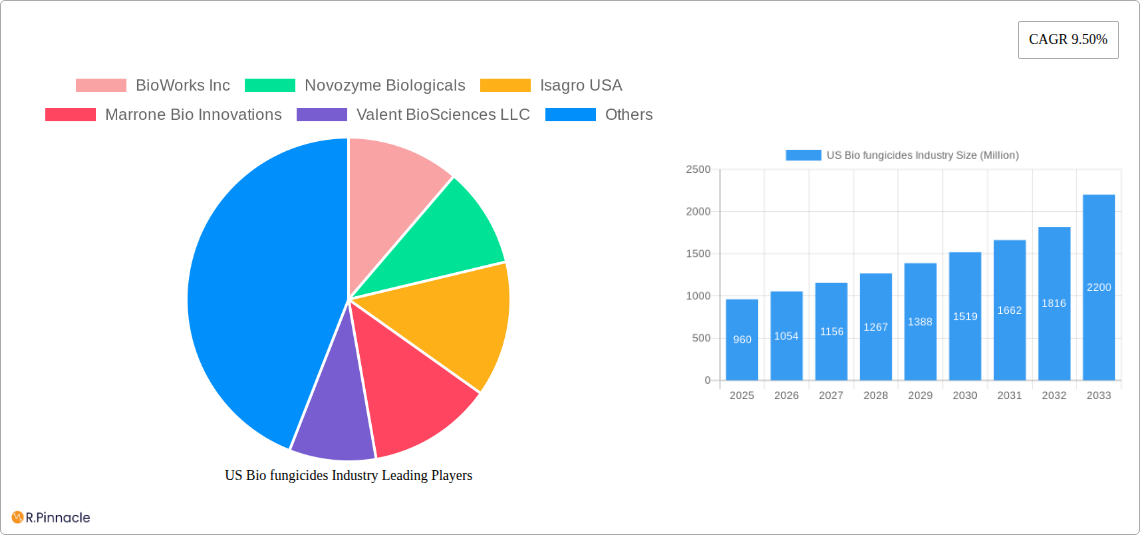
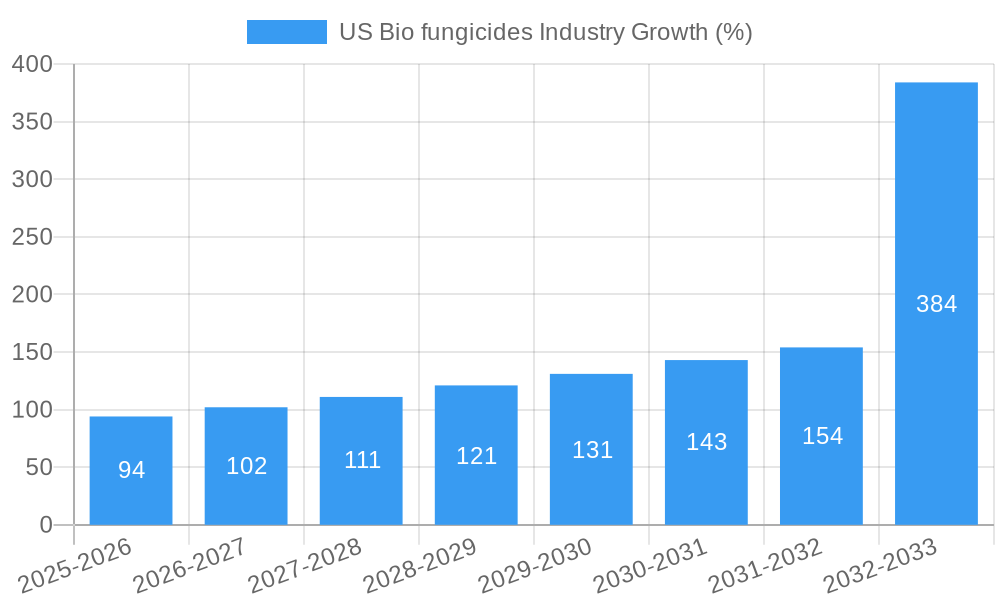
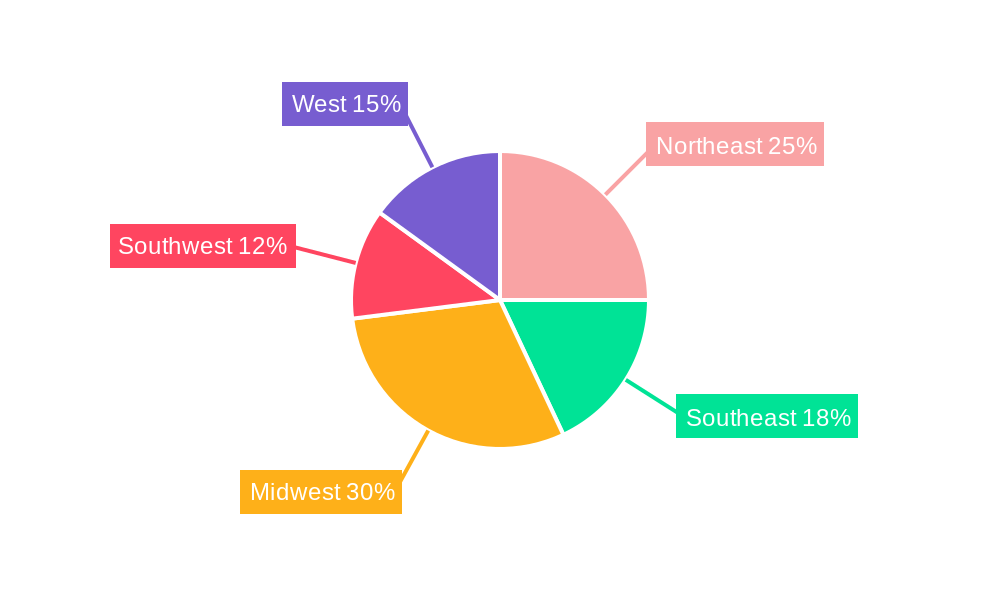
The US biofungicides market, valued at $960 million in 2025, is projected to experience robust growth, driven by increasing demand for sustainable agricultural practices and growing concerns over the environmental impact of chemical fungicides. The market's Compound Annual Growth Rate (CAGR) of 9.5% from 2025 to 2033 indicates significant expansion, reaching an estimated $2.2 billion by 2033. Key drivers include stringent regulations on chemical pesticides, rising consumer preference for organically grown produce, and the increasing prevalence of crop diseases resistant to conventional fungicides. Market segmentation reveals substantial contributions from various crop types, with grains and cereals, oilseeds, and fruits and vegetables forming the major segments. The Northeast, Midwest, and West regions are expected to dominate the market due to their substantial agricultural output and adoption of advanced farming techniques. Leading companies such as BioWorks Inc, Novozyme Biologicals, and Syngenta AG are actively involved in research and development, contributing to market innovation and expanding product portfolios. The market's growth, however, faces certain restraints including the relatively higher cost of biofungicides compared to their chemical counterparts and the potential for varying efficacy across different crops and environmental conditions.

The competitive landscape is characterized by a mix of established players and emerging companies. Strategic partnerships, mergers and acquisitions, and the development of novel biofungicide formulations are anticipated to shape the market dynamics in the coming years. The continued focus on research and development, coupled with supportive government policies promoting sustainable agriculture, will further propel the growth of the US biofungicides market. Regional variations in growth rates will likely be influenced by factors such as climatic conditions, agricultural practices, and regulatory frameworks. Understanding these dynamics is crucial for businesses operating in this sector to strategically position themselves for success. The market presents significant opportunities for both established companies and new entrants focused on innovation, sustainability, and meeting the growing demand for effective and environmentally friendly crop protection solutions.

US Biofungicides Industry Market Report: 2019-2033

This comprehensive report provides an in-depth analysis of the US biofungicides market, offering valuable insights for industry professionals, investors, and stakeholders. Covering the period from 2019 to 2033, with a base year of 2025, this report meticulously examines market dynamics, innovation trends, competitive landscapes, and future growth potential. The report leverages extensive data and analysis to present actionable intelligence, empowering informed decision-making.

US Bio fungicides Industry Research Report - Market Size, Growth & Forecast

US Biofungicides Industry Market Structure & Innovation Trends

The US biofungicides market exhibits a moderately concentrated structure with key players like BioWorks Inc, Novozyme Biologicals, Isagro USA, Marrone Bio Innovations, Valent BioSciences LLC, Syngenta AG, De Sangosse Lt, and Certis USA LLC holding significant market share. The combined market share of the top five players is estimated at xx% in 2025. Innovation is driven by the increasing demand for sustainable agricultural practices, stringent regulations on chemical fungicides, and the growing awareness of environmental concerns. Regulatory frameworks like the EPA's biopesticide registration process significantly influence market dynamics. Key product substitutes include traditional chemical fungicides, though biofungicides are gaining traction due to their environmental benefits. The end-user demographics are primarily comprised of large-scale commercial farms, smaller farms, and turf and ornamental management companies. M&A activities have been relatively moderate in recent years, with a total deal value of approximately $xx Million between 2019 and 2024.

  • Market Concentration: Moderately concentrated, with top 5 players holding xx% market share in 2025.
  • Innovation Drivers: Sustainable agriculture, stringent regulations, environmental concerns.
  • Regulatory Framework: EPA biopesticide registration process.
  • M&A Activity: Total deal value of approximately $xx Million (2019-2024).
US Bio fungicides Industry Growth

US Biofungicides Industry Market Dynamics & Trends

The US biofungicides market is experiencing robust growth, driven by factors such as increasing consumer demand for organic and sustainably produced food, rising prevalence of plant diseases, and growing government support for sustainable agriculture. Technological advancements, such as improved formulation technologies and the development of novel biocontrol agents, are further fueling market expansion. The market is witnessing a shift towards bio-based solutions due to increasing consumer preference for environmentally friendly products and stricter regulations on chemical fungicides. Competitive dynamics are characterized by both collaboration and competition, with companies focusing on strategic partnerships, product differentiation, and geographical expansion. The CAGR for the market is projected at xx% during the forecast period (2025-2033), with market penetration increasing from xx% in 2025 to xx% in 2033.

US Bio fungicides Industry Growth

Dominant Regions & Segments in US Biofungicides Industry

The Midwest region of the US is currently the dominant market for biofungicides, driven by its extensive agricultural land and high concentration of grain and cereal crops. Within crop types, the Grains and Cereals segment holds the largest market share, followed by Fruits and Vegetables.

  • Grains and Cereals: High demand due to large acreage, susceptibility to fungal diseases, and government support for sustainable agriculture practices.
  • Fruits and Vegetables: Growing consumer preference for organically grown produce and stringent regulations driving adoption.
  • Oilseeds: Moderate growth due to increasing demand for sustainable oilseed production.
  • Commercial Crops: Steady growth driven by the adoption of biofungicides in high-value crops.
  • Turf and Ornamentals: Increasing adoption of biofungicides in landscaping and golf courses due to environmental concerns.

The dominance of the Midwest is attributed to several factors, including favorable climatic conditions for agriculture, established agricultural infrastructure, and supportive government policies promoting sustainable farming practices.

US Biofungicides Industry Product Innovations

Recent product innovations focus on enhancing efficacy, improving formulation technologies for better application, and broadening the spectrum of fungal diseases controlled. Companies are developing next-generation biofungicides with improved shelf life and enhanced compatibility with other crop protection products. These innovations cater to the growing demand for sustainable and environmentally friendly solutions in agriculture and horticulture. Market fit is strong, driven by the increasing need for effective disease management without the negative environmental impacts associated with chemical fungicides.

Report Scope & Segmentation Analysis

This report segments the US biofungicides market by crop type: Grains and Cereals, Oilseeds, Commercial Crops, Fruits and Vegetables, and Turf and Ornamentals. Each segment is analyzed based on market size, growth projections, and competitive dynamics. The Grains and Cereals segment is projected to witness the highest growth rate during the forecast period, driven by increasing demand for sustainable agriculture. The Fruits and Vegetables segment is also expected to show significant growth due to growing consumer preference for organically grown produce. Oilseeds, Commercial Crops, and Turf & Ornamentals segments will experience steady growth, driven by increasing adoption of biofungicides in these sectors.

Key Drivers of US Biofungicides Industry Growth

Several factors drive the growth of the US biofungicides industry, including stringent regulations on chemical fungicides, rising consumer demand for organic and sustainably produced food, increasing awareness of environmental concerns, and technological advancements in biopesticide development leading to more effective and user-friendly products. Government incentives and supportive policies are also key contributors.

Challenges in the US Biofungicides Industry Sector

The US biofungicides industry faces challenges such as high development costs for new biopesticides, inconsistent efficacy compared to chemical fungicides in certain situations, and regulatory complexities associated with biopesticide registration. Supply chain issues and competition from established chemical fungicide manufacturers pose additional hurdles. The market is also affected by seasonal variations in demand and variations in disease prevalence.

Emerging Opportunities in US Biofungicides Industry

Emerging opportunities include the development of novel biofungicides with enhanced efficacy and broader spectrum activity, the exploration of new application methods, and expansion into new market segments, particularly in organic and sustainable agriculture. Advances in formulation technologies and improved understanding of disease mechanisms are expected to create further opportunities.

Leading Players in the US Biofungicides Industry Market

  • BioWorks Inc
  • Novozyme Biologicals
  • Isagro USA
  • Marrone Bio Innovations
  • Valent BioSciences LLC
  • Syngenta AG
  • De Sangosse Lt
  • Certis USA LLC

Key Developments in US Biofungicides Industry

  • 2022-Q4: Valent BioSciences LLC launched a new biofungicide with enhanced efficacy against a wider range of fungal pathogens.
  • 2023-Q1: Marrone Bio Innovations announced a strategic partnership to expand its distribution network.
  • 2023-Q2: Syngenta AG invested in research and development for next-generation biofungicides. (Further developments will be added to the final report)

Future Outlook for US Biofungicides Industry Market

The future outlook for the US biofungicides market is positive, driven by continued growth in sustainable agriculture, increasing consumer demand for organic products, and technological advancements in biopesticide development. Strategic partnerships, innovative product development, and expansion into new markets will be crucial for success in this dynamic industry. The market is poised for significant expansion in the coming years, with growth further accelerated by a focus on research and development, improved regulatory frameworks, and consumer preferences shifting towards sustainable options.

US Bio fungicides Industry Segmentation

  • 1. Production Analysis
  • 2. Consumption Analysis
  • 3. Import Market Analysis (Value & Volume)
  • 4. Export Market Analysis (Value & Volume)
  • 5. Price Trend Analysis

US Bio fungicides Industry Segmentation By Geography

  • 1. North America
    • 1.1. United States
    • 1.2. Canada
    • 1.3. Mexico
  • 2. South America
    • 2.1. Brazil
    • 2.2. Argentina
    • 2.3. Rest of South America
  • 3. Europe
    • 3.1. United Kingdom
    • 3.2. Germany
    • 3.3. France
    • 3.4. Italy
    • 3.5. Spain
    • 3.6. Russia
    • 3.7. Benelux
    • 3.8. Nordics
    • 3.9. Rest of Europe
  • 4. Middle East & Africa
    • 4.1. Turkey
    • 4.2. Israel
    • 4.3. GCC
    • 4.4. North Africa
    • 4.5. South Africa
    • 4.6. Rest of Middle East & Africa
  • 5. Asia Pacific
    • 5.1. China
    • 5.2. India
    • 5.3. Japan
    • 5.4. South Korea
    • 5.5. ASEAN
    • 5.6. Oceania
    • 5.7. Rest of Asia Pacific
US Bio fungicides Industry Regional Share


US Bio fungicides Industry REPORT HIGHLIGHTS

AspectsDetails
Study Period 2019-2033
Base Year 2024
Estimated Year 2025
Forecast Period2025-2033
Historical Period2019-2024
Growth RateCAGR of 9.50% from 2019-2033
Segmentation
    • By Production Analysis
    • By Consumption Analysis
    • By Import Market Analysis (Value & Volume)
    • By Export Market Analysis (Value & Volume)
    • By Price Trend Analysis
  • By Geography
    • North America
      • United States
      • Canada
      • Mexico
    • South America
      • Brazil
      • Argentina
      • Rest of South America
    • Europe
      • United Kingdom
      • Germany
      • France
      • Italy
      • Spain
      • Russia
      • Benelux
      • Nordics
      • Rest of Europe
    • Middle East & Africa
      • Turkey
      • Israel
      • GCC
      • North Africa
      • South Africa
      • Rest of Middle East & Africa
    • Asia Pacific
      • China
      • India
      • Japan
      • South Korea
      • ASEAN
      • Oceania
      • Rest of Asia Pacific


Table of Contents

  1. 1. Introduction
    • 1.1. Research Scope
    • 1.2. Market Segmentation
    • 1.3. Research Methodology
    • 1.4. Definitions and Assumptions
  2. 2. Executive Summary
    • 2.1. Introduction
  3. 3. Market Dynamics
    • 3.1. Introduction
      • 3.2. Market Drivers
        • 3.2.1. Adoption of Organic and Eco-friendly Farming Practices; Declining Area of Arable Land and Rising Food Security Concerns
      • 3.3. Market Restrains
        • 3.3.1. High Demand for Conventional and Synthetic Products; Lack of Awareness and Other Factors Limiting the Adoption of Agricultural Inoculants
      • 3.4. Market Trends
        • 3.4.1. Fruits and Vegetables Fastest Market Growing Segment
  4. 4. Market Factor Analysis
    • 4.1. Porters Five Forces
    • 4.2. Supply/Value Chain
    • 4.3. PESTEL analysis
    • 4.4. Market Entropy
    • 4.5. Patent/Trademark Analysis
  5. 5. Global US Bio fungicides Industry Analysis, Insights and Forecast, 2019-2031
    • 5.1. Market Analysis, Insights and Forecast - by Production Analysis
      • 5.2. Market Analysis, Insights and Forecast - by Consumption Analysis
        • 5.3. Market Analysis, Insights and Forecast - by Import Market Analysis (Value & Volume)
          • 5.4. Market Analysis, Insights and Forecast - by Export Market Analysis (Value & Volume)
            • 5.5. Market Analysis, Insights and Forecast - by Price Trend Analysis
              • 5.6. Market Analysis, Insights and Forecast - by Region
                • 5.6.1. North America
                • 5.6.2. South America
                • 5.6.3. Europe
                • 5.6.4. Middle East & Africa
                • 5.6.5. Asia Pacific
            • 6. North America US Bio fungicides Industry Analysis, Insights and Forecast, 2019-2031
              • 6.1. Market Analysis, Insights and Forecast - by Production Analysis
                • 6.2. Market Analysis, Insights and Forecast - by Consumption Analysis
                  • 6.3. Market Analysis, Insights and Forecast - by Import Market Analysis (Value & Volume)
                    • 6.4. Market Analysis, Insights and Forecast - by Export Market Analysis (Value & Volume)
                      • 6.5. Market Analysis, Insights and Forecast - by Price Trend Analysis
                      • 7. South America US Bio fungicides Industry Analysis, Insights and Forecast, 2019-2031
                        • 7.1. Market Analysis, Insights and Forecast - by Production Analysis
                          • 7.2. Market Analysis, Insights and Forecast - by Consumption Analysis
                            • 7.3. Market Analysis, Insights and Forecast - by Import Market Analysis (Value & Volume)
                              • 7.4. Market Analysis, Insights and Forecast - by Export Market Analysis (Value & Volume)
                                • 7.5. Market Analysis, Insights and Forecast - by Price Trend Analysis
                                • 8. Europe US Bio fungicides Industry Analysis, Insights and Forecast, 2019-2031
                                  • 8.1. Market Analysis, Insights and Forecast - by Production Analysis
                                    • 8.2. Market Analysis, Insights and Forecast - by Consumption Analysis
                                      • 8.3. Market Analysis, Insights and Forecast - by Import Market Analysis (Value & Volume)
                                        • 8.4. Market Analysis, Insights and Forecast - by Export Market Analysis (Value & Volume)
                                          • 8.5. Market Analysis, Insights and Forecast - by Price Trend Analysis
                                          • 9. Middle East & Africa US Bio fungicides Industry Analysis, Insights and Forecast, 2019-2031
                                            • 9.1. Market Analysis, Insights and Forecast - by Production Analysis
                                              • 9.2. Market Analysis, Insights and Forecast - by Consumption Analysis
                                                • 9.3. Market Analysis, Insights and Forecast - by Import Market Analysis (Value & Volume)
                                                  • 9.4. Market Analysis, Insights and Forecast - by Export Market Analysis (Value & Volume)
                                                    • 9.5. Market Analysis, Insights and Forecast - by Price Trend Analysis
                                                    • 10. Asia Pacific US Bio fungicides Industry Analysis, Insights and Forecast, 2019-2031
                                                      • 10.1. Market Analysis, Insights and Forecast - by Production Analysis
                                                        • 10.2. Market Analysis, Insights and Forecast - by Consumption Analysis
                                                          • 10.3. Market Analysis, Insights and Forecast - by Import Market Analysis (Value & Volume)
                                                            • 10.4. Market Analysis, Insights and Forecast - by Export Market Analysis (Value & Volume)
                                                              • 10.5. Market Analysis, Insights and Forecast - by Price Trend Analysis
                                                              • 11. Northeast US Bio fungicides Industry Analysis, Insights and Forecast, 2019-2031
                                                                • 12. Southeast US Bio fungicides Industry Analysis, Insights and Forecast, 2019-2031
                                                                  • 13. Midwest US Bio fungicides Industry Analysis, Insights and Forecast, 2019-2031
                                                                    • 14. Southwest US Bio fungicides Industry Analysis, Insights and Forecast, 2019-2031
                                                                      • 15. West US Bio fungicides Industry Analysis, Insights and Forecast, 2019-2031
                                                                        • 16. Competitive Analysis
                                                                          • 16.1. Global Market Share Analysis 2024
                                                                            • 16.2. Company Profiles
                                                                              • 16.2.1 BioWorks Inc
                                                                                • 16.2.1.1. Overview
                                                                                • 16.2.1.2. Products
                                                                                • 16.2.1.3. SWOT Analysis
                                                                                • 16.2.1.4. Recent Developments
                                                                                • 16.2.1.5. Financials (Based on Availability)
                                                                              • 16.2.2 Novozyme Biologicals
                                                                                • 16.2.2.1. Overview
                                                                                • 16.2.2.2. Products
                                                                                • 16.2.2.3. SWOT Analysis
                                                                                • 16.2.2.4. Recent Developments
                                                                                • 16.2.2.5. Financials (Based on Availability)
                                                                              • 16.2.3 Isagro USA
                                                                                • 16.2.3.1. Overview
                                                                                • 16.2.3.2. Products
                                                                                • 16.2.3.3. SWOT Analysis
                                                                                • 16.2.3.4. Recent Developments
                                                                                • 16.2.3.5. Financials (Based on Availability)
                                                                              • 16.2.4 Marrone Bio Innovations
                                                                                • 16.2.4.1. Overview
                                                                                • 16.2.4.2. Products
                                                                                • 16.2.4.3. SWOT Analysis
                                                                                • 16.2.4.4. Recent Developments
                                                                                • 16.2.4.5. Financials (Based on Availability)
                                                                              • 16.2.5 Valent BioSciences LLC
                                                                                • 16.2.5.1. Overview
                                                                                • 16.2.5.2. Products
                                                                                • 16.2.5.3. SWOT Analysis
                                                                                • 16.2.5.4. Recent Developments
                                                                                • 16.2.5.5. Financials (Based on Availability)
                                                                              • 16.2.6 Syngenta AG
                                                                                • 16.2.6.1. Overview
                                                                                • 16.2.6.2. Products
                                                                                • 16.2.6.3. SWOT Analysis
                                                                                • 16.2.6.4. Recent Developments
                                                                                • 16.2.6.5. Financials (Based on Availability)
                                                                              • 16.2.7 De Sangosse Lt
                                                                                • 16.2.7.1. Overview
                                                                                • 16.2.7.2. Products
                                                                                • 16.2.7.3. SWOT Analysis
                                                                                • 16.2.7.4. Recent Developments
                                                                                • 16.2.7.5. Financials (Based on Availability)
                                                                              • 16.2.8 Certis USA LLC
                                                                                • 16.2.8.1. Overview
                                                                                • 16.2.8.2. Products
                                                                                • 16.2.8.3. SWOT Analysis
                                                                                • 16.2.8.4. Recent Developments
                                                                                • 16.2.8.5. Financials (Based on Availability)

                                                                        List of Figures

                                                                        1. Figure 1: Global US Bio fungicides Industry Revenue Breakdown (Million, %) by Region 2024 & 2032
                                                                        2. Figure 2: United states US Bio fungicides Industry Revenue (Million), by Country 2024 & 2032
                                                                        3. Figure 3: United states US Bio fungicides Industry Revenue Share (%), by Country 2024 & 2032
                                                                        4. Figure 4: North America US Bio fungicides Industry Revenue (Million), by Production Analysis 2024 & 2032
                                                                        5. Figure 5: North America US Bio fungicides Industry Revenue Share (%), by Production Analysis 2024 & 2032
                                                                        6. Figure 6: North America US Bio fungicides Industry Revenue (Million), by Consumption Analysis 2024 & 2032
                                                                        7. Figure 7: North America US Bio fungicides Industry Revenue Share (%), by Consumption Analysis 2024 & 2032
                                                                        8. Figure 8: North America US Bio fungicides Industry Revenue (Million), by Import Market Analysis (Value & Volume) 2024 & 2032
                                                                        9. Figure 9: North America US Bio fungicides Industry Revenue Share (%), by Import Market Analysis (Value & Volume) 2024 & 2032
                                                                        10. Figure 10: North America US Bio fungicides Industry Revenue (Million), by Export Market Analysis (Value & Volume) 2024 & 2032
                                                                        11. Figure 11: North America US Bio fungicides Industry Revenue Share (%), by Export Market Analysis (Value & Volume) 2024 & 2032
                                                                        12. Figure 12: North America US Bio fungicides Industry Revenue (Million), by Price Trend Analysis 2024 & 2032
                                                                        13. Figure 13: North America US Bio fungicides Industry Revenue Share (%), by Price Trend Analysis 2024 & 2032
                                                                        14. Figure 14: North America US Bio fungicides Industry Revenue (Million), by Country 2024 & 2032
                                                                        15. Figure 15: North America US Bio fungicides Industry Revenue Share (%), by Country 2024 & 2032
                                                                        16. Figure 16: South America US Bio fungicides Industry Revenue (Million), by Production Analysis 2024 & 2032
                                                                        17. Figure 17: South America US Bio fungicides Industry Revenue Share (%), by Production Analysis 2024 & 2032
                                                                        18. Figure 18: South America US Bio fungicides Industry Revenue (Million), by Consumption Analysis 2024 & 2032
                                                                        19. Figure 19: South America US Bio fungicides Industry Revenue Share (%), by Consumption Analysis 2024 & 2032
                                                                        20. Figure 20: South America US Bio fungicides Industry Revenue (Million), by Import Market Analysis (Value & Volume) 2024 & 2032
                                                                        21. Figure 21: South America US Bio fungicides Industry Revenue Share (%), by Import Market Analysis (Value & Volume) 2024 & 2032
                                                                        22. Figure 22: South America US Bio fungicides Industry Revenue (Million), by Export Market Analysis (Value & Volume) 2024 & 2032
                                                                        23. Figure 23: South America US Bio fungicides Industry Revenue Share (%), by Export Market Analysis (Value & Volume) 2024 & 2032
                                                                        24. Figure 24: South America US Bio fungicides Industry Revenue (Million), by Price Trend Analysis 2024 & 2032
                                                                        25. Figure 25: South America US Bio fungicides Industry Revenue Share (%), by Price Trend Analysis 2024 & 2032
                                                                        26. Figure 26: South America US Bio fungicides Industry Revenue (Million), by Country 2024 & 2032
                                                                        27. Figure 27: South America US Bio fungicides Industry Revenue Share (%), by Country 2024 & 2032
                                                                        28. Figure 28: Europe US Bio fungicides Industry Revenue (Million), by Production Analysis 2024 & 2032
                                                                        29. Figure 29: Europe US Bio fungicides Industry Revenue Share (%), by Production Analysis 2024 & 2032
                                                                        30. Figure 30: Europe US Bio fungicides Industry Revenue (Million), by Consumption Analysis 2024 & 2032
                                                                        31. Figure 31: Europe US Bio fungicides Industry Revenue Share (%), by Consumption Analysis 2024 & 2032
                                                                        32. Figure 32: Europe US Bio fungicides Industry Revenue (Million), by Import Market Analysis (Value & Volume) 2024 & 2032
                                                                        33. Figure 33: Europe US Bio fungicides Industry Revenue Share (%), by Import Market Analysis (Value & Volume) 2024 & 2032
                                                                        34. Figure 34: Europe US Bio fungicides Industry Revenue (Million), by Export Market Analysis (Value & Volume) 2024 & 2032
                                                                        35. Figure 35: Europe US Bio fungicides Industry Revenue Share (%), by Export Market Analysis (Value & Volume) 2024 & 2032
                                                                        36. Figure 36: Europe US Bio fungicides Industry Revenue (Million), by Price Trend Analysis 2024 & 2032
                                                                        37. Figure 37: Europe US Bio fungicides Industry Revenue Share (%), by Price Trend Analysis 2024 & 2032
                                                                        38. Figure 38: Europe US Bio fungicides Industry Revenue (Million), by Country 2024 & 2032
                                                                        39. Figure 39: Europe US Bio fungicides Industry Revenue Share (%), by Country 2024 & 2032
                                                                        40. Figure 40: Middle East & Africa US Bio fungicides Industry Revenue (Million), by Production Analysis 2024 & 2032
                                                                        41. Figure 41: Middle East & Africa US Bio fungicides Industry Revenue Share (%), by Production Analysis 2024 & 2032
                                                                        42. Figure 42: Middle East & Africa US Bio fungicides Industry Revenue (Million), by Consumption Analysis 2024 & 2032
                                                                        43. Figure 43: Middle East & Africa US Bio fungicides Industry Revenue Share (%), by Consumption Analysis 2024 & 2032
                                                                        44. Figure 44: Middle East & Africa US Bio fungicides Industry Revenue (Million), by Import Market Analysis (Value & Volume) 2024 & 2032
                                                                        45. Figure 45: Middle East & Africa US Bio fungicides Industry Revenue Share (%), by Import Market Analysis (Value & Volume) 2024 & 2032
                                                                        46. Figure 46: Middle East & Africa US Bio fungicides Industry Revenue (Million), by Export Market Analysis (Value & Volume) 2024 & 2032
                                                                        47. Figure 47: Middle East & Africa US Bio fungicides Industry Revenue Share (%), by Export Market Analysis (Value & Volume) 2024 & 2032
                                                                        48. Figure 48: Middle East & Africa US Bio fungicides Industry Revenue (Million), by Price Trend Analysis 2024 & 2032
                                                                        49. Figure 49: Middle East & Africa US Bio fungicides Industry Revenue Share (%), by Price Trend Analysis 2024 & 2032
                                                                        50. Figure 50: Middle East & Africa US Bio fungicides Industry Revenue (Million), by Country 2024 & 2032
                                                                        51. Figure 51: Middle East & Africa US Bio fungicides Industry Revenue Share (%), by Country 2024 & 2032
                                                                        52. Figure 52: Asia Pacific US Bio fungicides Industry Revenue (Million), by Production Analysis 2024 & 2032
                                                                        53. Figure 53: Asia Pacific US Bio fungicides Industry Revenue Share (%), by Production Analysis 2024 & 2032
                                                                        54. Figure 54: Asia Pacific US Bio fungicides Industry Revenue (Million), by Consumption Analysis 2024 & 2032
                                                                        55. Figure 55: Asia Pacific US Bio fungicides Industry Revenue Share (%), by Consumption Analysis 2024 & 2032
                                                                        56. Figure 56: Asia Pacific US Bio fungicides Industry Revenue (Million), by Import Market Analysis (Value & Volume) 2024 & 2032
                                                                        57. Figure 57: Asia Pacific US Bio fungicides Industry Revenue Share (%), by Import Market Analysis (Value & Volume) 2024 & 2032
                                                                        58. Figure 58: Asia Pacific US Bio fungicides Industry Revenue (Million), by Export Market Analysis (Value & Volume) 2024 & 2032
                                                                        59. Figure 59: Asia Pacific US Bio fungicides Industry Revenue Share (%), by Export Market Analysis (Value & Volume) 2024 & 2032
                                                                        60. Figure 60: Asia Pacific US Bio fungicides Industry Revenue (Million), by Price Trend Analysis 2024 & 2032
                                                                        61. Figure 61: Asia Pacific US Bio fungicides Industry Revenue Share (%), by Price Trend Analysis 2024 & 2032
                                                                        62. Figure 62: Asia Pacific US Bio fungicides Industry Revenue (Million), by Country 2024 & 2032
                                                                        63. Figure 63: Asia Pacific US Bio fungicides Industry Revenue Share (%), by Country 2024 & 2032

                                                                        List of Tables

                                                                        1. Table 1: Global US Bio fungicides Industry Revenue Million Forecast, by Region 2019 & 2032
                                                                        2. Table 2: Global US Bio fungicides Industry Revenue Million Forecast, by Production Analysis 2019 & 2032
                                                                        3. Table 3: Global US Bio fungicides Industry Revenue Million Forecast, by Consumption Analysis 2019 & 2032
                                                                        4. Table 4: Global US Bio fungicides Industry Revenue Million Forecast, by Import Market Analysis (Value & Volume) 2019 & 2032
                                                                        5. Table 5: Global US Bio fungicides Industry Revenue Million Forecast, by Export Market Analysis (Value & Volume) 2019 & 2032
                                                                        6. Table 6: Global US Bio fungicides Industry Revenue Million Forecast, by Price Trend Analysis 2019 & 2032
                                                                        7. Table 7: Global US Bio fungicides Industry Revenue Million Forecast, by Region 2019 & 2032
                                                                        8. Table 8: Global US Bio fungicides Industry Revenue Million Forecast, by Country 2019 & 2032
                                                                        9. Table 9: Northeast US Bio fungicides Industry Revenue (Million) Forecast, by Application 2019 & 2032
                                                                        10. Table 10: Southeast US Bio fungicides Industry Revenue (Million) Forecast, by Application 2019 & 2032
                                                                        11. Table 11: Midwest US Bio fungicides Industry Revenue (Million) Forecast, by Application 2019 & 2032
                                                                        12. Table 12: Southwest US Bio fungicides Industry Revenue (Million) Forecast, by Application 2019 & 2032
                                                                        13. Table 13: West US Bio fungicides Industry Revenue (Million) Forecast, by Application 2019 & 2032
                                                                        14. Table 14: Global US Bio fungicides Industry Revenue Million Forecast, by Production Analysis 2019 & 2032
                                                                        15. Table 15: Global US Bio fungicides Industry Revenue Million Forecast, by Consumption Analysis 2019 & 2032
                                                                        16. Table 16: Global US Bio fungicides Industry Revenue Million Forecast, by Import Market Analysis (Value & Volume) 2019 & 2032
                                                                        17. Table 17: Global US Bio fungicides Industry Revenue Million Forecast, by Export Market Analysis (Value & Volume) 2019 & 2032
                                                                        18. Table 18: Global US Bio fungicides Industry Revenue Million Forecast, by Price Trend Analysis 2019 & 2032
                                                                        19. Table 19: Global US Bio fungicides Industry Revenue Million Forecast, by Country 2019 & 2032
                                                                        20. Table 20: United States US Bio fungicides Industry Revenue (Million) Forecast, by Application 2019 & 2032
                                                                        21. Table 21: Canada US Bio fungicides Industry Revenue (Million) Forecast, by Application 2019 & 2032
                                                                        22. Table 22: Mexico US Bio fungicides Industry Revenue (Million) Forecast, by Application 2019 & 2032
                                                                        23. Table 23: Global US Bio fungicides Industry Revenue Million Forecast, by Production Analysis 2019 & 2032
                                                                        24. Table 24: Global US Bio fungicides Industry Revenue Million Forecast, by Consumption Analysis 2019 & 2032
                                                                        25. Table 25: Global US Bio fungicides Industry Revenue Million Forecast, by Import Market Analysis (Value & Volume) 2019 & 2032
                                                                        26. Table 26: Global US Bio fungicides Industry Revenue Million Forecast, by Export Market Analysis (Value & Volume) 2019 & 2032
                                                                        27. Table 27: Global US Bio fungicides Industry Revenue Million Forecast, by Price Trend Analysis 2019 & 2032
                                                                        28. Table 28: Global US Bio fungicides Industry Revenue Million Forecast, by Country 2019 & 2032
                                                                        29. Table 29: Brazil US Bio fungicides Industry Revenue (Million) Forecast, by Application 2019 & 2032
                                                                        30. Table 30: Argentina US Bio fungicides Industry Revenue (Million) Forecast, by Application 2019 & 2032
                                                                        31. Table 31: Rest of South America US Bio fungicides Industry Revenue (Million) Forecast, by Application 2019 & 2032
                                                                        32. Table 32: Global US Bio fungicides Industry Revenue Million Forecast, by Production Analysis 2019 & 2032
                                                                        33. Table 33: Global US Bio fungicides Industry Revenue Million Forecast, by Consumption Analysis 2019 & 2032
                                                                        34. Table 34: Global US Bio fungicides Industry Revenue Million Forecast, by Import Market Analysis (Value & Volume) 2019 & 2032
                                                                        35. Table 35: Global US Bio fungicides Industry Revenue Million Forecast, by Export Market Analysis (Value & Volume) 2019 & 2032
                                                                        36. Table 36: Global US Bio fungicides Industry Revenue Million Forecast, by Price Trend Analysis 2019 & 2032
                                                                        37. Table 37: Global US Bio fungicides Industry Revenue Million Forecast, by Country 2019 & 2032
                                                                        38. Table 38: United Kingdom US Bio fungicides Industry Revenue (Million) Forecast, by Application 2019 & 2032
                                                                        39. Table 39: Germany US Bio fungicides Industry Revenue (Million) Forecast, by Application 2019 & 2032
                                                                        40. Table 40: France US Bio fungicides Industry Revenue (Million) Forecast, by Application 2019 & 2032
                                                                        41. Table 41: Italy US Bio fungicides Industry Revenue (Million) Forecast, by Application 2019 & 2032
                                                                        42. Table 42: Spain US Bio fungicides Industry Revenue (Million) Forecast, by Application 2019 & 2032
                                                                        43. Table 43: Russia US Bio fungicides Industry Revenue (Million) Forecast, by Application 2019 & 2032
                                                                        44. Table 44: Benelux US Bio fungicides Industry Revenue (Million) Forecast, by Application 2019 & 2032
                                                                        45. Table 45: Nordics US Bio fungicides Industry Revenue (Million) Forecast, by Application 2019 & 2032
                                                                        46. Table 46: Rest of Europe US Bio fungicides Industry Revenue (Million) Forecast, by Application 2019 & 2032
                                                                        47. Table 47: Global US Bio fungicides Industry Revenue Million Forecast, by Production Analysis 2019 & 2032
                                                                        48. Table 48: Global US Bio fungicides Industry Revenue Million Forecast, by Consumption Analysis 2019 & 2032
                                                                        49. Table 49: Global US Bio fungicides Industry Revenue Million Forecast, by Import Market Analysis (Value & Volume) 2019 & 2032
                                                                        50. Table 50: Global US Bio fungicides Industry Revenue Million Forecast, by Export Market Analysis (Value & Volume) 2019 & 2032
                                                                        51. Table 51: Global US Bio fungicides Industry Revenue Million Forecast, by Price Trend Analysis 2019 & 2032
                                                                        52. Table 52: Global US Bio fungicides Industry Revenue Million Forecast, by Country 2019 & 2032
                                                                        53. Table 53: Turkey US Bio fungicides Industry Revenue (Million) Forecast, by Application 2019 & 2032
                                                                        54. Table 54: Israel US Bio fungicides Industry Revenue (Million) Forecast, by Application 2019 & 2032
                                                                        55. Table 55: GCC US Bio fungicides Industry Revenue (Million) Forecast, by Application 2019 & 2032
                                                                        56. Table 56: North Africa US Bio fungicides Industry Revenue (Million) Forecast, by Application 2019 & 2032
                                                                        57. Table 57: South Africa US Bio fungicides Industry Revenue (Million) Forecast, by Application 2019 & 2032
                                                                        58. Table 58: Rest of Middle East & Africa US Bio fungicides Industry Revenue (Million) Forecast, by Application 2019 & 2032
                                                                        59. Table 59: Global US Bio fungicides Industry Revenue Million Forecast, by Production Analysis 2019 & 2032
                                                                        60. Table 60: Global US Bio fungicides Industry Revenue Million Forecast, by Consumption Analysis 2019 & 2032
                                                                        61. Table 61: Global US Bio fungicides Industry Revenue Million Forecast, by Import Market Analysis (Value & Volume) 2019 & 2032
                                                                        62. Table 62: Global US Bio fungicides Industry Revenue Million Forecast, by Export Market Analysis (Value & Volume) 2019 & 2032
                                                                        63. Table 63: Global US Bio fungicides Industry Revenue Million Forecast, by Price Trend Analysis 2019 & 2032
                                                                        64. Table 64: Global US Bio fungicides Industry Revenue Million Forecast, by Country 2019 & 2032
                                                                        65. Table 65: China US Bio fungicides Industry Revenue (Million) Forecast, by Application 2019 & 2032
                                                                        66. Table 66: India US Bio fungicides Industry Revenue (Million) Forecast, by Application 2019 & 2032
                                                                        67. Table 67: Japan US Bio fungicides Industry Revenue (Million) Forecast, by Application 2019 & 2032
                                                                        68. Table 68: South Korea US Bio fungicides Industry Revenue (Million) Forecast, by Application 2019 & 2032
                                                                        69. Table 69: ASEAN US Bio fungicides Industry Revenue (Million) Forecast, by Application 2019 & 2032
                                                                        70. Table 70: Oceania US Bio fungicides Industry Revenue (Million) Forecast, by Application 2019 & 2032
                                                                        71. Table 71: Rest of Asia Pacific US Bio fungicides Industry Revenue (Million) Forecast, by Application 2019 & 2032


                                                                        Frequently Asked Questions

                                                                        1. What is the projected Compound Annual Growth Rate (CAGR) of the US Bio fungicides Industry?

                                                                        The projected CAGR is approximately 9.50%.

                                                                        2. Which companies are prominent players in the US Bio fungicides Industry?

                                                                        Key companies in the market include BioWorks Inc, Novozyme Biologicals, Isagro USA, Marrone Bio Innovations, Valent BioSciences LLC, Syngenta AG, De Sangosse Lt, Certis USA LLC.

                                                                        3. What are the main segments of the US Bio fungicides Industry?

                                                                        The market segments include Production Analysis, Consumption Analysis, Import Market Analysis (Value & Volume), Export Market Analysis (Value & Volume), Price Trend Analysis.

                                                                        4. Can you provide details about the market size?

                                                                        The market size is estimated to be USD 0.96 Million as of 2022.

                                                                        5. What are some drivers contributing to market growth?

                                                                        Adoption of Organic and Eco-friendly Farming Practices; Declining Area of Arable Land and Rising Food Security Concerns.

                                                                        6. What are the notable trends driving market growth?

                                                                        Fruits and Vegetables Fastest Market Growing Segment.

                                                                        7. Are there any restraints impacting market growth?

                                                                        High Demand for Conventional and Synthetic Products; Lack of Awareness and Other Factors Limiting the Adoption of Agricultural Inoculants.

                                                                        8. Can you provide examples of recent developments in the market?

                                                                        N/A

                                                                        9. What pricing options are available for accessing the report?

                                                                        Pricing options include single-user, multi-user, and enterprise licenses priced at USD 3800, USD 4500, and USD 5800 respectively.

                                                                        10. Is the market size provided in terms of value or volume?

                                                                        The market size is provided in terms of value, measured in Million.

                                                                        11. Are there any specific market keywords associated with the report?

                                                                        Yes, the market keyword associated with the report is "US Bio fungicides Industry," which aids in identifying and referencing the specific market segment covered.

                                                                        12. How do I determine which pricing option suits my needs best?

                                                                        The pricing options vary based on user requirements and access needs. Individual users may opt for single-user licenses, while businesses requiring broader access may choose multi-user or enterprise licenses for cost-effective access to the report.

                                                                        13. Are there any additional resources or data provided in the US Bio fungicides Industry report?

                                                                        While the report offers comprehensive insights, it's advisable to review the specific contents or supplementary materials provided to ascertain if additional resources or data are available.

                                                                        14. How can I stay updated on further developments or reports in the US Bio fungicides Industry?

                                                                        To stay informed about further developments, trends, and reports in the US Bio fungicides Industry, consider subscribing to industry newsletters, following relevant companies and organizations, or regularly checking reputable industry news sources and publications.


                                                                        Methodology

                                                                        Step 1 - Identification of Relevant Samples Size from Population Database

                                                                        Step Chart
                                                                        Bar Chart
                                                                        Method Chart

                                                                        Step 2 - Approaches for Defining Global Market Size (Value, Volume* & Price*)

                                                                        Approach Chart
                                                                        Top-down and bottom-up approaches are used to validate the global market size and estimate the market size for manufactures, regional segments, product, and application.

                                                                        Note*: In applicable scenarios

                                                                        Step 3 - Data Sources

                                                                        Primary Research

                                                                        • Web Analytics
                                                                        • Survey Reports
                                                                        • Research Institute
                                                                        • Latest Research Reports
                                                                        • Opinion Leaders

                                                                        Secondary Research

                                                                        • Annual Reports
                                                                        • White Paper
                                                                        • Latest Press Release
                                                                        • Industry Association
                                                                        • Paid Database
                                                                        • Investor Presentations
                                                                        Analyst Chart

                                                                        Step 4 - Data Triangulation

                                                                        Involves using different sources of information in order to increase the validity of a study

                                                                        These sources are likely to be stakeholders in a program - participants, other researchers, program staff, other community members, and so on.

                                                                        Then we put all data in single framework & apply various statistical tools to find out the dynamic on the market.

                                                                        During the analysis stage, feedback from the stakeholder groups would be compared to determine areas of agreement as well as areas of divergence

                                                                        Additionally, after gathering mixed and scattered data from a wide range of sources, data is triangulated and correlated to come up with estimated figures which are further validated through primary mediums or industry experts, opinion leaders.

                                                                        About Report Pinnacle

                                                                        Report Pinnacle provides top-tier market research, industry intelligence, and actionable insights for finance, technology, healthcare, and consumer sectors. Our reports empower you to make informed decisions and achieve business success.

                                                                        Our expert team combines primary research, data analytics, and industry knowledge to deliver insights you can trust. We offer syndicated reports, custom research, and consulting services tailored to your unique business needs.

                                                                        At Report Pinnacle, we are committed to quality, transparency, and client satisfaction. Every report is rigorously validated to ensure accuracy and relevance. Our global perspective and local expertise help you understand both broad trends and detailed market shifts.

                                                                        Stay ahead with Report Pinnacle. Subscribe to our newsletter for the latest insights and research highlights, and follow us on social media for real-time updates.

                                                                        Report Pinnacle – Your Partner for Reaching the Top in Market Intelligence.

                                                                        Business Address

                                                                        Head Office

                                                                        Office no. A 5010, fifth floor, Solitaire Business Hub, Near Phoenix mall, Pune, Maharashtra 411014

                                                                        Contact Information

                                                                        Craig Francis

                                                                        Business Development Head

                                                                        +17162654855

                                                                        [email protected]

                                                                        Connect With Us

                                                                        Secure Payment Partners

                                                                        payment image
                                                                        RetailLogisticsPackagingAutomotiveHealthcareAgricultureEnergy & PowerFood & BeverageAerospace & DefenseChemicals & MaterialsHospitality and TourismAnimal Nutrition & WellnessConsumer Goods and ServicesReal Estate and ConstructionHome and Property ImprovementTechnology, Media and TelecomManufacturing Products and ServicesFinancial Services and Investment Intelligence

                                                                        © 2025 All rights reserved


                                                                        Privacy Policy
                                                                        Terms and Conditions
                                                                        FAQ
                                                                        • Home
                                                                        • About Us
                                                                        • Industries
                                                                          • Aerospace & Defense
                                                                          • Agriculture
                                                                          • Animal Nutrition & Wellness
                                                                          • Automotive
                                                                          • Chemicals & Materials
                                                                          • Consumer Goods and Services
                                                                          • Energy & Power
                                                                          • Financial Services and Investment Intelligence
                                                                          • Food & Beverage
                                                                          • Home and Property Improvement
                                                                          • Hospitality and Tourism
                                                                          • Logistics
                                                                          • Manufacturing Products and Services
                                                                          • Packaging
                                                                          • Professional and Commercial Services
                                                                          • Real Estate and Construction
                                                                          • Retail
                                                                          • Technology, Media and Telecom
                                                                          • Healthcare
                                                                        • Services
                                                                        • Contact
                                                                        Main Logo
                                                                        • Home
                                                                        • About Us
                                                                        • Industries
                                                                          • Aerospace & Defense
                                                                          • Agriculture
                                                                          • Animal Nutrition & Wellness
                                                                          • Automotive
                                                                          • Chemicals & Materials
                                                                          • Consumer Goods and Services
                                                                          • Energy & Power
                                                                          • Financial Services and Investment Intelligence
                                                                          • Food & Beverage
                                                                          • Home and Property Improvement
                                                                          • Hospitality and Tourism
                                                                          • Logistics
                                                                          • Manufacturing Products and Services
                                                                          • Packaging
                                                                          • Professional and Commercial Services
                                                                          • Real Estate and Construction
                                                                          • Retail
                                                                          • Technology, Media and Telecom
                                                                          • Healthcare
                                                                        • Services
                                                                        • Contact
                                                                        +17162654855
                                                                        [email protected]

                                                                        +17162654855

                                                                        [email protected]

                                                                        artwork spiralartwork spiralRelated Reports
                                                                        artwork underline

                                                                        Hydrolyzed Feather Meal Industry Drivers of Growth: Opportunities to 2033

                                                                        The hydrolyzed feather meal market is booming, projected to reach [estimated 2033 value based on CAGR] by 2033. Driven by sustainable agriculture and growing animal feed demand, this market offers lucrative opportunities. Learn about market trends, key players, and regional insights.

                                                                        July 2025
                                                                        Base Year: 2024
                                                                        No Of Pages: 234
                                                                        Price: $4750

                                                                        South America Molluscicides Market Market Outlook and Strategic Insights

                                                                        Discover the booming South American molluscicides market! This in-depth analysis reveals key trends, growth drivers, and challenges impacting the $XX million market, segmented by product type (Ferric Phosphate, Metaldehyde, etc.) and application. Learn about leading companies and projected CAGR of 3.50% through 2033.

                                                                        July 2025
                                                                        Base Year: 2024
                                                                        No Of Pages: 150
                                                                        Price: $4750

                                                                        Asia-Pacific Agricultural Biologicals Market Strategic Insights for 2025 and Forecasts to 2033: Market Trends

                                                                        The Asia-Pacific agricultural biologicals market is booming, projected to reach $XX million by 2033 with a 4% CAGR. Driven by sustainable farming trends and government initiatives, this market analysis explores key segments (biopesticides, biofertilizers), regional growth (China, India, Japan), and leading companies. Discover the opportunities and challenges in this dynamic sector.

                                                                        July 2025
                                                                        Base Year: 2024
                                                                        No Of Pages: 197
                                                                        Price: $3800

                                                                        Exploring France Seed Treatment Market Market Disruption and Innovation

                                                                        Discover the booming France seed treatment market! Learn about its €150 million valuation in 2025, 5.60% CAGR, key drivers (biological treatments, precision coating), leading companies (Syngenta, BASF, Semences de France), and future trends in this dynamic agricultural sector. Explore market segmentation and growth projections to 2033.

                                                                        July 2025
                                                                        Base Year: 2024
                                                                        No Of Pages: 197
                                                                        Price: $3800

                                                                        Brazil Crops Industry Market’s Consumer Preferences: Trends and Analysis 2025-2033

                                                                        Discover the booming Brazil crops market! Our analysis reveals a $100.13M (2025) industry projected to grow at a 2.60% CAGR through 2033, driven by soybeans, corn, and biofuels. Learn about key players, market trends, and regional insights.

                                                                        July 2025
                                                                        Base Year: 2024
                                                                        No Of Pages: 197
                                                                        Price: $3800

                                                                        India Biofertilizer Market Strategic Market Roadmap: Analysis and Forecasts 2025-2033

                                                                        Discover the booming India Biofertilizer Market! This in-depth analysis reveals a CAGR of 4% and projects significant growth to 2033, driven by sustainable farming trends and government initiatives. Explore market segments, key players, and regional insights. Learn about the opportunities and challenges shaping this vital sector.

                                                                        July 2025
                                                                        Base Year: 2024
                                                                        No Of Pages: 197
                                                                        Price: $3800

                                                                        Mexico Seed Treatment Market Insightful Market Analysis: Trends and Opportunities 2025-2033

                                                                        Discover the booming Mexico seed treatment market! This comprehensive analysis reveals a $158.20 million market in 2025, projected to grow at a 5.70% CAGR through 2033. Explore key drivers, trends, restraints, and leading companies shaping this dynamic sector. Learn more about market segmentation and growth opportunities in Mexico's agriculture sector.

                                                                        July 2025
                                                                        Base Year: 2024
                                                                        No Of Pages: 197
                                                                        Price: $3800

                                                                        Exploring Growth Avenues in Europe Blueberry Market Market

                                                                        Discover the booming European blueberry market! This in-depth analysis reveals a €8.88 billion market projected to grow at a 6.90% CAGR until 2033, driven by health trends and product diversification. Explore key players, segments, and regional insights.

                                                                        July 2025
                                                                        Base Year: 2024
                                                                        No Of Pages: 180
                                                                        Price: $4750

                                                                        Germany Fertilizer Market: Competitive Landscape and Growth Trends 2025-2033

                                                                        Discover the booming German fertilizer market! This in-depth analysis reveals a CAGR of 15.30% (2025-2033), driven by rising food demands and advanced farming techniques. Explore market segmentation, key players, and regional trends across North Rhine-Westphalia, Bavaria, and other key German states. Get the insights you need for informed decisions.

                                                                        July 2025
                                                                        Base Year: 2024
                                                                        No Of Pages: 180
                                                                        Price: $3800

                                                                        Biostimulants Market Growth Opportunities and Market Forecast 2025-2033: A Strategic Analysis

                                                                        Discover the booming biostimulants market! This in-depth analysis reveals a CAGR of 4.56%, driven by sustainable agriculture and rising food demand. Explore market segments, key players (UPL, Haifa Group, etc.), and regional growth projections (North America, Europe, Asia-Pacific) for 2025-2033. Learn how biostimulants like amino acids and seaweed extracts are transforming crop yields.

                                                                        July 2025
                                                                        Base Year: 2024
                                                                        No Of Pages: 150
                                                                        Price: $3800

                                                                        South America Quinoa Seeds Industry Strategic Dynamics: Competitor Analysis 2025-2033

                                                                        Discover the booming South American quinoa seeds market! This in-depth analysis reveals key trends, growth drivers, leading companies, and regional market shares from 2019-2033. Explore the potential of this lucrative industry with a projected CAGR of 12.50%.

                                                                        July 2025
                                                                        Base Year: 2024
                                                                        No Of Pages: 180
                                                                        Price: $4750

                                                                        Unlocking Insights for North America Biopesticides Market Growth Strategies

                                                                        The North America Biopesticides Market is booming, driven by growing demand for sustainable agriculture and stricter regulations. Discover key trends, market size projections, leading companies, and growth opportunities in this rapidly expanding sector. Explore the market's segmentation by crop type and geographic region to understand the future of biopesticides in North America.

                                                                        July 2025
                                                                        Base Year: 2024
                                                                        No Of Pages: 197
                                                                        Price: $3800

                                                                        Indonesia Agrochemical Market Consumer Behavior Dynamics: Key Trends 2025-2033

                                                                        Discover the booming Indonesian agrochemical market! This in-depth analysis reveals a CAGR of 4.09% through 2033, driven by rising food demand and government initiatives. Explore market size, segmentation, key players (BASF, Syngenta, etc.), and growth challenges. Invest wisely with our data-driven insights.

                                                                        July 2025
                                                                        Base Year: 2024
                                                                        No Of Pages: 150
                                                                        Price: $3800

                                                                        Charting Insecticides Industry Growth: CAGR Projections for 2025-2033

                                                                        The global insecticides market is booming, projected to reach $XX billion by 2033 with a 5.60% CAGR. Driven by food security needs and pest control challenges, this market analysis explores key trends, restraints, and leading companies like FMC, Bayer, and Syngenta, offering insights into application modes, crop types, and regional variations.

                                                                        July 2025
                                                                        Base Year: 2024
                                                                        No Of Pages: 197
                                                                        Price: $3800

                                                                        US Vertical Farming Market to Grow at XX CAGR: Market Size Analysis and Forecasts 2025-2033

                                                                        Discover the booming US vertical farming market! Explore its $3.56 billion (2025) valuation, 10.80% CAGR, key drivers, and leading companies. Learn about market segmentation, regional trends, and future growth projections in hydroponics, aeroponics, and aquaponics.

                                                                        July 2025
                                                                        Base Year: 2024
                                                                        No Of Pages: 150
                                                                        Price: $3800

                                                                        Europe Agricultural Enzymes Market Strategic Insights: Analysis 2025 and Forecasts 2033

                                                                        The European Agricultural Enzymes Market is booming, projected to reach €650 million by 2033 with a 10% CAGR. Driven by sustainable farming and increased food demand, this market analysis explores key trends, segments (crop protection, fertility, etc.), and leading companies like BASF and Novozymes. Discover the growth opportunities in this dynamic sector.

                                                                        July 2025
                                                                        Base Year: 2024
                                                                        No Of Pages: 197
                                                                        Price: $3800

                                                                        Europe Quinoa Seed Market Analysis 2025 and Forecasts 2033: Unveiling Growth Opportunities

                                                                        Discover the booming European quinoa seed market! This comprehensive analysis reveals key trends, growth drivers, and market segmentation from 2019-2033, including insights into major players and projected market value. Explore the rising demand for organic quinoa and its impact on the food and beverage industry.

                                                                        July 2025
                                                                        Base Year: 2024
                                                                        No Of Pages: 180
                                                                        Price: $4750

                                                                        Africa Biofertilizers Industry CAGR Growth Drivers and Trends: Forecasts 2025-2033

                                                                        Discover the booming Africa biofertilizers market, projected to reach [estimated final market size in 2033] by 2033 with a 15% CAGR. This comprehensive analysis explores key drivers, trends, restraints, and regional market shares across countries like South Africa, Nigeria, and Egypt. Learn about leading companies and investment opportunities in this sustainable agriculture sector.

                                                                        July 2025
                                                                        Base Year: 2024
                                                                        No Of Pages: 197
                                                                        Price: $3800

                                                                        Biological Seed Treatment Market Future Forecasts: Insights and Trends to 2033

                                                                        The biological seed treatment market is booming, projected to reach $1.2 billion by 2025 and growing at a CAGR of 10.80% to 2033. Driven by sustainable agriculture and innovative biotechnologies, this report analyzes market trends, key players (Bayer, Syngenta, BASF), and regional growth, offering valuable insights for investors and industry professionals. Explore the future of eco-friendly farming.

                                                                        July 2025
                                                                        Base Year: 2024
                                                                        No Of Pages: 234
                                                                        Price: $4750

                                                                        Exploring Growth Patterns in Spain Biopesticides Market Market

                                                                        Discover the booming Spain biopesticides market! This in-depth analysis reveals a €512.22 million market in 2025, projected to grow at a 5.60% CAGR until 2033. Explore key trends, drivers, restraints, and leading companies shaping this sustainable agriculture sector. Learn more about bioherbicides, bioinsecticides, and biofungicides in Spain.

                                                                        July 2025
                                                                        Base Year: 2024
                                                                        No Of Pages: 197
                                                                        Price: $3800