
Key Insights
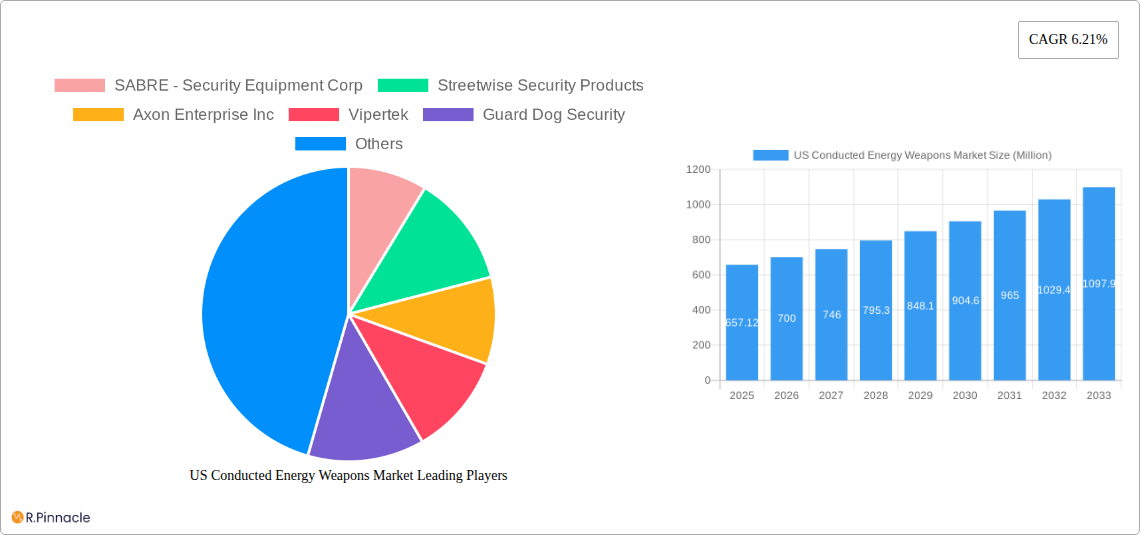
The US Conducted Energy Weapons (CEW) market, valued at $657.12 million in 2025, is projected to experience robust growth, driven by increasing demand from law enforcement agencies seeking less-lethal alternatives to firearms and a rise in personal safety concerns among civilians. The market's Compound Annual Growth Rate (CAGR) of 6.21% from 2025 to 2033 indicates a significant expansion over the forecast period. Key market segments include stun guns, tasers, and stun batons, with law enforcement agencies representing a substantial portion of end-user demand. Growth is further fueled by technological advancements in CEW technology, leading to enhanced safety features and effectiveness. However, potential restraints include stringent regulations surrounding CEW use and concerns regarding potential misuse or unintended injuries. The market is characterized by a mix of established players like Axon Enterprise Inc. and Sabre, alongside smaller niche companies catering to specific segments like personal defense. Regional analysis indicates strong growth across all US regions, with potential variations based on population density and law enforcement strategies. The historical period (2019-2024) likely saw a steady increase, forming the foundation for the projected future growth.
The market's segmentation offers opportunities for specialized product development. For instance, improved cartridge technology and smaller, more concealable devices could cater to the growing personal use segment. Furthermore, collaborations between manufacturers and law enforcement agencies to develop training programs and safety protocols could mitigate concerns about misuse and drive market expansion. The market's future trajectory depends heavily on the balance between technological advancements, regulatory landscapes, and evolving public perceptions of less-lethal force options. Continued innovation in areas such as improved accuracy, reduced risk of injury, and enhanced data recording capabilities will significantly influence the market's growth and competitiveness.
US Conducted Energy Weapons Market: A Comprehensive Report (2019-2033)
This in-depth report provides a comprehensive analysis of the US Conducted Energy Weapons (CEW) market, offering invaluable insights for industry professionals, investors, and strategic decision-makers. The report covers the period 2019-2033, with a focus on the forecast period 2025-2033 and a base year of 2025. The market is segmented by type (Stun Gun, Taser, Stun Baton), equipment type (Weapons, Cartridges), and end-user (Law Enforcement Agencies, Personal Use). Key players analyzed include SABRE - Security Equipment Corp, Streetwise Security Products, Axon Enterprise Inc, Vipertek, Guard Dog Security, PhaZZer LL, and Foxfend. The report projects a market value of xx Million by 2033, showcasing significant growth opportunities.
US Conducted Energy Weapons Market Structure & Innovation Trends
The US CEW market exhibits a moderately concentrated structure, with key players holding significant market share. Axon Enterprise Inc currently commands the largest share, estimated at xx%, followed by SABRE - Security Equipment Corp at xx%. The market is driven by continuous innovation in CEW technology, focusing on improved safety features, enhanced effectiveness, and reduced collateral damage. Regulatory frameworks, including restrictions on certain CEW types and usage, significantly influence market dynamics. Product substitutes, such as pepper spray and other non-lethal weapons, pose competitive pressure. End-user demographics show a significant demand from law enforcement agencies, driven by increasing need for non-lethal crowd control and suspect apprehension tools. M&A activities have been relatively low in recent years, with the largest deal valued at approximately xx Million in 2022. Future M&A activity is expected to increase as larger companies look to consolidate their market positions and expand their product portfolios.
US Conducted Energy Weapons Market Market Dynamics & Trends
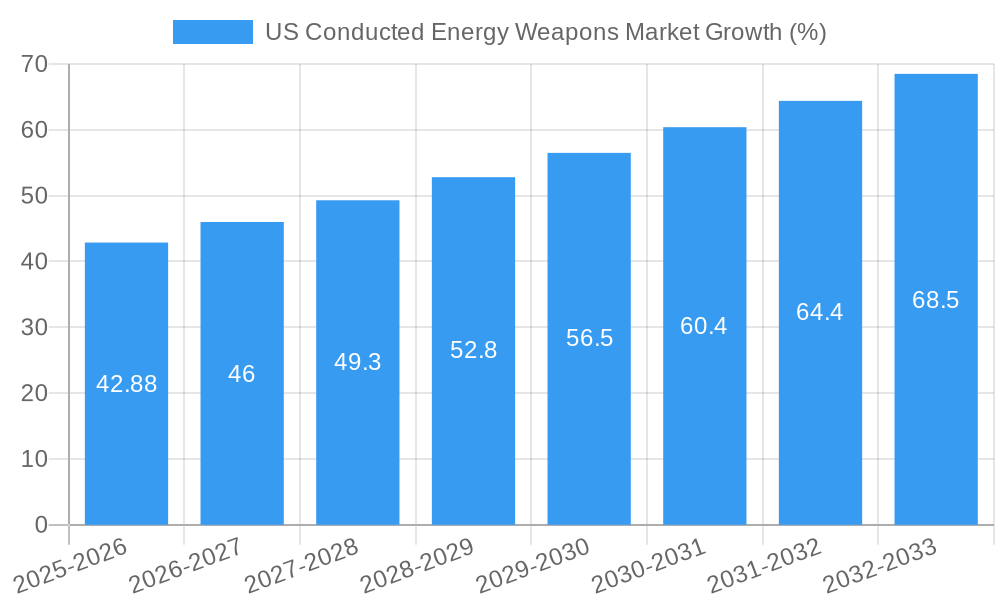
The US CEW market is experiencing robust growth, driven primarily by increasing demand from law enforcement agencies and the rising adoption of CEWs for personal safety and self-defense. The market witnessed a CAGR of xx% during the historical period (2019-2024) and is projected to maintain a CAGR of xx% during the forecast period (2025-2033). Technological advancements, such as the development of more sophisticated and user-friendly CEWs, are fueling market growth. Changing consumer preferences towards safer and more effective self-defense tools contribute to market expansion. Intense competition among established players and emerging entrants drives innovation and price optimization. Market penetration of CEWs, particularly in the personal use segment, remains relatively low, representing significant untapped potential. The adoption of advanced technologies like smart cartridges and improved data analytics further boosts the market's growth trajectory.
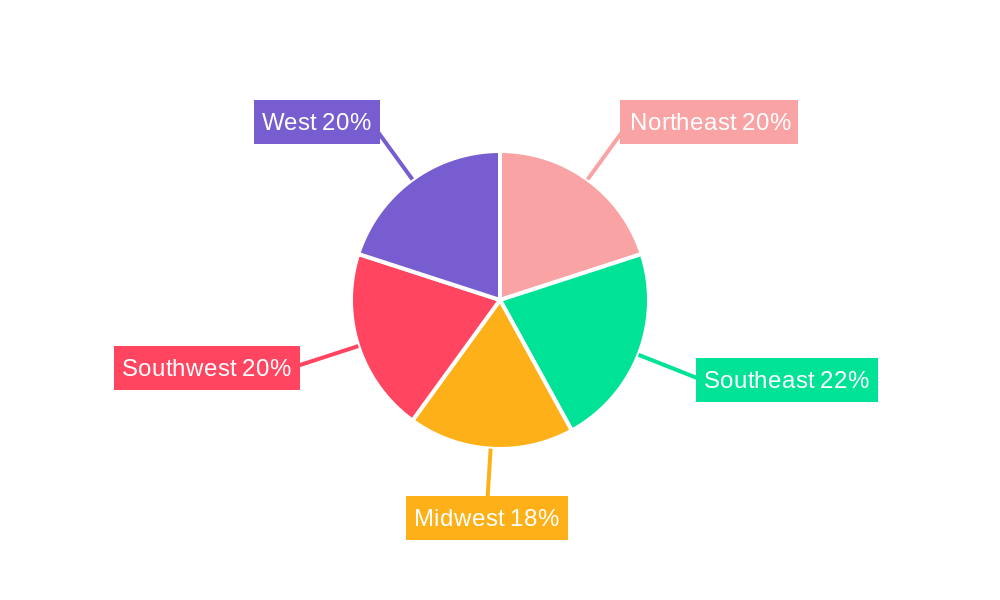
Dominant Regions & Segments in US Conducted Energy Weapons Market
The analysis shows that the highest demand for conducted energy weapons originates from urban areas in the United States. This is largely due to higher crime rates and increased need for law enforcement tools in these regions.
Key Drivers for Dominant Regions:
- High crime rates
- Increased police budgets
- Stringent law enforcement regulations
- Growing awareness regarding personal safety
Dominant Segments:
- Type: Tasers remain the dominant segment within the CEW market, owing to their effectiveness and wider acceptance amongst law enforcement agencies. Stun guns and stun batons maintain significant market share driven by their affordability and ease of use, particularly in the personal self-defense sector.
- Equipment Type: Weapons account for the majority of the market share, reflecting the demand for effective self-defense tools and law enforcement solutions. Cartridges hold a significant share and are critical for the continued operation of CEWs.
- End User: Law enforcement agencies constitute the primary end-user segment, followed by the personal use segment, which is experiencing steady growth fueled by increased consumer awareness and concerns about personal safety.
The dominance of these segments stems from the factors listed above, including government policies, law enforcement mandates, and rising personal safety awareness.
US Conducted Energy Weapons Market Product Innovations
Recent product innovations focus on enhancing the safety and effectiveness of CEWs. Manufacturers are introducing CEWs with improved ergonomics, enhanced targeting systems, and reduced risk of unintended consequences. The integration of smart technology, such as data logging and connectivity features, allows for better tracking and analysis of CEW usage. These advancements cater to both law enforcement and personal use needs, offering enhanced control and safety. The market is witnessing a gradual shift towards less-lethal options, with a focus on minimizing injury to both the suspect and the user.
Report Scope & Segmentation Analysis
This report provides a detailed analysis of the US Conducted Energy Weapons market, segmented by:
Type: Stun Guns, Tasers, Stun Batons – Each segment analysis includes market size, growth projections, and competitive landscape. The Taser segment is expected to experience the highest growth due to its effectiveness and widespread adoption.
Equipment Type: Weapons and Cartridges – This segment analysis focuses on the market size, demand trends, and price dynamics of both weapons and their associated cartridges.
End User: Law Enforcement Agencies and Personal Use – This segment analysis examines the specific needs and preferences of each end-user group and how they influence market demand and innovation. The Law Enforcement Agencies segment is projected to show higher growth due to increased adoption of CEWs in police forces.
Key Drivers of US Conducted Energy Weapons Market Growth
Several factors propel the growth of the US CEW market. Increasing crime rates and the need for effective non-lethal law enforcement tools are key drivers. Rising awareness of personal safety and self-defense needs among consumers also fuels market expansion. Technological advancements, leading to more effective and safer CEWs, further stimulate demand. Government regulations and policies supporting the use of CEWs in law enforcement also positively impact market growth.
Challenges in the US Conducted Energy Weapons Market Sector
The US CEW market faces challenges, including stringent regulatory hurdles that impact product development and market access. Supply chain disruptions can affect the availability of components and the overall production capacity. Intense competition among established players and new entrants leads to price pressures. Concerns regarding the potential for misuse and potential injuries, along with negative publicity associated with CEW use, impact market growth negatively.
Emerging Opportunities in US Conducted Energy Weapons Market
Emerging opportunities exist in the development of more advanced and sophisticated CEWs with improved safety features. The integration of smart technology offers further scope for innovation and growth. Expanding into new markets, such as private security firms and correctional facilities, presents significant potential. The growing focus on non-lethal alternatives in crowd control and law enforcement opens up new avenues for market expansion.
Leading Players in the US Conducted Energy Weapons Market Market
- SABRE - Security Equipment Corp
- Streetwise Security Products
- Axon Enterprise Inc
- Vipertek
- Guard Dog Security
- PhaZZer LL
- Foxfend
Key Developments in US Conducted Energy Weapons Market Industry
- 2023 Q2: Axon Enterprise Inc. launched a new Taser model with improved safety features.
- 2022 Q4: SABRE - Security Equipment Corp. acquired a smaller CEW manufacturer, expanding its market share.
- 2021 Q1: New regulations were introduced in California regarding CEW usage by law enforcement.
Future Outlook for US Conducted Energy Weapons Market Market
The future outlook for the US CEW market remains positive, driven by ongoing technological advancements, increased demand from both law enforcement and personal use segments, and the potential for expansion into new markets. The market is expected to witness sustained growth, fueled by the continuous development of innovative and safer CEWs. Strategic partnerships and mergers and acquisitions will likely shape the industry landscape in the coming years.
US Conducted Energy Weapons Market Segmentation
- 1. Production Analysis
- 2. Consumption Analysis
- 3. Import Market Analysis (Value & Volume)
- 4. Export Market Analysis (Value & Volume)
- 5. Price Trend Analysis
US Conducted Energy Weapons Market Segmentation By Geography
-
1. North America
- 1.1. United States
- 1.2. Canada
- 1.3. Mexico
-
2. South America
- 2.1. Brazil
- 2.2. Argentina
- 2.3. Rest of South America
-
3. Europe
- 3.1. United Kingdom
- 3.2. Germany
- 3.3. France
- 3.4. Italy
- 3.5. Spain
- 3.6. Russia
- 3.7. Benelux
- 3.8. Nordics
- 3.9. Rest of Europe
-
4. Middle East & Africa
- 4.1. Turkey
- 4.2. Israel
- 4.3. GCC
- 4.4. North Africa
- 4.5. South Africa
- 4.6. Rest of Middle East & Africa
-
5. Asia Pacific
- 5.1. China
- 5.2. India
- 5.3. Japan
- 5.4. South Korea
- 5.5. ASEAN
- 5.6. Oceania
- 5.7. Rest of Asia Pacific
US Conducted Energy Weapons Market REPORT HIGHLIGHTS
| Aspects | Details |
|---|---|
| Study Period | 2019-2033 |
| Base Year | 2024 |
| Estimated Year | 2025 |
| Forecast Period | 2025-2033 |
| Historical Period | 2019-2024 |
| Growth Rate | CAGR of 6.21% from 2019-2033 |
| Segmentation |
|
Table of Contents
- 1. Introduction
- 1.1. Research Scope
- 1.2. Market Segmentation
- 1.3. Research Methodology
- 1.4. Definitions and Assumptions
- 2. Executive Summary
- 2.1. Introduction
- 3. Market Dynamics
- 3.1. Introduction
- 3.2. Market Drivers
- 3.2.1. ; Increased Seaborne Threats And Ambiguous Maritime Security Policies; Increasing Adoption Of Security Technologies In Bric Countries
- 3.3. Market Restrains
- 3.3.1. ; High Risk Rate In Ungoverned Zones; Unstructured Security Standards And Technologies
- 3.4. Market Trends
- 3.4.1. Increasing Incidents of Civil Unrest Driving Procurement
- 4. Market Factor Analysis
- 4.1. Porters Five Forces
- 4.2. Supply/Value Chain
- 4.3. PESTEL analysis
- 4.4. Market Entropy
- 4.5. Patent/Trademark Analysis
- 5. Global US Conducted Energy Weapons Market Analysis, Insights and Forecast, 2019-2031
- 5.1. Market Analysis, Insights and Forecast - by Production Analysis
- 5.2. Market Analysis, Insights and Forecast - by Consumption Analysis
- 5.3. Market Analysis, Insights and Forecast - by Import Market Analysis (Value & Volume)
- 5.4. Market Analysis, Insights and Forecast - by Export Market Analysis (Value & Volume)
- 5.5. Market Analysis, Insights and Forecast - by Price Trend Analysis
- 5.6. Market Analysis, Insights and Forecast - by Region
- 5.6.1. North America
- 5.6.2. South America
- 5.6.3. Europe
- 5.6.4. Middle East & Africa
- 5.6.5. Asia Pacific
- 5.1. Market Analysis, Insights and Forecast - by Production Analysis
- 6. North America US Conducted Energy Weapons Market Analysis, Insights and Forecast, 2019-2031
- 6.1. Market Analysis, Insights and Forecast - by Production Analysis
- 6.2. Market Analysis, Insights and Forecast - by Consumption Analysis
- 6.3. Market Analysis, Insights and Forecast - by Import Market Analysis (Value & Volume)
- 6.4. Market Analysis, Insights and Forecast - by Export Market Analysis (Value & Volume)
- 6.5. Market Analysis, Insights and Forecast - by Price Trend Analysis
- 6.1. Market Analysis, Insights and Forecast - by Production Analysis
- 7. South America US Conducted Energy Weapons Market Analysis, Insights and Forecast, 2019-2031
- 7.1. Market Analysis, Insights and Forecast - by Production Analysis
- 7.2. Market Analysis, Insights and Forecast - by Consumption Analysis
- 7.3. Market Analysis, Insights and Forecast - by Import Market Analysis (Value & Volume)
- 7.4. Market Analysis, Insights and Forecast - by Export Market Analysis (Value & Volume)
- 7.5. Market Analysis, Insights and Forecast - by Price Trend Analysis
- 7.1. Market Analysis, Insights and Forecast - by Production Analysis
- 8. Europe US Conducted Energy Weapons Market Analysis, Insights and Forecast, 2019-2031
- 8.1. Market Analysis, Insights and Forecast - by Production Analysis
- 8.2. Market Analysis, Insights and Forecast - by Consumption Analysis
- 8.3. Market Analysis, Insights and Forecast - by Import Market Analysis (Value & Volume)
- 8.4. Market Analysis, Insights and Forecast - by Export Market Analysis (Value & Volume)
- 8.5. Market Analysis, Insights and Forecast - by Price Trend Analysis
- 8.1. Market Analysis, Insights and Forecast - by Production Analysis
- 9. Middle East & Africa US Conducted Energy Weapons Market Analysis, Insights and Forecast, 2019-2031
- 9.1. Market Analysis, Insights and Forecast - by Production Analysis
- 9.2. Market Analysis, Insights and Forecast - by Consumption Analysis
- 9.3. Market Analysis, Insights and Forecast - by Import Market Analysis (Value & Volume)
- 9.4. Market Analysis, Insights and Forecast - by Export Market Analysis (Value & Volume)
- 9.5. Market Analysis, Insights and Forecast - by Price Trend Analysis
- 9.1. Market Analysis, Insights and Forecast - by Production Analysis
- 10. Asia Pacific US Conducted Energy Weapons Market Analysis, Insights and Forecast, 2019-2031
- 10.1. Market Analysis, Insights and Forecast - by Production Analysis
- 10.2. Market Analysis, Insights and Forecast - by Consumption Analysis
- 10.3. Market Analysis, Insights and Forecast - by Import Market Analysis (Value & Volume)
- 10.4. Market Analysis, Insights and Forecast - by Export Market Analysis (Value & Volume)
- 10.5. Market Analysis, Insights and Forecast - by Price Trend Analysis
- 10.1. Market Analysis, Insights and Forecast - by Production Analysis
- 11. Northeast US Conducted Energy Weapons Market Analysis, Insights and Forecast, 2019-2031
- 12. Southeast US Conducted Energy Weapons Market Analysis, Insights and Forecast, 2019-2031
- 13. Midwest US Conducted Energy Weapons Market Analysis, Insights and Forecast, 2019-2031
- 14. Southwest US Conducted Energy Weapons Market Analysis, Insights and Forecast, 2019-2031
- 15. West US Conducted Energy Weapons Market Analysis, Insights and Forecast, 2019-2031
- 16. Competitive Analysis
- 16.1. Global Market Share Analysis 2024
- 16.2. Company Profiles
- 16.2.1 SABRE - Security Equipment Corp
- 16.2.1.1. Overview
- 16.2.1.2. Products
- 16.2.1.3. SWOT Analysis
- 16.2.1.4. Recent Developments
- 16.2.1.5. Financials (Based on Availability)
- 16.2.2 Streetwise Security Products
- 16.2.2.1. Overview
- 16.2.2.2. Products
- 16.2.2.3. SWOT Analysis
- 16.2.2.4. Recent Developments
- 16.2.2.5. Financials (Based on Availability)
- 16.2.3 Axon Enterprise Inc
- 16.2.3.1. Overview
- 16.2.3.2. Products
- 16.2.3.3. SWOT Analysis
- 16.2.3.4. Recent Developments
- 16.2.3.5. Financials (Based on Availability)
- 16.2.4 Vipertek
- 16.2.4.1. Overview
- 16.2.4.2. Products
- 16.2.4.3. SWOT Analysis
- 16.2.4.4. Recent Developments
- 16.2.4.5. Financials (Based on Availability)
- 16.2.5 Guard Dog Security
- 16.2.5.1. Overview
- 16.2.5.2. Products
- 16.2.5.3. SWOT Analysis
- 16.2.5.4. Recent Developments
- 16.2.5.5. Financials (Based on Availability)
- 16.2.6 PhaZZer LL
- 16.2.6.1. Overview
- 16.2.6.2. Products
- 16.2.6.3. SWOT Analysis
- 16.2.6.4. Recent Developments
- 16.2.6.5. Financials (Based on Availability)
- 16.2.7 Foxfend
- 16.2.7.1. Overview
- 16.2.7.2. Products
- 16.2.7.3. SWOT Analysis
- 16.2.7.4. Recent Developments
- 16.2.7.5. Financials (Based on Availability)
- 16.2.1 SABRE - Security Equipment Corp
List of Figures
- Figure 1: Global US Conducted Energy Weapons Market Revenue Breakdown (Million, %) by Region 2024 & 2032
- Figure 2: United states US Conducted Energy Weapons Market Revenue (Million), by Country 2024 & 2032
- Figure 3: United states US Conducted Energy Weapons Market Revenue Share (%), by Country 2024 & 2032
- Figure 4: North America US Conducted Energy Weapons Market Revenue (Million), by Production Analysis 2024 & 2032
- Figure 5: North America US Conducted Energy Weapons Market Revenue Share (%), by Production Analysis 2024 & 2032
- Figure 6: North America US Conducted Energy Weapons Market Revenue (Million), by Consumption Analysis 2024 & 2032
- Figure 7: North America US Conducted Energy Weapons Market Revenue Share (%), by Consumption Analysis 2024 & 2032
- Figure 8: North America US Conducted Energy Weapons Market Revenue (Million), by Import Market Analysis (Value & Volume) 2024 & 2032
- Figure 9: North America US Conducted Energy Weapons Market Revenue Share (%), by Import Market Analysis (Value & Volume) 2024 & 2032
- Figure 10: North America US Conducted Energy Weapons Market Revenue (Million), by Export Market Analysis (Value & Volume) 2024 & 2032
- Figure 11: North America US Conducted Energy Weapons Market Revenue Share (%), by Export Market Analysis (Value & Volume) 2024 & 2032
- Figure 12: North America US Conducted Energy Weapons Market Revenue (Million), by Price Trend Analysis 2024 & 2032
- Figure 13: North America US Conducted Energy Weapons Market Revenue Share (%), by Price Trend Analysis 2024 & 2032
- Figure 14: North America US Conducted Energy Weapons Market Revenue (Million), by Country 2024 & 2032
- Figure 15: North America US Conducted Energy Weapons Market Revenue Share (%), by Country 2024 & 2032
- Figure 16: South America US Conducted Energy Weapons Market Revenue (Million), by Production Analysis 2024 & 2032
- Figure 17: South America US Conducted Energy Weapons Market Revenue Share (%), by Production Analysis 2024 & 2032
- Figure 18: South America US Conducted Energy Weapons Market Revenue (Million), by Consumption Analysis 2024 & 2032
- Figure 19: South America US Conducted Energy Weapons Market Revenue Share (%), by Consumption Analysis 2024 & 2032
- Figure 20: South America US Conducted Energy Weapons Market Revenue (Million), by Import Market Analysis (Value & Volume) 2024 & 2032
- Figure 21: South America US Conducted Energy Weapons Market Revenue Share (%), by Import Market Analysis (Value & Volume) 2024 & 2032
- Figure 22: South America US Conducted Energy Weapons Market Revenue (Million), by Export Market Analysis (Value & Volume) 2024 & 2032
- Figure 23: South America US Conducted Energy Weapons Market Revenue Share (%), by Export Market Analysis (Value & Volume) 2024 & 2032
- Figure 24: South America US Conducted Energy Weapons Market Revenue (Million), by Price Trend Analysis 2024 & 2032
- Figure 25: South America US Conducted Energy Weapons Market Revenue Share (%), by Price Trend Analysis 2024 & 2032
- Figure 26: South America US Conducted Energy Weapons Market Revenue (Million), by Country 2024 & 2032
- Figure 27: South America US Conducted Energy Weapons Market Revenue Share (%), by Country 2024 & 2032
- Figure 28: Europe US Conducted Energy Weapons Market Revenue (Million), by Production Analysis 2024 & 2032
- Figure 29: Europe US Conducted Energy Weapons Market Revenue Share (%), by Production Analysis 2024 & 2032
- Figure 30: Europe US Conducted Energy Weapons Market Revenue (Million), by Consumption Analysis 2024 & 2032
- Figure 31: Europe US Conducted Energy Weapons Market Revenue Share (%), by Consumption Analysis 2024 & 2032
- Figure 32: Europe US Conducted Energy Weapons Market Revenue (Million), by Import Market Analysis (Value & Volume) 2024 & 2032
- Figure 33: Europe US Conducted Energy Weapons Market Revenue Share (%), by Import Market Analysis (Value & Volume) 2024 & 2032
- Figure 34: Europe US Conducted Energy Weapons Market Revenue (Million), by Export Market Analysis (Value & Volume) 2024 & 2032
- Figure 35: Europe US Conducted Energy Weapons Market Revenue Share (%), by Export Market Analysis (Value & Volume) 2024 & 2032
- Figure 36: Europe US Conducted Energy Weapons Market Revenue (Million), by Price Trend Analysis 2024 & 2032
- Figure 37: Europe US Conducted Energy Weapons Market Revenue Share (%), by Price Trend Analysis 2024 & 2032
- Figure 38: Europe US Conducted Energy Weapons Market Revenue (Million), by Country 2024 & 2032
- Figure 39: Europe US Conducted Energy Weapons Market Revenue Share (%), by Country 2024 & 2032
- Figure 40: Middle East & Africa US Conducted Energy Weapons Market Revenue (Million), by Production Analysis 2024 & 2032
- Figure 41: Middle East & Africa US Conducted Energy Weapons Market Revenue Share (%), by Production Analysis 2024 & 2032
- Figure 42: Middle East & Africa US Conducted Energy Weapons Market Revenue (Million), by Consumption Analysis 2024 & 2032
- Figure 43: Middle East & Africa US Conducted Energy Weapons Market Revenue Share (%), by Consumption Analysis 2024 & 2032
- Figure 44: Middle East & Africa US Conducted Energy Weapons Market Revenue (Million), by Import Market Analysis (Value & Volume) 2024 & 2032
- Figure 45: Middle East & Africa US Conducted Energy Weapons Market Revenue Share (%), by Import Market Analysis (Value & Volume) 2024 & 2032
- Figure 46: Middle East & Africa US Conducted Energy Weapons Market Revenue (Million), by Export Market Analysis (Value & Volume) 2024 & 2032
- Figure 47: Middle East & Africa US Conducted Energy Weapons Market Revenue Share (%), by Export Market Analysis (Value & Volume) 2024 & 2032
- Figure 48: Middle East & Africa US Conducted Energy Weapons Market Revenue (Million), by Price Trend Analysis 2024 & 2032
- Figure 49: Middle East & Africa US Conducted Energy Weapons Market Revenue Share (%), by Price Trend Analysis 2024 & 2032
- Figure 50: Middle East & Africa US Conducted Energy Weapons Market Revenue (Million), by Country 2024 & 2032
- Figure 51: Middle East & Africa US Conducted Energy Weapons Market Revenue Share (%), by Country 2024 & 2032
- Figure 52: Asia Pacific US Conducted Energy Weapons Market Revenue (Million), by Production Analysis 2024 & 2032
- Figure 53: Asia Pacific US Conducted Energy Weapons Market Revenue Share (%), by Production Analysis 2024 & 2032
- Figure 54: Asia Pacific US Conducted Energy Weapons Market Revenue (Million), by Consumption Analysis 2024 & 2032
- Figure 55: Asia Pacific US Conducted Energy Weapons Market Revenue Share (%), by Consumption Analysis 2024 & 2032
- Figure 56: Asia Pacific US Conducted Energy Weapons Market Revenue (Million), by Import Market Analysis (Value & Volume) 2024 & 2032
- Figure 57: Asia Pacific US Conducted Energy Weapons Market Revenue Share (%), by Import Market Analysis (Value & Volume) 2024 & 2032
- Figure 58: Asia Pacific US Conducted Energy Weapons Market Revenue (Million), by Export Market Analysis (Value & Volume) 2024 & 2032
- Figure 59: Asia Pacific US Conducted Energy Weapons Market Revenue Share (%), by Export Market Analysis (Value & Volume) 2024 & 2032
- Figure 60: Asia Pacific US Conducted Energy Weapons Market Revenue (Million), by Price Trend Analysis 2024 & 2032
- Figure 61: Asia Pacific US Conducted Energy Weapons Market Revenue Share (%), by Price Trend Analysis 2024 & 2032
- Figure 62: Asia Pacific US Conducted Energy Weapons Market Revenue (Million), by Country 2024 & 2032
- Figure 63: Asia Pacific US Conducted Energy Weapons Market Revenue Share (%), by Country 2024 & 2032
List of Tables
- Table 1: Global US Conducted Energy Weapons Market Revenue Million Forecast, by Region 2019 & 2032
- Table 2: Global US Conducted Energy Weapons Market Revenue Million Forecast, by Production Analysis 2019 & 2032
- Table 3: Global US Conducted Energy Weapons Market Revenue Million Forecast, by Consumption Analysis 2019 & 2032
- Table 4: Global US Conducted Energy Weapons Market Revenue Million Forecast, by Import Market Analysis (Value & Volume) 2019 & 2032
- Table 5: Global US Conducted Energy Weapons Market Revenue Million Forecast, by Export Market Analysis (Value & Volume) 2019 & 2032
- Table 6: Global US Conducted Energy Weapons Market Revenue Million Forecast, by Price Trend Analysis 2019 & 2032
- Table 7: Global US Conducted Energy Weapons Market Revenue Million Forecast, by Region 2019 & 2032
- Table 8: Global US Conducted Energy Weapons Market Revenue Million Forecast, by Country 2019 & 2032
- Table 9: Northeast US Conducted Energy Weapons Market Revenue (Million) Forecast, by Application 2019 & 2032
- Table 10: Southeast US Conducted Energy Weapons Market Revenue (Million) Forecast, by Application 2019 & 2032
- Table 11: Midwest US Conducted Energy Weapons Market Revenue (Million) Forecast, by Application 2019 & 2032
- Table 12: Southwest US Conducted Energy Weapons Market Revenue (Million) Forecast, by Application 2019 & 2032
- Table 13: West US Conducted Energy Weapons Market Revenue (Million) Forecast, by Application 2019 & 2032
- Table 14: Global US Conducted Energy Weapons Market Revenue Million Forecast, by Production Analysis 2019 & 2032
- Table 15: Global US Conducted Energy Weapons Market Revenue Million Forecast, by Consumption Analysis 2019 & 2032
- Table 16: Global US Conducted Energy Weapons Market Revenue Million Forecast, by Import Market Analysis (Value & Volume) 2019 & 2032
- Table 17: Global US Conducted Energy Weapons Market Revenue Million Forecast, by Export Market Analysis (Value & Volume) 2019 & 2032
- Table 18: Global US Conducted Energy Weapons Market Revenue Million Forecast, by Price Trend Analysis 2019 & 2032
- Table 19: Global US Conducted Energy Weapons Market Revenue Million Forecast, by Country 2019 & 2032
- Table 20: United States US Conducted Energy Weapons Market Revenue (Million) Forecast, by Application 2019 & 2032
- Table 21: Canada US Conducted Energy Weapons Market Revenue (Million) Forecast, by Application 2019 & 2032
- Table 22: Mexico US Conducted Energy Weapons Market Revenue (Million) Forecast, by Application 2019 & 2032
- Table 23: Global US Conducted Energy Weapons Market Revenue Million Forecast, by Production Analysis 2019 & 2032
- Table 24: Global US Conducted Energy Weapons Market Revenue Million Forecast, by Consumption Analysis 2019 & 2032
- Table 25: Global US Conducted Energy Weapons Market Revenue Million Forecast, by Import Market Analysis (Value & Volume) 2019 & 2032
- Table 26: Global US Conducted Energy Weapons Market Revenue Million Forecast, by Export Market Analysis (Value & Volume) 2019 & 2032
- Table 27: Global US Conducted Energy Weapons Market Revenue Million Forecast, by Price Trend Analysis 2019 & 2032
- Table 28: Global US Conducted Energy Weapons Market Revenue Million Forecast, by Country 2019 & 2032
- Table 29: Brazil US Conducted Energy Weapons Market Revenue (Million) Forecast, by Application 2019 & 2032
- Table 30: Argentina US Conducted Energy Weapons Market Revenue (Million) Forecast, by Application 2019 & 2032
- Table 31: Rest of South America US Conducted Energy Weapons Market Revenue (Million) Forecast, by Application 2019 & 2032
- Table 32: Global US Conducted Energy Weapons Market Revenue Million Forecast, by Production Analysis 2019 & 2032
- Table 33: Global US Conducted Energy Weapons Market Revenue Million Forecast, by Consumption Analysis 2019 & 2032
- Table 34: Global US Conducted Energy Weapons Market Revenue Million Forecast, by Import Market Analysis (Value & Volume) 2019 & 2032
- Table 35: Global US Conducted Energy Weapons Market Revenue Million Forecast, by Export Market Analysis (Value & Volume) 2019 & 2032
- Table 36: Global US Conducted Energy Weapons Market Revenue Million Forecast, by Price Trend Analysis 2019 & 2032
- Table 37: Global US Conducted Energy Weapons Market Revenue Million Forecast, by Country 2019 & 2032
- Table 38: United Kingdom US Conducted Energy Weapons Market Revenue (Million) Forecast, by Application 2019 & 2032
- Table 39: Germany US Conducted Energy Weapons Market Revenue (Million) Forecast, by Application 2019 & 2032
- Table 40: France US Conducted Energy Weapons Market Revenue (Million) Forecast, by Application 2019 & 2032
- Table 41: Italy US Conducted Energy Weapons Market Revenue (Million) Forecast, by Application 2019 & 2032
- Table 42: Spain US Conducted Energy Weapons Market Revenue (Million) Forecast, by Application 2019 & 2032
- Table 43: Russia US Conducted Energy Weapons Market Revenue (Million) Forecast, by Application 2019 & 2032
- Table 44: Benelux US Conducted Energy Weapons Market Revenue (Million) Forecast, by Application 2019 & 2032
- Table 45: Nordics US Conducted Energy Weapons Market Revenue (Million) Forecast, by Application 2019 & 2032
- Table 46: Rest of Europe US Conducted Energy Weapons Market Revenue (Million) Forecast, by Application 2019 & 2032
- Table 47: Global US Conducted Energy Weapons Market Revenue Million Forecast, by Production Analysis 2019 & 2032
- Table 48: Global US Conducted Energy Weapons Market Revenue Million Forecast, by Consumption Analysis 2019 & 2032
- Table 49: Global US Conducted Energy Weapons Market Revenue Million Forecast, by Import Market Analysis (Value & Volume) 2019 & 2032
- Table 50: Global US Conducted Energy Weapons Market Revenue Million Forecast, by Export Market Analysis (Value & Volume) 2019 & 2032
- Table 51: Global US Conducted Energy Weapons Market Revenue Million Forecast, by Price Trend Analysis 2019 & 2032
- Table 52: Global US Conducted Energy Weapons Market Revenue Million Forecast, by Country 2019 & 2032
- Table 53: Turkey US Conducted Energy Weapons Market Revenue (Million) Forecast, by Application 2019 & 2032
- Table 54: Israel US Conducted Energy Weapons Market Revenue (Million) Forecast, by Application 2019 & 2032
- Table 55: GCC US Conducted Energy Weapons Market Revenue (Million) Forecast, by Application 2019 & 2032
- Table 56: North Africa US Conducted Energy Weapons Market Revenue (Million) Forecast, by Application 2019 & 2032
- Table 57: South Africa US Conducted Energy Weapons Market Revenue (Million) Forecast, by Application 2019 & 2032
- Table 58: Rest of Middle East & Africa US Conducted Energy Weapons Market Revenue (Million) Forecast, by Application 2019 & 2032
- Table 59: Global US Conducted Energy Weapons Market Revenue Million Forecast, by Production Analysis 2019 & 2032
- Table 60: Global US Conducted Energy Weapons Market Revenue Million Forecast, by Consumption Analysis 2019 & 2032
- Table 61: Global US Conducted Energy Weapons Market Revenue Million Forecast, by Import Market Analysis (Value & Volume) 2019 & 2032
- Table 62: Global US Conducted Energy Weapons Market Revenue Million Forecast, by Export Market Analysis (Value & Volume) 2019 & 2032
- Table 63: Global US Conducted Energy Weapons Market Revenue Million Forecast, by Price Trend Analysis 2019 & 2032
- Table 64: Global US Conducted Energy Weapons Market Revenue Million Forecast, by Country 2019 & 2032
- Table 65: China US Conducted Energy Weapons Market Revenue (Million) Forecast, by Application 2019 & 2032
- Table 66: India US Conducted Energy Weapons Market Revenue (Million) Forecast, by Application 2019 & 2032
- Table 67: Japan US Conducted Energy Weapons Market Revenue (Million) Forecast, by Application 2019 & 2032
- Table 68: South Korea US Conducted Energy Weapons Market Revenue (Million) Forecast, by Application 2019 & 2032
- Table 69: ASEAN US Conducted Energy Weapons Market Revenue (Million) Forecast, by Application 2019 & 2032
- Table 70: Oceania US Conducted Energy Weapons Market Revenue (Million) Forecast, by Application 2019 & 2032
- Table 71: Rest of Asia Pacific US Conducted Energy Weapons Market Revenue (Million) Forecast, by Application 2019 & 2032
Frequently Asked Questions
1. What is the projected Compound Annual Growth Rate (CAGR) of the US Conducted Energy Weapons Market?
The projected CAGR is approximately 6.21%.
2. Which companies are prominent players in the US Conducted Energy Weapons Market?
Key companies in the market include SABRE - Security Equipment Corp, Streetwise Security Products, Axon Enterprise Inc, Vipertek, Guard Dog Security, PhaZZer LL, Foxfend.
3. What are the main segments of the US Conducted Energy Weapons Market?
The market segments include Production Analysis, Consumption Analysis, Import Market Analysis (Value & Volume), Export Market Analysis (Value & Volume), Price Trend Analysis.
4. Can you provide details about the market size?
The market size is estimated to be USD 657.12 Million as of 2022.
5. What are some drivers contributing to market growth?
; Increased Seaborne Threats And Ambiguous Maritime Security Policies; Increasing Adoption Of Security Technologies In Bric Countries.
6. What are the notable trends driving market growth?
Increasing Incidents of Civil Unrest Driving Procurement.
7. Are there any restraints impacting market growth?
; High Risk Rate In Ungoverned Zones; Unstructured Security Standards And Technologies.
8. Can you provide examples of recent developments in the market?
N/A
9. What pricing options are available for accessing the report?
Pricing options include single-user, multi-user, and enterprise licenses priced at USD 3800, USD 4500, and USD 5800 respectively.
10. Is the market size provided in terms of value or volume?
The market size is provided in terms of value, measured in Million.
11. Are there any specific market keywords associated with the report?
Yes, the market keyword associated with the report is "US Conducted Energy Weapons Market," which aids in identifying and referencing the specific market segment covered.
12. How do I determine which pricing option suits my needs best?
The pricing options vary based on user requirements and access needs. Individual users may opt for single-user licenses, while businesses requiring broader access may choose multi-user or enterprise licenses for cost-effective access to the report.
13. Are there any additional resources or data provided in the US Conducted Energy Weapons Market report?
While the report offers comprehensive insights, it's advisable to review the specific contents or supplementary materials provided to ascertain if additional resources or data are available.
14. How can I stay updated on further developments or reports in the US Conducted Energy Weapons Market?
To stay informed about further developments, trends, and reports in the US Conducted Energy Weapons Market, consider subscribing to industry newsletters, following relevant companies and organizations, or regularly checking reputable industry news sources and publications.
Methodology
Step 1 - Identification of Relevant Samples Size from Population Database


Step 2 - Approaches for Defining Global Market Size (Value, Volume* & Price*)

Note*: In applicable scenarios
Step 3 - Data Sources
Primary Research
- Web Analytics
- Survey Reports
- Research Institute
- Latest Research Reports
- Opinion Leaders
Secondary Research
- Annual Reports
- White Paper
- Latest Press Release
- Industry Association
- Paid Database
- Investor Presentations

Step 4 - Data Triangulation
Involves using different sources of information in order to increase the validity of a study
These sources are likely to be stakeholders in a program - participants, other researchers, program staff, other community members, and so on.
Then we put all data in single framework & apply various statistical tools to find out the dynamic on the market.
During the analysis stage, feedback from the stakeholder groups would be compared to determine areas of agreement as well as areas of divergence


