Growth Trajectories in US Household Battery Industry: Industry Outlook to 2033

US Household Battery Industry by Alkaline Batteries, by Lead-acid Batteries, by Lithium-ion Batteries, by Other Types, by North America (United States, Canada, Mexico), by South America (Brazil, Argentina, Rest of South America), by Europe (United Kingdom, Germany, France, Italy, Spain, Russia, Benelux, Nordics, Rest of Europe), by Middle East & Africa (Turkey, Israel, GCC, North Africa, South Africa, Rest of Middle East & Africa), by Asia Pacific (China, India, Japan, South Korea, ASEAN, Oceania, Rest of Asia Pacific) Forecast 2025-2033

Jun 27 2025
Base Year: 2024

180 Pages
Main Logo

Growth Trajectories in US Household Battery Industry: Industry Outlook to 2033


Home
Industries
Energy & Power
sponsor image
sponsor image
sponsor image
sponsor image
sponsor image

Tailored for you

  • In-depth Analysis Tailored to Specified Regions or Segments
  • Company Profiles Customized to User Preferences
  • Comprehensive Insights Focused on Specific Segments or Regions
  • Customized Evaluation of Competitive Landscape to Meet Your Needs
  • Tailored Customization to Address Other Specific Requirements
Ask for customization


Key Insights

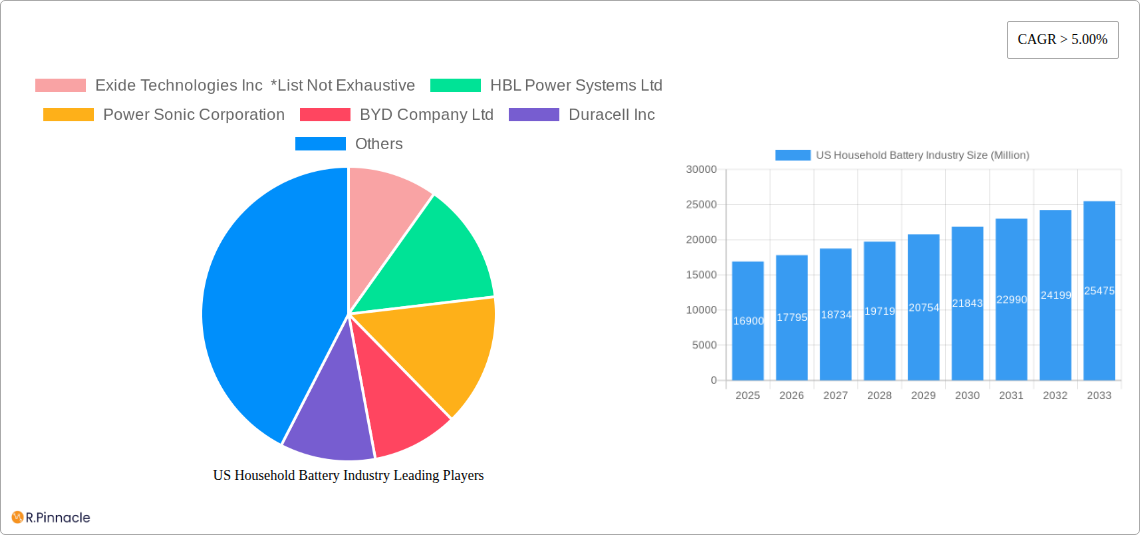
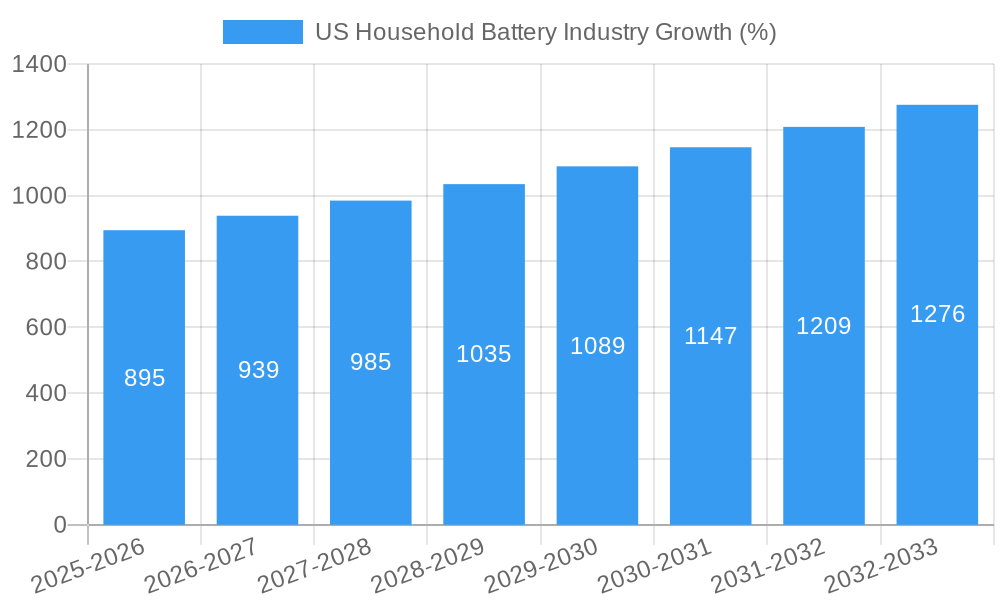
The US household battery market, valued at $16.9 billion in 2025, is projected to experience robust growth, exceeding a 5% CAGR through 2033. This expansion is driven by several key factors. The increasing adoption of portable electronic devices, such as smartphones, tablets, and wireless headphones, fuels demand for readily available replacement batteries. Simultaneously, the burgeoning electric vehicle (EV) sector, while not directly part of the household battery market, indirectly impacts demand by increasing consumer familiarity and acceptance of advanced battery technologies like lithium-ion. Furthermore, the growing emphasis on energy efficiency and the adoption of battery-powered tools and appliances in homes contribute to market expansion. The market segmentation reveals a significant share held by lithium-ion batteries due to their higher energy density and longer lifespan compared to lead-acid counterparts. Retail channels currently dominate distribution, but online sales are rapidly gaining traction, offering convenience and wider product selection. Major players like Exide Technologies, Duracell, Energizer, and Panasonic are fiercely competing, leading to continuous innovation and price optimization within the market.

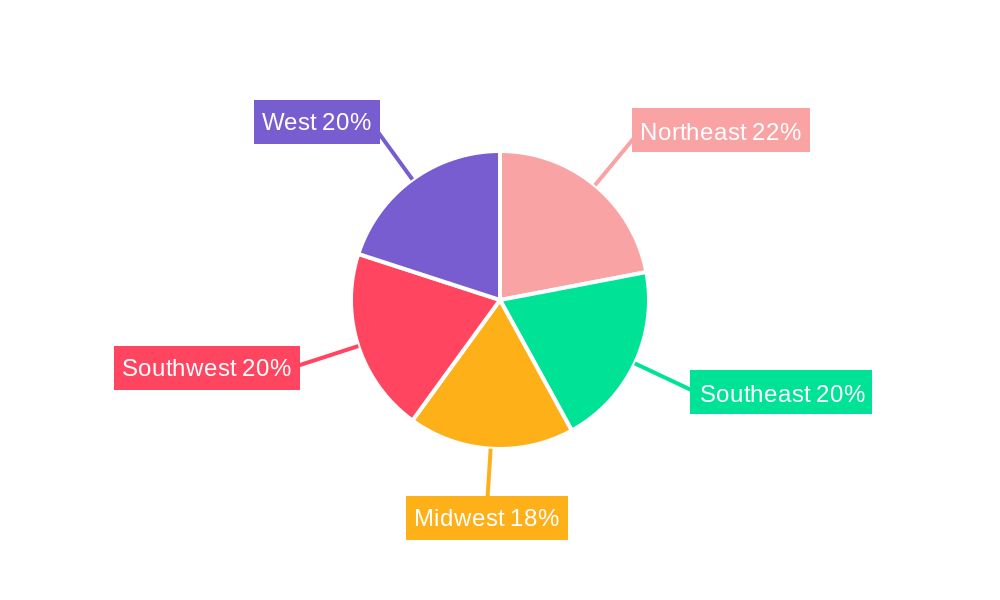
Despite the positive outlook, certain restraints exist. Fluctuations in raw material prices, particularly for critical metals used in lithium-ion batteries, pose a challenge. Environmental concerns related to battery disposal and recycling also necessitate sustainable solutions and regulations. The regional distribution shows a relatively even spread across the United States, with slight variations depending on population density and economic activity within each region (Northeast, Southeast, Midwest, Southwest, West). Continued technological advancements, particularly in battery energy density and charging speeds, will further shape the market's trajectory. Furthermore, government initiatives promoting energy efficiency and sustainable technologies can significantly influence the growth rate and adoption of eco-friendly battery options. The market's future hinges on navigating these challenges and capitalizing on the emerging opportunities presented by technological innovation and evolving consumer preferences.

This comprehensive report provides a detailed analysis of the US household battery industry, offering invaluable insights for industry professionals, investors, and strategic planners. Covering the period 2019-2033, with a base year of 2025 and a forecast period of 2025-2033, this report leverages extensive data and expert analysis to illuminate market trends, opportunities, and challenges. The report's meticulous segmentation by product type (Lead-Acid Batteries, Lithium-Ion Batteries, Other Battery Types), application (Portable Electronics, Automotive, Industrial Applications), and distribution channel (Retail, Wholesale, Online) offers granular insights into the market's dynamics.

US Household Battery Industry Research Report - Market Size, Growth & Forecast

US Household Battery Industry Market Structure & Innovation Trends

This section analyzes the competitive landscape of the US household battery market, encompassing market concentration, innovation drivers, regulatory frameworks, product substitutes, end-user demographics, and mergers and acquisitions (M&A) activities. The market is characterized by a mix of large multinational corporations and smaller specialized players. Market share data reveals a moderately concentrated market, with the top five players accounting for approximately xx% of the total market value in 2024. Innovation is driven by the demand for higher energy density, longer lifespan, and improved safety features. Stringent environmental regulations and increasing consumer awareness of sustainability are also crucial drivers.

  • Market Concentration: Top 5 players hold approximately xx% market share (2024).
  • Innovation Drivers: Higher energy density, longer lifespan, improved safety, sustainability concerns.
  • Regulatory Framework: EPA regulations on hazardous waste disposal, evolving safety standards.
  • Product Substitutes: Fuel cells, alternative energy storage technologies.
  • End-User Demographics: Growing adoption in portable electronics, increasing demand from the automotive sector.
  • M&A Activity: Significant M&A activity observed in recent years, with deal values totaling approximately USD xx billion between 2019 and 2024. Examples include [insert specific M&A examples if available, otherwise state "Examples unavailable due to data confidentiality"].
US Household Battery Industry Growth

US Household Battery Industry Market Dynamics & Trends

The US household battery market is experiencing robust growth, driven by the increasing demand for portable electronic devices, the expansion of the electric vehicle (EV) market, and the growing adoption of renewable energy sources. The Compound Annual Growth Rate (CAGR) for the period 2025-2033 is projected to be xx%, fueled by technological advancements, changing consumer preferences, and supportive government policies. The market penetration of Lithium-ion batteries is steadily increasing, driven by their superior performance characteristics. Competitive dynamics are intense, with companies focusing on product differentiation, cost reduction, and strategic partnerships.

US Household Battery Industry Growth

Dominant Regions & Segments in US Household Battery Industry

The report identifies key regional and segmental dominance within the US household battery market. The analysis reveals that [insert leading region, e.g., the Northeast] holds the largest market share, primarily due to [mention key drivers, e.g., high concentration of electronic manufacturing].

Leading Segments:

  • Product Type: Lithium-ion batteries dominate due to their high energy density and performance. Lead-acid batteries maintain a significant share in certain applications.
  • Application: The portable electronics segment leads, followed by the automotive sector, which is experiencing rapid growth due to EV adoption.
  • Distribution Channel: Retail channels account for the largest share, followed by wholesale and online channels.

Key Drivers:

  • Economic Policies: Government incentives for renewable energy and EV adoption.
  • Infrastructure Development: Expansion of charging infrastructure for EVs.
  • Technological Advancements: Continuous improvement in battery technology.

US Household Battery Industry Product Innovations

Recent product innovations focus on improving energy density, extending lifespan, enhancing safety, and reducing costs. The market is witnessing a surge in the adoption of solid-state batteries and other advanced battery technologies, offering improved performance and safety features. These innovations cater to the increasing demand for higher-performing and environmentally friendly batteries in various applications.

Report Scope & Segmentation Analysis

This report segments the US household battery market based on product type (Lead-acid, Lithium-ion, Other), application (Portable electronics, Automotive, Industrial), and distribution channel (Retail, Wholesale, Online). Each segment's growth projections, market sizes, and competitive dynamics are analyzed in detail. For example, the Lithium-ion battery segment is projected to experience the highest growth due to its superior performance, while the retail distribution channel is expected to maintain its dominance due to its wide reach.

Key Drivers of US Household Battery Industry Growth

The US household battery market's growth is propelled by several factors, including technological advancements in battery technology, increased demand for portable electronic devices and electric vehicles, and supportive government policies promoting renewable energy adoption. The Inflation Reduction Act of 2022 significantly boosted domestic battery manufacturing through substantial tax credits.

Challenges in the US Household Battery Industry Sector

The industry faces challenges such as supply chain disruptions, fluctuating raw material prices, stringent environmental regulations, and intense competition. These factors can impact profitability and constrain market growth. For example, dependence on imported raw materials creates vulnerability to geopolitical events and price volatility.

Emerging Opportunities in US Household Battery Industry

Emerging opportunities include the growing demand for energy storage solutions, the rise of electric vehicles, and the increasing adoption of renewable energy systems. Advancements in battery technology, such as solid-state batteries, present significant potential for market expansion. The development of sustainable and cost-effective battery recycling technologies offers further opportunities.

Leading Players in the US Household Battery Industry Market

  • Exide Technologies Inc
  • HBL Power Systems Ltd
  • Power Sonic Corporation
  • BYD Company Ltd
  • Duracell Inc
  • Zeus Battery Products
  • Energizer Holdings Inc
  • Panasonic Corporation
  • Rayovac (Spectrum Brands, Inc.)
  • Sony Corporation
  • Maxell Holdings, Ltd.

Key Developments in US Household Battery Industry

  • August 2022: The Inflation Reduction Act allocates over USD 60 billion for clean energy manufacturing, including USD 30 billion in production tax credits for batteries. This significantly boosts domestic battery production.
  • December 2022: The DOE awarded a USD 2.5 billion loan to Ultium Cells LLC for lithium-ion battery cell manufacturing facilities in Ohio, Tennessee, and Michigan. This investment accelerates domestic production and strengthens the US battery supply chain.

Future Outlook for US Household Battery Industry Market

The US household battery market is poised for significant growth driven by the increasing demand for energy storage, the expansion of the electric vehicle market, and continuous advancements in battery technology. Strategic investments in research and development, coupled with supportive government policies, will further accelerate market expansion, creating substantial opportunities for industry players.

US Household Battery Industry Segmentation

  • 1. Alkaline Batteries
  • 2. Lead-acid Batteries
  • 3. Lithium-ion Batteries
  • 4. Other Types

US Household Battery Industry Segmentation By Geography

  • 1. North America
    • 1.1. United States
    • 1.2. Canada
    • 1.3. Mexico
  • 2. South America
    • 2.1. Brazil
    • 2.2. Argentina
    • 2.3. Rest of South America
  • 3. Europe
    • 3.1. United Kingdom
    • 3.2. Germany
    • 3.3. France
    • 3.4. Italy
    • 3.5. Spain
    • 3.6. Russia
    • 3.7. Benelux
    • 3.8. Nordics
    • 3.9. Rest of Europe
  • 4. Middle East & Africa
    • 4.1. Turkey
    • 4.2. Israel
    • 4.3. GCC
    • 4.4. North Africa
    • 4.5. South Africa
    • 4.6. Rest of Middle East & Africa
  • 5. Asia Pacific
    • 5.1. China
    • 5.2. India
    • 5.3. Japan
    • 5.4. South Korea
    • 5.5. ASEAN
    • 5.6. Oceania
    • 5.7. Rest of Asia Pacific
US Household Battery Industry Regional Share


US Household Battery Industry REPORT HIGHLIGHTS

AspectsDetails
Study Period 2019-2033
Base Year 2024
Estimated Year 2025
Forecast Period2025-2033
Historical Period2019-2024
Growth RateCAGR of > 5.00% from 2019-2033
Segmentation
    • By Alkaline Batteries
    • By Lead-acid Batteries
    • By Lithium-ion Batteries
    • By Other Types
  • By Geography
    • North America
      • United States
      • Canada
      • Mexico
    • South America
      • Brazil
      • Argentina
      • Rest of South America
    • Europe
      • United Kingdom
      • Germany
      • France
      • Italy
      • Spain
      • Russia
      • Benelux
      • Nordics
      • Rest of Europe
    • Middle East & Africa
      • Turkey
      • Israel
      • GCC
      • North Africa
      • South Africa
      • Rest of Middle East & Africa
    • Asia Pacific
      • China
      • India
      • Japan
      • South Korea
      • ASEAN
      • Oceania
      • Rest of Asia Pacific


Table of Contents

  1. 1. Introduction
    • 1.1. Research Scope
    • 1.2. Market Segmentation
    • 1.3. Research Methodology
    • 1.4. Definitions and Assumptions
  2. 2. Executive Summary
    • 2.1. Introduction
  3. 3. Market Dynamics
    • 3.1. Introduction
      • 3.2. Market Drivers
        • 3.2.1. 4.; Increasing Investments in Water Treatment by Developing Countries4.; Growing Demand for the Various End-Use Sectors
      • 3.3. Market Restrains
        • 3.3.1. 4.; Availability of Cheap and Alternative Pumps
      • 3.4. Market Trends
        • 3.4.1. Lithium-Ion Battery to Dominate the Market
  4. 4. Market Factor Analysis
    • 4.1. Porters Five Forces
    • 4.2. Supply/Value Chain
    • 4.3. PESTEL analysis
    • 4.4. Market Entropy
    • 4.5. Patent/Trademark Analysis
  5. 5. Global US Household Battery Industry Analysis, Insights and Forecast, 2019-2031
    • 5.1. Market Analysis, Insights and Forecast - by Alkaline Batteries
      • 5.2. Market Analysis, Insights and Forecast - by Lead-acid Batteries
        • 5.3. Market Analysis, Insights and Forecast - by Lithium-ion Batteries
          • 5.4. Market Analysis, Insights and Forecast - by Other Types
            • 5.5. Market Analysis, Insights and Forecast - by Region
              • 5.5.1. North America
              • 5.5.2. South America
              • 5.5.3. Europe
              • 5.5.4. Middle East & Africa
              • 5.5.5. Asia Pacific
          • 6. North America US Household Battery Industry Analysis, Insights and Forecast, 2019-2031
            • 6.1. Market Analysis, Insights and Forecast - by Alkaline Batteries
              • 6.2. Market Analysis, Insights and Forecast - by Lead-acid Batteries
                • 6.3. Market Analysis, Insights and Forecast - by Lithium-ion Batteries
                  • 6.4. Market Analysis, Insights and Forecast - by Other Types
                  • 7. South America US Household Battery Industry Analysis, Insights and Forecast, 2019-2031
                    • 7.1. Market Analysis, Insights and Forecast - by Alkaline Batteries
                      • 7.2. Market Analysis, Insights and Forecast - by Lead-acid Batteries
                        • 7.3. Market Analysis, Insights and Forecast - by Lithium-ion Batteries
                          • 7.4. Market Analysis, Insights and Forecast - by Other Types
                          • 8. Europe US Household Battery Industry Analysis, Insights and Forecast, 2019-2031
                            • 8.1. Market Analysis, Insights and Forecast - by Alkaline Batteries
                              • 8.2. Market Analysis, Insights and Forecast - by Lead-acid Batteries
                                • 8.3. Market Analysis, Insights and Forecast - by Lithium-ion Batteries
                                  • 8.4. Market Analysis, Insights and Forecast - by Other Types
                                  • 9. Middle East & Africa US Household Battery Industry Analysis, Insights and Forecast, 2019-2031
                                    • 9.1. Market Analysis, Insights and Forecast - by Alkaline Batteries
                                      • 9.2. Market Analysis, Insights and Forecast - by Lead-acid Batteries
                                        • 9.3. Market Analysis, Insights and Forecast - by Lithium-ion Batteries
                                          • 9.4. Market Analysis, Insights and Forecast - by Other Types
                                          • 10. Asia Pacific US Household Battery Industry Analysis, Insights and Forecast, 2019-2031
                                            • 10.1. Market Analysis, Insights and Forecast - by Alkaline Batteries
                                              • 10.2. Market Analysis, Insights and Forecast - by Lead-acid Batteries
                                                • 10.3. Market Analysis, Insights and Forecast - by Lithium-ion Batteries
                                                  • 10.4. Market Analysis, Insights and Forecast - by Other Types
                                                  • 11. Northeast US Household Battery Industry Analysis, Insights and Forecast, 2019-2031
                                                    • 12. Southeast US Household Battery Industry Analysis, Insights and Forecast, 2019-2031
                                                      • 13. Midwest US Household Battery Industry Analysis, Insights and Forecast, 2019-2031
                                                        • 14. Southwest US Household Battery Industry Analysis, Insights and Forecast, 2019-2031
                                                          • 15. West US Household Battery Industry Analysis, Insights and Forecast, 2019-2031
                                                            • 16. Competitive Analysis
                                                              • 16.1. Global Market Share Analysis 2024
                                                                • 16.2. Company Profiles
                                                                  • 16.2.1 Exide Technologies Inc *List Not Exhaustive
                                                                    • 16.2.1.1. Overview
                                                                    • 16.2.1.2. Products
                                                                    • 16.2.1.3. SWOT Analysis
                                                                    • 16.2.1.4. Recent Developments
                                                                    • 16.2.1.5. Financials (Based on Availability)
                                                                  • 16.2.2 HBL Power Systems Ltd
                                                                    • 16.2.2.1. Overview
                                                                    • 16.2.2.2. Products
                                                                    • 16.2.2.3. SWOT Analysis
                                                                    • 16.2.2.4. Recent Developments
                                                                    • 16.2.2.5. Financials (Based on Availability)
                                                                  • 16.2.3 Power Sonic Corporation
                                                                    • 16.2.3.1. Overview
                                                                    • 16.2.3.2. Products
                                                                    • 16.2.3.3. SWOT Analysis
                                                                    • 16.2.3.4. Recent Developments
                                                                    • 16.2.3.5. Financials (Based on Availability)
                                                                  • 16.2.4 BYD Company Ltd
                                                                    • 16.2.4.1. Overview
                                                                    • 16.2.4.2. Products
                                                                    • 16.2.4.3. SWOT Analysis
                                                                    • 16.2.4.4. Recent Developments
                                                                    • 16.2.4.5. Financials (Based on Availability)
                                                                  • 16.2.5 Duracell Inc
                                                                    • 16.2.5.1. Overview
                                                                    • 16.2.5.2. Products
                                                                    • 16.2.5.3. SWOT Analysis
                                                                    • 16.2.5.4. Recent Developments
                                                                    • 16.2.5.5. Financials (Based on Availability)
                                                                  • 16.2.6 Zeus Battery Products
                                                                    • 16.2.6.1. Overview
                                                                    • 16.2.6.2. Products
                                                                    • 16.2.6.3. SWOT Analysis
                                                                    • 16.2.6.4. Recent Developments
                                                                    • 16.2.6.5. Financials (Based on Availability)
                                                                  • 16.2.7 Energizer Holdings Inc
                                                                    • 16.2.7.1. Overview
                                                                    • 16.2.7.2. Products
                                                                    • 16.2.7.3. SWOT Analysis
                                                                    • 16.2.7.4. Recent Developments
                                                                    • 16.2.7.5. Financials (Based on Availability)
                                                                  • 16.2.8 Panasonic Corporation
                                                                    • 16.2.8.1. Overview
                                                                    • 16.2.8.2. Products
                                                                    • 16.2.8.3. SWOT Analysis
                                                                    • 16.2.8.4. Recent Developments
                                                                    • 16.2.8.5. Financials (Based on Availability)
                                                                  • 16.2.9 Rayovac (Spectrum Brands Inc.)
                                                                    • 16.2.9.1. Overview
                                                                    • 16.2.9.2. Products
                                                                    • 16.2.9.3. SWOT Analysis
                                                                    • 16.2.9.4. Recent Developments
                                                                    • 16.2.9.5. Financials (Based on Availability)
                                                                  • 16.2.10 Sony Corporation
                                                                    • 16.2.10.1. Overview
                                                                    • 16.2.10.2. Products
                                                                    • 16.2.10.3. SWOT Analysis
                                                                    • 16.2.10.4. Recent Developments
                                                                    • 16.2.10.5. Financials (Based on Availability)
                                                                  • 16.2.11 Maxell Holdings Ltd.
                                                                    • 16.2.11.1. Overview
                                                                    • 16.2.11.2. Products
                                                                    • 16.2.11.3. SWOT Analysis
                                                                    • 16.2.11.4. Recent Developments
                                                                    • 16.2.11.5. Financials (Based on Availability)

                                                            List of Figures

                                                            1. Figure 1: Global US Household Battery Industry Revenue Breakdown (Million, %) by Region 2024 & 2032
                                                            2. Figure 2: Global US Household Battery Industry Volume Breakdown (K Tons, %) by Region 2024 & 2032
                                                            3. Figure 3: United states US Household Battery Industry Revenue (Million), by Country 2024 & 2032
                                                            4. Figure 4: United states US Household Battery Industry Volume (K Tons), by Country 2024 & 2032
                                                            5. Figure 5: United states US Household Battery Industry Revenue Share (%), by Country 2024 & 2032
                                                            6. Figure 6: United states US Household Battery Industry Volume Share (%), by Country 2024 & 2032
                                                            7. Figure 7: North America US Household Battery Industry Revenue (Million), by Alkaline Batteries 2024 & 2032
                                                            8. Figure 8: North America US Household Battery Industry Volume (K Tons), by Alkaline Batteries 2024 & 2032
                                                            9. Figure 9: North America US Household Battery Industry Revenue Share (%), by Alkaline Batteries 2024 & 2032
                                                            10. Figure 10: North America US Household Battery Industry Volume Share (%), by Alkaline Batteries 2024 & 2032
                                                            11. Figure 11: North America US Household Battery Industry Revenue (Million), by Lead-acid Batteries 2024 & 2032
                                                            12. Figure 12: North America US Household Battery Industry Volume (K Tons), by Lead-acid Batteries 2024 & 2032
                                                            13. Figure 13: North America US Household Battery Industry Revenue Share (%), by Lead-acid Batteries 2024 & 2032
                                                            14. Figure 14: North America US Household Battery Industry Volume Share (%), by Lead-acid Batteries 2024 & 2032
                                                            15. Figure 15: North America US Household Battery Industry Revenue (Million), by Lithium-ion Batteries 2024 & 2032
                                                            16. Figure 16: North America US Household Battery Industry Volume (K Tons), by Lithium-ion Batteries 2024 & 2032
                                                            17. Figure 17: North America US Household Battery Industry Revenue Share (%), by Lithium-ion Batteries 2024 & 2032
                                                            18. Figure 18: North America US Household Battery Industry Volume Share (%), by Lithium-ion Batteries 2024 & 2032
                                                            19. Figure 19: North America US Household Battery Industry Revenue (Million), by Other Types 2024 & 2032
                                                            20. Figure 20: North America US Household Battery Industry Volume (K Tons), by Other Types 2024 & 2032
                                                            21. Figure 21: North America US Household Battery Industry Revenue Share (%), by Other Types 2024 & 2032
                                                            22. Figure 22: North America US Household Battery Industry Volume Share (%), by Other Types 2024 & 2032
                                                            23. Figure 23: North America US Household Battery Industry Revenue (Million), by Country 2024 & 2032
                                                            24. Figure 24: North America US Household Battery Industry Volume (K Tons), by Country 2024 & 2032
                                                            25. Figure 25: North America US Household Battery Industry Revenue Share (%), by Country 2024 & 2032
                                                            26. Figure 26: North America US Household Battery Industry Volume Share (%), by Country 2024 & 2032
                                                            27. Figure 27: South America US Household Battery Industry Revenue (Million), by Alkaline Batteries 2024 & 2032
                                                            28. Figure 28: South America US Household Battery Industry Volume (K Tons), by Alkaline Batteries 2024 & 2032
                                                            29. Figure 29: South America US Household Battery Industry Revenue Share (%), by Alkaline Batteries 2024 & 2032
                                                            30. Figure 30: South America US Household Battery Industry Volume Share (%), by Alkaline Batteries 2024 & 2032
                                                            31. Figure 31: South America US Household Battery Industry Revenue (Million), by Lead-acid Batteries 2024 & 2032
                                                            32. Figure 32: South America US Household Battery Industry Volume (K Tons), by Lead-acid Batteries 2024 & 2032
                                                            33. Figure 33: South America US Household Battery Industry Revenue Share (%), by Lead-acid Batteries 2024 & 2032
                                                            34. Figure 34: South America US Household Battery Industry Volume Share (%), by Lead-acid Batteries 2024 & 2032
                                                            35. Figure 35: South America US Household Battery Industry Revenue (Million), by Lithium-ion Batteries 2024 & 2032
                                                            36. Figure 36: South America US Household Battery Industry Volume (K Tons), by Lithium-ion Batteries 2024 & 2032
                                                            37. Figure 37: South America US Household Battery Industry Revenue Share (%), by Lithium-ion Batteries 2024 & 2032
                                                            38. Figure 38: South America US Household Battery Industry Volume Share (%), by Lithium-ion Batteries 2024 & 2032
                                                            39. Figure 39: South America US Household Battery Industry Revenue (Million), by Other Types 2024 & 2032
                                                            40. Figure 40: South America US Household Battery Industry Volume (K Tons), by Other Types 2024 & 2032
                                                            41. Figure 41: South America US Household Battery Industry Revenue Share (%), by Other Types 2024 & 2032
                                                            42. Figure 42: South America US Household Battery Industry Volume Share (%), by Other Types 2024 & 2032
                                                            43. Figure 43: South America US Household Battery Industry Revenue (Million), by Country 2024 & 2032
                                                            44. Figure 44: South America US Household Battery Industry Volume (K Tons), by Country 2024 & 2032
                                                            45. Figure 45: South America US Household Battery Industry Revenue Share (%), by Country 2024 & 2032
                                                            46. Figure 46: South America US Household Battery Industry Volume Share (%), by Country 2024 & 2032
                                                            47. Figure 47: Europe US Household Battery Industry Revenue (Million), by Alkaline Batteries 2024 & 2032
                                                            48. Figure 48: Europe US Household Battery Industry Volume (K Tons), by Alkaline Batteries 2024 & 2032
                                                            49. Figure 49: Europe US Household Battery Industry Revenue Share (%), by Alkaline Batteries 2024 & 2032
                                                            50. Figure 50: Europe US Household Battery Industry Volume Share (%), by Alkaline Batteries 2024 & 2032
                                                            51. Figure 51: Europe US Household Battery Industry Revenue (Million), by Lead-acid Batteries 2024 & 2032
                                                            52. Figure 52: Europe US Household Battery Industry Volume (K Tons), by Lead-acid Batteries 2024 & 2032
                                                            53. Figure 53: Europe US Household Battery Industry Revenue Share (%), by Lead-acid Batteries 2024 & 2032
                                                            54. Figure 54: Europe US Household Battery Industry Volume Share (%), by Lead-acid Batteries 2024 & 2032
                                                            55. Figure 55: Europe US Household Battery Industry Revenue (Million), by Lithium-ion Batteries 2024 & 2032
                                                            56. Figure 56: Europe US Household Battery Industry Volume (K Tons), by Lithium-ion Batteries 2024 & 2032
                                                            57. Figure 57: Europe US Household Battery Industry Revenue Share (%), by Lithium-ion Batteries 2024 & 2032
                                                            58. Figure 58: Europe US Household Battery Industry Volume Share (%), by Lithium-ion Batteries 2024 & 2032
                                                            59. Figure 59: Europe US Household Battery Industry Revenue (Million), by Other Types 2024 & 2032
                                                            60. Figure 60: Europe US Household Battery Industry Volume (K Tons), by Other Types 2024 & 2032
                                                            61. Figure 61: Europe US Household Battery Industry Revenue Share (%), by Other Types 2024 & 2032
                                                            62. Figure 62: Europe US Household Battery Industry Volume Share (%), by Other Types 2024 & 2032
                                                            63. Figure 63: Europe US Household Battery Industry Revenue (Million), by Country 2024 & 2032
                                                            64. Figure 64: Europe US Household Battery Industry Volume (K Tons), by Country 2024 & 2032
                                                            65. Figure 65: Europe US Household Battery Industry Revenue Share (%), by Country 2024 & 2032
                                                            66. Figure 66: Europe US Household Battery Industry Volume Share (%), by Country 2024 & 2032
                                                            67. Figure 67: Middle East & Africa US Household Battery Industry Revenue (Million), by Alkaline Batteries 2024 & 2032
                                                            68. Figure 68: Middle East & Africa US Household Battery Industry Volume (K Tons), by Alkaline Batteries 2024 & 2032
                                                            69. Figure 69: Middle East & Africa US Household Battery Industry Revenue Share (%), by Alkaline Batteries 2024 & 2032
                                                            70. Figure 70: Middle East & Africa US Household Battery Industry Volume Share (%), by Alkaline Batteries 2024 & 2032
                                                            71. Figure 71: Middle East & Africa US Household Battery Industry Revenue (Million), by Lead-acid Batteries 2024 & 2032
                                                            72. Figure 72: Middle East & Africa US Household Battery Industry Volume (K Tons), by Lead-acid Batteries 2024 & 2032
                                                            73. Figure 73: Middle East & Africa US Household Battery Industry Revenue Share (%), by Lead-acid Batteries 2024 & 2032
                                                            74. Figure 74: Middle East & Africa US Household Battery Industry Volume Share (%), by Lead-acid Batteries 2024 & 2032
                                                            75. Figure 75: Middle East & Africa US Household Battery Industry Revenue (Million), by Lithium-ion Batteries 2024 & 2032
                                                            76. Figure 76: Middle East & Africa US Household Battery Industry Volume (K Tons), by Lithium-ion Batteries 2024 & 2032
                                                            77. Figure 77: Middle East & Africa US Household Battery Industry Revenue Share (%), by Lithium-ion Batteries 2024 & 2032
                                                            78. Figure 78: Middle East & Africa US Household Battery Industry Volume Share (%), by Lithium-ion Batteries 2024 & 2032
                                                            79. Figure 79: Middle East & Africa US Household Battery Industry Revenue (Million), by Other Types 2024 & 2032
                                                            80. Figure 80: Middle East & Africa US Household Battery Industry Volume (K Tons), by Other Types 2024 & 2032
                                                            81. Figure 81: Middle East & Africa US Household Battery Industry Revenue Share (%), by Other Types 2024 & 2032
                                                            82. Figure 82: Middle East & Africa US Household Battery Industry Volume Share (%), by Other Types 2024 & 2032
                                                            83. Figure 83: Middle East & Africa US Household Battery Industry Revenue (Million), by Country 2024 & 2032
                                                            84. Figure 84: Middle East & Africa US Household Battery Industry Volume (K Tons), by Country 2024 & 2032
                                                            85. Figure 85: Middle East & Africa US Household Battery Industry Revenue Share (%), by Country 2024 & 2032
                                                            86. Figure 86: Middle East & Africa US Household Battery Industry Volume Share (%), by Country 2024 & 2032
                                                            87. Figure 87: Asia Pacific US Household Battery Industry Revenue (Million), by Alkaline Batteries 2024 & 2032
                                                            88. Figure 88: Asia Pacific US Household Battery Industry Volume (K Tons), by Alkaline Batteries 2024 & 2032
                                                            89. Figure 89: Asia Pacific US Household Battery Industry Revenue Share (%), by Alkaline Batteries 2024 & 2032
                                                            90. Figure 90: Asia Pacific US Household Battery Industry Volume Share (%), by Alkaline Batteries 2024 & 2032
                                                            91. Figure 91: Asia Pacific US Household Battery Industry Revenue (Million), by Lead-acid Batteries 2024 & 2032
                                                            92. Figure 92: Asia Pacific US Household Battery Industry Volume (K Tons), by Lead-acid Batteries 2024 & 2032
                                                            93. Figure 93: Asia Pacific US Household Battery Industry Revenue Share (%), by Lead-acid Batteries 2024 & 2032
                                                            94. Figure 94: Asia Pacific US Household Battery Industry Volume Share (%), by Lead-acid Batteries 2024 & 2032
                                                            95. Figure 95: Asia Pacific US Household Battery Industry Revenue (Million), by Lithium-ion Batteries 2024 & 2032
                                                            96. Figure 96: Asia Pacific US Household Battery Industry Volume (K Tons), by Lithium-ion Batteries 2024 & 2032
                                                            97. Figure 97: Asia Pacific US Household Battery Industry Revenue Share (%), by Lithium-ion Batteries 2024 & 2032
                                                            98. Figure 98: Asia Pacific US Household Battery Industry Volume Share (%), by Lithium-ion Batteries 2024 & 2032
                                                            99. Figure 99: Asia Pacific US Household Battery Industry Revenue (Million), by Other Types 2024 & 2032
                                                            100. Figure 100: Asia Pacific US Household Battery Industry Volume (K Tons), by Other Types 2024 & 2032
                                                            101. Figure 101: Asia Pacific US Household Battery Industry Revenue Share (%), by Other Types 2024 & 2032
                                                            102. Figure 102: Asia Pacific US Household Battery Industry Volume Share (%), by Other Types 2024 & 2032
                                                            103. Figure 103: Asia Pacific US Household Battery Industry Revenue (Million), by Country 2024 & 2032
                                                            104. Figure 104: Asia Pacific US Household Battery Industry Volume (K Tons), by Country 2024 & 2032
                                                            105. Figure 105: Asia Pacific US Household Battery Industry Revenue Share (%), by Country 2024 & 2032
                                                            106. Figure 106: Asia Pacific US Household Battery Industry Volume Share (%), by Country 2024 & 2032

                                                            List of Tables

                                                            1. Table 1: Global US Household Battery Industry Revenue Million Forecast, by Region 2019 & 2032
                                                            2. Table 2: Global US Household Battery Industry Volume K Tons Forecast, by Region 2019 & 2032
                                                            3. Table 3: Global US Household Battery Industry Revenue Million Forecast, by Alkaline Batteries 2019 & 2032
                                                            4. Table 4: Global US Household Battery Industry Volume K Tons Forecast, by Alkaline Batteries 2019 & 2032
                                                            5. Table 5: Global US Household Battery Industry Revenue Million Forecast, by Lead-acid Batteries 2019 & 2032
                                                            6. Table 6: Global US Household Battery Industry Volume K Tons Forecast, by Lead-acid Batteries 2019 & 2032
                                                            7. Table 7: Global US Household Battery Industry Revenue Million Forecast, by Lithium-ion Batteries 2019 & 2032
                                                            8. Table 8: Global US Household Battery Industry Volume K Tons Forecast, by Lithium-ion Batteries 2019 & 2032
                                                            9. Table 9: Global US Household Battery Industry Revenue Million Forecast, by Other Types 2019 & 2032
                                                            10. Table 10: Global US Household Battery Industry Volume K Tons Forecast, by Other Types 2019 & 2032
                                                            11. Table 11: Global US Household Battery Industry Revenue Million Forecast, by Region 2019 & 2032
                                                            12. Table 12: Global US Household Battery Industry Volume K Tons Forecast, by Region 2019 & 2032
                                                            13. Table 13: Global US Household Battery Industry Revenue Million Forecast, by Country 2019 & 2032
                                                            14. Table 14: Global US Household Battery Industry Volume K Tons Forecast, by Country 2019 & 2032
                                                            15. Table 15: Northeast US Household Battery Industry Revenue (Million) Forecast, by Application 2019 & 2032
                                                            16. Table 16: Northeast US Household Battery Industry Volume (K Tons) Forecast, by Application 2019 & 2032
                                                            17. Table 17: Southeast US Household Battery Industry Revenue (Million) Forecast, by Application 2019 & 2032
                                                            18. Table 18: Southeast US Household Battery Industry Volume (K Tons) Forecast, by Application 2019 & 2032
                                                            19. Table 19: Midwest US Household Battery Industry Revenue (Million) Forecast, by Application 2019 & 2032
                                                            20. Table 20: Midwest US Household Battery Industry Volume (K Tons) Forecast, by Application 2019 & 2032
                                                            21. Table 21: Southwest US Household Battery Industry Revenue (Million) Forecast, by Application 2019 & 2032
                                                            22. Table 22: Southwest US Household Battery Industry Volume (K Tons) Forecast, by Application 2019 & 2032
                                                            23. Table 23: West US Household Battery Industry Revenue (Million) Forecast, by Application 2019 & 2032
                                                            24. Table 24: West US Household Battery Industry Volume (K Tons) Forecast, by Application 2019 & 2032
                                                            25. Table 25: Global US Household Battery Industry Revenue Million Forecast, by Alkaline Batteries 2019 & 2032
                                                            26. Table 26: Global US Household Battery Industry Volume K Tons Forecast, by Alkaline Batteries 2019 & 2032
                                                            27. Table 27: Global US Household Battery Industry Revenue Million Forecast, by Lead-acid Batteries 2019 & 2032
                                                            28. Table 28: Global US Household Battery Industry Volume K Tons Forecast, by Lead-acid Batteries 2019 & 2032
                                                            29. Table 29: Global US Household Battery Industry Revenue Million Forecast, by Lithium-ion Batteries 2019 & 2032
                                                            30. Table 30: Global US Household Battery Industry Volume K Tons Forecast, by Lithium-ion Batteries 2019 & 2032
                                                            31. Table 31: Global US Household Battery Industry Revenue Million Forecast, by Other Types 2019 & 2032
                                                            32. Table 32: Global US Household Battery Industry Volume K Tons Forecast, by Other Types 2019 & 2032
                                                            33. Table 33: Global US Household Battery Industry Revenue Million Forecast, by Country 2019 & 2032
                                                            34. Table 34: Global US Household Battery Industry Volume K Tons Forecast, by Country 2019 & 2032
                                                            35. Table 35: United States US Household Battery Industry Revenue (Million) Forecast, by Application 2019 & 2032
                                                            36. Table 36: United States US Household Battery Industry Volume (K Tons) Forecast, by Application 2019 & 2032
                                                            37. Table 37: Canada US Household Battery Industry Revenue (Million) Forecast, by Application 2019 & 2032
                                                            38. Table 38: Canada US Household Battery Industry Volume (K Tons) Forecast, by Application 2019 & 2032
                                                            39. Table 39: Mexico US Household Battery Industry Revenue (Million) Forecast, by Application 2019 & 2032
                                                            40. Table 40: Mexico US Household Battery Industry Volume (K Tons) Forecast, by Application 2019 & 2032
                                                            41. Table 41: Global US Household Battery Industry Revenue Million Forecast, by Alkaline Batteries 2019 & 2032
                                                            42. Table 42: Global US Household Battery Industry Volume K Tons Forecast, by Alkaline Batteries 2019 & 2032
                                                            43. Table 43: Global US Household Battery Industry Revenue Million Forecast, by Lead-acid Batteries 2019 & 2032
                                                            44. Table 44: Global US Household Battery Industry Volume K Tons Forecast, by Lead-acid Batteries 2019 & 2032
                                                            45. Table 45: Global US Household Battery Industry Revenue Million Forecast, by Lithium-ion Batteries 2019 & 2032
                                                            46. Table 46: Global US Household Battery Industry Volume K Tons Forecast, by Lithium-ion Batteries 2019 & 2032
                                                            47. Table 47: Global US Household Battery Industry Revenue Million Forecast, by Other Types 2019 & 2032
                                                            48. Table 48: Global US Household Battery Industry Volume K Tons Forecast, by Other Types 2019 & 2032
                                                            49. Table 49: Global US Household Battery Industry Revenue Million Forecast, by Country 2019 & 2032
                                                            50. Table 50: Global US Household Battery Industry Volume K Tons Forecast, by Country 2019 & 2032
                                                            51. Table 51: Brazil US Household Battery Industry Revenue (Million) Forecast, by Application 2019 & 2032
                                                            52. Table 52: Brazil US Household Battery Industry Volume (K Tons) Forecast, by Application 2019 & 2032
                                                            53. Table 53: Argentina US Household Battery Industry Revenue (Million) Forecast, by Application 2019 & 2032
                                                            54. Table 54: Argentina US Household Battery Industry Volume (K Tons) Forecast, by Application 2019 & 2032
                                                            55. Table 55: Rest of South America US Household Battery Industry Revenue (Million) Forecast, by Application 2019 & 2032
                                                            56. Table 56: Rest of South America US Household Battery Industry Volume (K Tons) Forecast, by Application 2019 & 2032
                                                            57. Table 57: Global US Household Battery Industry Revenue Million Forecast, by Alkaline Batteries 2019 & 2032
                                                            58. Table 58: Global US Household Battery Industry Volume K Tons Forecast, by Alkaline Batteries 2019 & 2032
                                                            59. Table 59: Global US Household Battery Industry Revenue Million Forecast, by Lead-acid Batteries 2019 & 2032
                                                            60. Table 60: Global US Household Battery Industry Volume K Tons Forecast, by Lead-acid Batteries 2019 & 2032
                                                            61. Table 61: Global US Household Battery Industry Revenue Million Forecast, by Lithium-ion Batteries 2019 & 2032
                                                            62. Table 62: Global US Household Battery Industry Volume K Tons Forecast, by Lithium-ion Batteries 2019 & 2032
                                                            63. Table 63: Global US Household Battery Industry Revenue Million Forecast, by Other Types 2019 & 2032
                                                            64. Table 64: Global US Household Battery Industry Volume K Tons Forecast, by Other Types 2019 & 2032
                                                            65. Table 65: Global US Household Battery Industry Revenue Million Forecast, by Country 2019 & 2032
                                                            66. Table 66: Global US Household Battery Industry Volume K Tons Forecast, by Country 2019 & 2032
                                                            67. Table 67: United Kingdom US Household Battery Industry Revenue (Million) Forecast, by Application 2019 & 2032
                                                            68. Table 68: United Kingdom US Household Battery Industry Volume (K Tons) Forecast, by Application 2019 & 2032
                                                            69. Table 69: Germany US Household Battery Industry Revenue (Million) Forecast, by Application 2019 & 2032
                                                            70. Table 70: Germany US Household Battery Industry Volume (K Tons) Forecast, by Application 2019 & 2032
                                                            71. Table 71: France US Household Battery Industry Revenue (Million) Forecast, by Application 2019 & 2032
                                                            72. Table 72: France US Household Battery Industry Volume (K Tons) Forecast, by Application 2019 & 2032
                                                            73. Table 73: Italy US Household Battery Industry Revenue (Million) Forecast, by Application 2019 & 2032
                                                            74. Table 74: Italy US Household Battery Industry Volume (K Tons) Forecast, by Application 2019 & 2032
                                                            75. Table 75: Spain US Household Battery Industry Revenue (Million) Forecast, by Application 2019 & 2032
                                                            76. Table 76: Spain US Household Battery Industry Volume (K Tons) Forecast, by Application 2019 & 2032
                                                            77. Table 77: Russia US Household Battery Industry Revenue (Million) Forecast, by Application 2019 & 2032
                                                            78. Table 78: Russia US Household Battery Industry Volume (K Tons) Forecast, by Application 2019 & 2032
                                                            79. Table 79: Benelux US Household Battery Industry Revenue (Million) Forecast, by Application 2019 & 2032
                                                            80. Table 80: Benelux US Household Battery Industry Volume (K Tons) Forecast, by Application 2019 & 2032
                                                            81. Table 81: Nordics US Household Battery Industry Revenue (Million) Forecast, by Application 2019 & 2032
                                                            82. Table 82: Nordics US Household Battery Industry Volume (K Tons) Forecast, by Application 2019 & 2032
                                                            83. Table 83: Rest of Europe US Household Battery Industry Revenue (Million) Forecast, by Application 2019 & 2032
                                                            84. Table 84: Rest of Europe US Household Battery Industry Volume (K Tons) Forecast, by Application 2019 & 2032
                                                            85. Table 85: Global US Household Battery Industry Revenue Million Forecast, by Alkaline Batteries 2019 & 2032
                                                            86. Table 86: Global US Household Battery Industry Volume K Tons Forecast, by Alkaline Batteries 2019 & 2032
                                                            87. Table 87: Global US Household Battery Industry Revenue Million Forecast, by Lead-acid Batteries 2019 & 2032
                                                            88. Table 88: Global US Household Battery Industry Volume K Tons Forecast, by Lead-acid Batteries 2019 & 2032
                                                            89. Table 89: Global US Household Battery Industry Revenue Million Forecast, by Lithium-ion Batteries 2019 & 2032
                                                            90. Table 90: Global US Household Battery Industry Volume K Tons Forecast, by Lithium-ion Batteries 2019 & 2032
                                                            91. Table 91: Global US Household Battery Industry Revenue Million Forecast, by Other Types 2019 & 2032
                                                            92. Table 92: Global US Household Battery Industry Volume K Tons Forecast, by Other Types 2019 & 2032
                                                            93. Table 93: Global US Household Battery Industry Revenue Million Forecast, by Country 2019 & 2032
                                                            94. Table 94: Global US Household Battery Industry Volume K Tons Forecast, by Country 2019 & 2032
                                                            95. Table 95: Turkey US Household Battery Industry Revenue (Million) Forecast, by Application 2019 & 2032
                                                            96. Table 96: Turkey US Household Battery Industry Volume (K Tons) Forecast, by Application 2019 & 2032
                                                            97. Table 97: Israel US Household Battery Industry Revenue (Million) Forecast, by Application 2019 & 2032
                                                            98. Table 98: Israel US Household Battery Industry Volume (K Tons) Forecast, by Application 2019 & 2032
                                                            99. Table 99: GCC US Household Battery Industry Revenue (Million) Forecast, by Application 2019 & 2032
                                                            100. Table 100: GCC US Household Battery Industry Volume (K Tons) Forecast, by Application 2019 & 2032
                                                            101. Table 101: North Africa US Household Battery Industry Revenue (Million) Forecast, by Application 2019 & 2032
                                                            102. Table 102: North Africa US Household Battery Industry Volume (K Tons) Forecast, by Application 2019 & 2032
                                                            103. Table 103: South Africa US Household Battery Industry Revenue (Million) Forecast, by Application 2019 & 2032
                                                            104. Table 104: South Africa US Household Battery Industry Volume (K Tons) Forecast, by Application 2019 & 2032
                                                            105. Table 105: Rest of Middle East & Africa US Household Battery Industry Revenue (Million) Forecast, by Application 2019 & 2032
                                                            106. Table 106: Rest of Middle East & Africa US Household Battery Industry Volume (K Tons) Forecast, by Application 2019 & 2032
                                                            107. Table 107: Global US Household Battery Industry Revenue Million Forecast, by Alkaline Batteries 2019 & 2032
                                                            108. Table 108: Global US Household Battery Industry Volume K Tons Forecast, by Alkaline Batteries 2019 & 2032
                                                            109. Table 109: Global US Household Battery Industry Revenue Million Forecast, by Lead-acid Batteries 2019 & 2032
                                                            110. Table 110: Global US Household Battery Industry Volume K Tons Forecast, by Lead-acid Batteries 2019 & 2032
                                                            111. Table 111: Global US Household Battery Industry Revenue Million Forecast, by Lithium-ion Batteries 2019 & 2032
                                                            112. Table 112: Global US Household Battery Industry Volume K Tons Forecast, by Lithium-ion Batteries 2019 & 2032
                                                            113. Table 113: Global US Household Battery Industry Revenue Million Forecast, by Other Types 2019 & 2032
                                                            114. Table 114: Global US Household Battery Industry Volume K Tons Forecast, by Other Types 2019 & 2032
                                                            115. Table 115: Global US Household Battery Industry Revenue Million Forecast, by Country 2019 & 2032
                                                            116. Table 116: Global US Household Battery Industry Volume K Tons Forecast, by Country 2019 & 2032
                                                            117. Table 117: China US Household Battery Industry Revenue (Million) Forecast, by Application 2019 & 2032
                                                            118. Table 118: China US Household Battery Industry Volume (K Tons) Forecast, by Application 2019 & 2032
                                                            119. Table 119: India US Household Battery Industry Revenue (Million) Forecast, by Application 2019 & 2032
                                                            120. Table 120: India US Household Battery Industry Volume (K Tons) Forecast, by Application 2019 & 2032
                                                            121. Table 121: Japan US Household Battery Industry Revenue (Million) Forecast, by Application 2019 & 2032
                                                            122. Table 122: Japan US Household Battery Industry Volume (K Tons) Forecast, by Application 2019 & 2032
                                                            123. Table 123: South Korea US Household Battery Industry Revenue (Million) Forecast, by Application 2019 & 2032
                                                            124. Table 124: South Korea US Household Battery Industry Volume (K Tons) Forecast, by Application 2019 & 2032
                                                            125. Table 125: ASEAN US Household Battery Industry Revenue (Million) Forecast, by Application 2019 & 2032
                                                            126. Table 126: ASEAN US Household Battery Industry Volume (K Tons) Forecast, by Application 2019 & 2032
                                                            127. Table 127: Oceania US Household Battery Industry Revenue (Million) Forecast, by Application 2019 & 2032
                                                            128. Table 128: Oceania US Household Battery Industry Volume (K Tons) Forecast, by Application 2019 & 2032
                                                            129. Table 129: Rest of Asia Pacific US Household Battery Industry Revenue (Million) Forecast, by Application 2019 & 2032
                                                            130. Table 130: Rest of Asia Pacific US Household Battery Industry Volume (K Tons) Forecast, by Application 2019 & 2032


                                                            Frequently Asked Questions

                                                            1. What is the projected Compound Annual Growth Rate (CAGR) of the US Household Battery Industry?

                                                            The projected CAGR is approximately > 5.00%.

                                                            2. Which companies are prominent players in the US Household Battery Industry?

                                                            Key companies in the market include Exide Technologies Inc *List Not Exhaustive, HBL Power Systems Ltd, Power Sonic Corporation, BYD Company Ltd, Duracell Inc, Zeus Battery Products, Energizer Holdings Inc, Panasonic Corporation, Rayovac (Spectrum Brands, Inc.) , Sony Corporation, Maxell Holdings, Ltd..

                                                            3. What are the main segments of the US Household Battery Industry?

                                                            The market segments include Alkaline Batteries, Lead-acid Batteries, Lithium-ion Batteries, Other Types.

                                                            4. Can you provide details about the market size?

                                                            The market size is estimated to be USD 16900 Million as of 2022.

                                                            5. What are some drivers contributing to market growth?

                                                            4.; Increasing Investments in Water Treatment by Developing Countries4.; Growing Demand for the Various End-Use Sectors.

                                                            6. What are the notable trends driving market growth?

                                                            Lithium-Ion Battery to Dominate the Market.

                                                            7. Are there any restraints impacting market growth?

                                                            4.; Availability of Cheap and Alternative Pumps.

                                                            8. Can you provide examples of recent developments in the market?

                                                            December 2022: The US Department of Energy (DOE) announced the conclusion of a USD 2.5 billion loan to Ultium Cells LLC to assist in financing the building of new lithium-ion battery cell manufacturing facilities in Ohio, Tennessee, and Michigan through its Loan Programs Office (LPO). The three facilities will be managed by Ultium Cells, a joint venture between General Motors and LG Energy Solution.

                                                            9. What pricing options are available for accessing the report?

                                                            Pricing options include single-user, multi-user, and enterprise licenses priced at USD 3800, USD 4500, and USD 5800 respectively.

                                                            10. Is the market size provided in terms of value or volume?

                                                            The market size is provided in terms of value, measured in Million and volume, measured in K Tons.

                                                            11. Are there any specific market keywords associated with the report?

                                                            Yes, the market keyword associated with the report is "US Household Battery Industry," which aids in identifying and referencing the specific market segment covered.

                                                            12. How do I determine which pricing option suits my needs best?

                                                            The pricing options vary based on user requirements and access needs. Individual users may opt for single-user licenses, while businesses requiring broader access may choose multi-user or enterprise licenses for cost-effective access to the report.

                                                            13. Are there any additional resources or data provided in the US Household Battery Industry report?

                                                            While the report offers comprehensive insights, it's advisable to review the specific contents or supplementary materials provided to ascertain if additional resources or data are available.

                                                            14. How can I stay updated on further developments or reports in the US Household Battery Industry?

                                                            To stay informed about further developments, trends, and reports in the US Household Battery Industry, consider subscribing to industry newsletters, following relevant companies and organizations, or regularly checking reputable industry news sources and publications.


                                                            Methodology

                                                            Step 1 - Identification of Relevant Samples Size from Population Database

                                                            Step Chart
                                                            Bar Chart
                                                            Method Chart

                                                            Step 2 - Approaches for Defining Global Market Size (Value, Volume* & Price*)

                                                            Approach Chart
                                                            Top-down and bottom-up approaches are used to validate the global market size and estimate the market size for manufactures, regional segments, product, and application.

                                                            Note*: In applicable scenarios

                                                            Step 3 - Data Sources

                                                            Primary Research

                                                            • Web Analytics
                                                            • Survey Reports
                                                            • Research Institute
                                                            • Latest Research Reports
                                                            • Opinion Leaders

                                                            Secondary Research

                                                            • Annual Reports
                                                            • White Paper
                                                            • Latest Press Release
                                                            • Industry Association
                                                            • Paid Database
                                                            • Investor Presentations
                                                            Analyst Chart

                                                            Step 4 - Data Triangulation

                                                            Involves using different sources of information in order to increase the validity of a study

                                                            These sources are likely to be stakeholders in a program - participants, other researchers, program staff, other community members, and so on.

                                                            Then we put all data in single framework & apply various statistical tools to find out the dynamic on the market.

                                                            During the analysis stage, feedback from the stakeholder groups would be compared to determine areas of agreement as well as areas of divergence

                                                            Additionally, after gathering mixed and scattered data from a wide range of sources, data is triangulated and correlated to come up with estimated figures which are further validated through primary mediums or industry experts, opinion leaders.

                                                            About Report Pinnacle

                                                            Report Pinnacle provides top-tier market research, industry intelligence, and actionable insights for finance, technology, healthcare, and consumer sectors. Our reports empower you to make informed decisions and achieve business success.

                                                            Our expert team combines primary research, data analytics, and industry knowledge to deliver insights you can trust. We offer syndicated reports, custom research, and consulting services tailored to your unique business needs.

                                                            At Report Pinnacle, we are committed to quality, transparency, and client satisfaction. Every report is rigorously validated to ensure accuracy and relevance. Our global perspective and local expertise help you understand both broad trends and detailed market shifts.

                                                            Stay ahead with Report Pinnacle. Subscribe to our newsletter for the latest insights and research highlights, and follow us on social media for real-time updates.

                                                            Report Pinnacle – Your Partner for Reaching the Top in Market Intelligence.

                                                            artwork spiralartwork spiralRelated Reports
                                                            artwork underline

                                                            Solar Industry in Canada Growth Projections: Trends to Watch

                                                            Discover the booming Canadian solar industry! Explore market size projections, growth trends (CAGR >11%), key players, and regional breakdowns for 2025-2033. Learn about the driving forces behind this renewable energy sector's expansion in Canada.

                                                            July 2025
                                                            Base Year: 2024
                                                            No Of Pages: 197
                                                            Price: $3800

                                                            Unlocking Growth in Asia-Pacific Battery Recycling Market Market 2025-2033

                                                            The Asia-Pacific battery recycling market is booming, driven by EV growth and environmental regulations. Learn about market size, CAGR, key players (Exide, GS Yuasa, CATL), and regional trends in our comprehensive analysis. Discover the opportunities and challenges shaping this rapidly expanding sector.

                                                            July 2025
                                                            Base Year: 2024
                                                            No Of Pages: 234
                                                            Price: $4750

                                                            Comprehensive Review of North America Oil and Gas Electric Submersible Pump Industry Growth Potential

                                                            Discover the booming North American oil and gas electric submersible pump (ESP) market. This comprehensive analysis reveals a CAGR exceeding 7%, driven by enhanced oil recovery, shale gas production, and technological advancements. Explore market size, key players (Schlumberger, Halliburton, Baker Hughes), and regional trends through 2033.

                                                            July 2025
                                                            Base Year: 2024
                                                            No Of Pages: 234
                                                            Price: $4750

                                                            Microgrid Industry Navigating Dynamics Comprehensive Analysis and Forecasts 2025-2033

                                                            Discover the booming microgrid market! Our analysis reveals a $15.92B market in 2025, growing at a 19.08% CAGR. Explore key drivers, trends, restraints, and regional insights for this rapidly expanding sector. Learn about leading companies and investment opportunities in renewable energy, remote power systems, and smart grid technologies.

                                                            July 2025
                                                            Base Year: 2024
                                                            No Of Pages: 234
                                                            Price: $4750

                                                            Strategic Projections for Turkmenistan Oil & Gas Upstream Industry Market Expansion

                                                            Discover the growth potential of Turkmenistan's oil & gas upstream industry. This comprehensive analysis reveals market size, CAGR, key players (Dragon Oil, CNPC), and future trends impacting this evolving sector from 2019-2033. Explore challenges and opportunities in onshore & offshore segments.

                                                            July 2025
                                                            Base Year: 2024
                                                            No Of Pages: 197
                                                            Price: $3800

                                                            Dosing System Industry XX CAGR Growth Analysis 2025-2033

                                                            Discover the booming dosing system market! Our analysis reveals a $7.46B market in 2025, projected to grow at a CAGR of 4.92% until 2033, driven by water treatment, oil & gas, and chemical processing. Explore market trends, key players (ProMinent, Nikkiso, IDEX), and regional insights.

                                                            July 2025
                                                            Base Year: 2024
                                                            No Of Pages: 180
                                                            Price: $4750

                                                            Europe Large Wind Turbine Market XX CAGR Growth Outlook 2025-2033

                                                            Discover the booming European large wind turbine market! This in-depth analysis reveals a €4.27B market in 2025, projected to grow at a 10.77% CAGR until 2033, driven by renewable energy targets and technological advancements. Explore key players, regional trends, and future growth opportunities in this dynamic sector.

                                                            July 2025
                                                            Base Year: 2024
                                                            No Of Pages: 234
                                                            Price: $4750

                                                            Oman Directional Drilling Industry CAGR Growth Drivers and Trends: Forecasts 2025-2033

                                                            Discover the booming Oman directional drilling market, projected to reach [estimated 2033 value] by 2033 with a CAGR exceeding 20.48%. This in-depth analysis explores market drivers, trends, restraints, and key players shaping this lucrative sector. Learn about onshore vs. offshore drilling, RSS technology, and investment opportunities in Oman's energy sector.

                                                            July 2025
                                                            Base Year: 2024
                                                            No Of Pages: 197
                                                            Price: $3800

                                                            Mexico Wireline Services Market: Disruptive Technologies Driving Market Growth 2025-2033

                                                            Discover the growth trajectory of the Mexico wireline services market, projected to reach $XX million by 2033 with a 3% CAGR. This in-depth analysis covers market drivers, trends, restraints, key players (SGS S.A., Baker Hughes, Schlumberger), and segmentations (electric line, slick line, onshore, offshore). Learn about the opportunities and challenges in this dynamic sector.

                                                            July 2025
                                                            Base Year: 2024
                                                            No Of Pages: 197
                                                            Price: $3800

                                                            Unlocking the Future of China Bunker Fuel Market: Growth and Trends 2025-2033

                                                            Discover the booming China bunker fuel market projected to surge beyond $XX million by 2033, driven by maritime trade growth and evolving environmental regulations. This in-depth analysis explores market size, CAGR, key players (Sinopec, Cosco, China Merchants), fuel types (VLSFO, HSFO, MGO), and future trends.

                                                            July 2025
                                                            Base Year: 2024
                                                            No Of Pages: 197
                                                            Price: $3800

                                                            Power Market Market Analysis and Forecasts

                                                            Discover the booming global power market, projected to reach $XX million by 2033 with a 4.89% CAGR. This comprehensive analysis explores key drivers, trends (renewable energy surge!), restraints, and regional breakdowns, featuring insights from top players like Engie and State Grid. Learn about the future of power generation.

                                                            July 2025
                                                            Base Year: 2024
                                                            No Of Pages: 234
                                                            Price: $4750

                                                            Asia-Pacific Rooftop Solar Industry Unlocking Growth Potential: Analysis and Forecasts 2025-2033

                                                            The Asia-Pacific rooftop solar market is booming, with a CAGR exceeding 16%! Discover key trends, growth drivers, and leading companies shaping this dynamic industry. Explore market size forecasts until 2033 for China, India, Japan, and more.

                                                            July 2025
                                                            Base Year: 2024
                                                            No Of Pages: 234
                                                            Price: $4750

                                                            Solar Energy Industry in Middle East Insights: Growth at XX CAGR Through 2033

                                                            Discover the booming Middle East solar energy market! This in-depth analysis reveals a CAGR exceeding 11%, driven by government initiatives, falling costs, and technological advancements. Explore market size projections, regional breakdowns, key players, and future trends in solar PV and CSP.

                                                            July 2025
                                                            Base Year: 2024
                                                            No Of Pages: 234
                                                            Price: $4750

                                                            Czech Republic Solar Energy Market Market Disruption: Competitor Insights and Trends 2025-2033

                                                            Discover the booming Czech Republic solar energy market forecast to 2033! This analysis reveals a $1.2 billion USD market in 2025, projected for 5% CAGR growth, driven by government incentives and decreasing PV system costs. Learn about key players, market segments, and future trends in this detailed report.

                                                            July 2025
                                                            Base Year: 2024
                                                            No Of Pages: 197
                                                            Price: $3800

                                                            Malaysia Power Generation EPC Market Industry’s Growth Dynamics and Insights

                                                            Discover the booming Malaysia Power Generation EPC market. This in-depth analysis reveals a CAGR exceeding 4%, driven by renewable energy investments and surging energy demand. Explore market size, segmentation, key players, and future growth projections for 2025-2033.

                                                            July 2025
                                                            Base Year: 2024
                                                            No Of Pages: 197
                                                            Price: $3800

                                                            Wind Turbine Rotor Blade Market Market’s Evolutionary Trends 2025-2033

                                                            The booming wind turbine rotor blade market is projected to exceed [estimated 2033 value] by 2033, driven by renewable energy demand and technological advancements. Explore key trends, leading companies (Vestas, Siemens Gamesa, GE), and regional growth opportunities in our comprehensive market analysis.

                                                            July 2025
                                                            Base Year: 2024
                                                            No Of Pages: 234
                                                            Price: $4750

                                                            Strategic Vision for China LNG Market Industry Trends

                                                            Discover the booming China LNG market analysis, showcasing a CAGR exceeding 7% and projected growth to 2033. Explore market drivers, trends, and key players shaping this dynamic sector, including China Suntien Green Energy, Shell, and Sinopec. Learn about the expanding LNG infrastructure and regional market share.

                                                            July 2025
                                                            Base Year: 2024
                                                            No Of Pages: 197
                                                            Price: $3800

                                                            Asia-Pacific Industrial Battery Market Unlocking Growth Potential: Analysis and Forecasts 2025-2033

                                                            The Asia-Pacific industrial battery market is booming, with a CAGR exceeding 9.21%. This in-depth analysis explores market size, key drivers (like the rise of e-commerce and data centers), trends (lithium-ion adoption), restraints, and leading companies. Discover the future of industrial batteries in the Asia-Pacific region.

                                                            July 2025
                                                            Base Year: 2024
                                                            No Of Pages: 234
                                                            Price: $4750

                                                            Decoding Market Trends in UK Wind Power Industry: 2025-2033 Analysis

                                                            The UK wind power industry is booming, with a projected market size exceeding £27 billion by 2033. Discover key market trends, growth drivers, and leading companies shaping this dynamic sector. Learn about onshore and offshore wind power opportunities and challenges in the UK market.

                                                            July 2025
                                                            Base Year: 2024
                                                            No Of Pages: 197
                                                            Price: $3800

                                                            Solar Roadways Market 2025-2033: Preparing for Growth and Change

                                                            Discover the booming solar roadways market, projected to reach $1.6 billion by 2033 with a 24.6% CAGR. This in-depth analysis explores market drivers, trends, restraints, key players (Onyx Solar, Suntech Power), and regional growth opportunities in North America, Europe, and Asia. Learn about the potential of monocrystalline and polycrystalline silicon applications in driveways and parking lots.

                                                            July 2025
                                                            Base Year: 2024
                                                            No Of Pages: 234
                                                            Price: $4750

                                                            Business Address

                                                            Head Office

                                                            Office no. A 5010, fifth floor, Solitaire Business Hub, Near Phoenix mall, Pune, Maharashtra 411014

                                                            Contact Information

                                                            Craig Francis

                                                            Business Development Head

                                                            +17162654855

                                                            [email protected]

                                                            Connect With Us

                                                            Secure Payment Partners

                                                            payment image
                                                            RetailLogisticsPackagingAutomotiveHealthcareAgricultureEnergy & PowerFood & BeverageAerospace & DefenseChemicals & MaterialsHospitality and TourismAnimal Nutrition & WellnessConsumer Goods and ServicesReal Estate and ConstructionHome and Property ImprovementTechnology, Media and TelecomManufacturing Products and ServicesFinancial Services and Investment Intelligence

                                                            © 2025 All rights reserved


                                                            Privacy Policy
                                                            Terms and Conditions
                                                            FAQ
                                                            • Home
                                                            • About Us
                                                            • Industries
                                                              • Aerospace & Defense
                                                              • Agriculture
                                                              • Animal Nutrition & Wellness
                                                              • Automotive
                                                              • Chemicals & Materials
                                                              • Consumer Goods and Services
                                                              • Energy & Power
                                                              • Financial Services and Investment Intelligence
                                                              • Food & Beverage
                                                              • Home and Property Improvement
                                                              • Hospitality and Tourism
                                                              • Logistics
                                                              • Manufacturing Products and Services
                                                              • Packaging
                                                              • Professional and Commercial Services
                                                              • Real Estate and Construction
                                                              • Retail
                                                              • Technology, Media and Telecom
                                                              • Healthcare
                                                            • Services
                                                            • Contact
                                                            Main Logo
                                                            • Home
                                                            • About Us
                                                            • Industries
                                                              • Aerospace & Defense
                                                              • Agriculture
                                                              • Animal Nutrition & Wellness
                                                              • Automotive
                                                              • Chemicals & Materials
                                                              • Consumer Goods and Services
                                                              • Energy & Power
                                                              • Financial Services and Investment Intelligence
                                                              • Food & Beverage
                                                              • Home and Property Improvement
                                                              • Hospitality and Tourism
                                                              • Logistics
                                                              • Manufacturing Products and Services
                                                              • Packaging
                                                              • Professional and Commercial Services
                                                              • Real Estate and Construction
                                                              • Retail
                                                              • Technology, Media and Telecom
                                                              • Healthcare
                                                            • Services
                                                            • Contact
                                                            +17162654855
                                                            [email protected]

                                                            +17162654855

                                                            [email protected]