
Key Insights
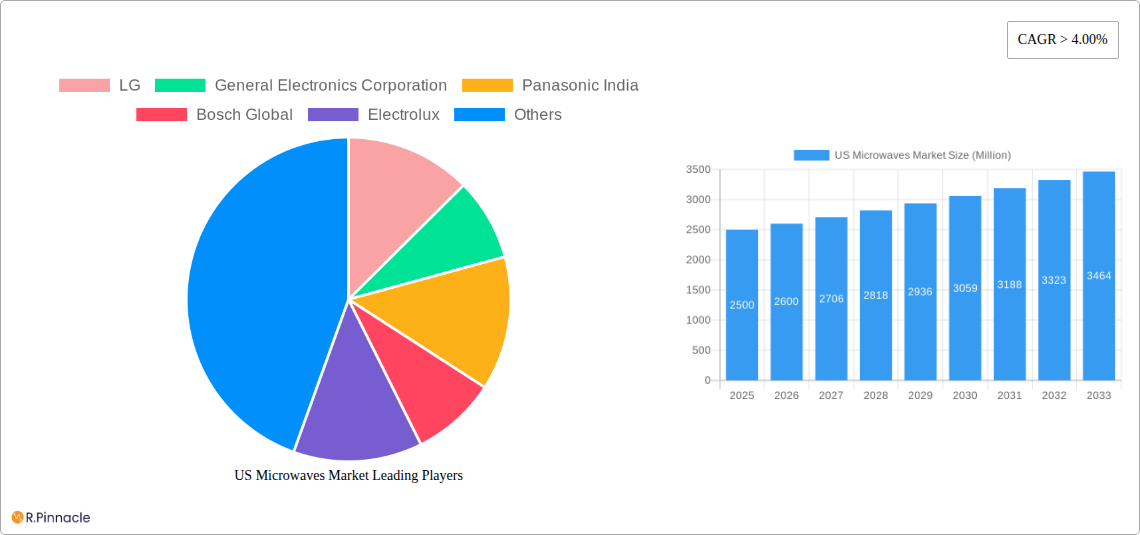
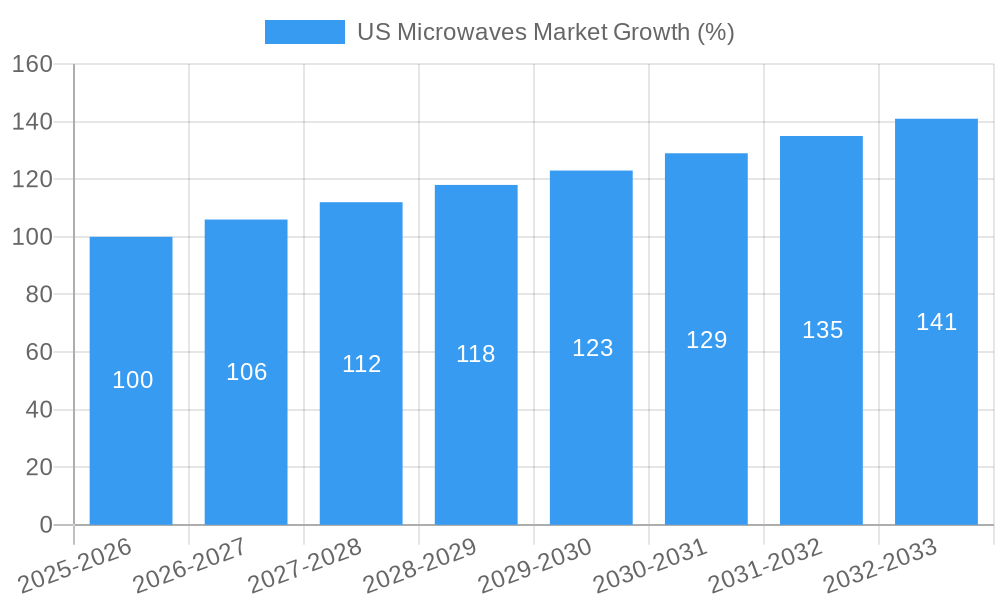
The US microwave oven market, valued at approximately $2.5 billion in 2025, is projected to experience robust growth, exceeding a 4% CAGR through 2033. This expansion is fueled by several key drivers. The increasing prevalence of busy lifestyles and the demand for quick and convenient meal preparation are significantly boosting microwave adoption, particularly among younger demographics. Furthermore, technological advancements, such as the introduction of smart microwaves with advanced features like Wi-Fi connectivity and recipe integration, are driving premiumization and expanding market appeal. The shift towards smaller household sizes and compact living spaces is also contributing to the demand for countertop models. Growth is further facilitated by continuous improvements in energy efficiency and design innovations that enhance functionality and aesthetics. Segmentation reveals that the counter-top microwave segment dominates, followed closely by built-in units. E-commerce channels are playing a crucial role in market expansion, offering consumers increased convenience and access to a wider variety of models and brands. However, the market faces constraints such as increasing competition from other cooking appliances and potential concerns about the health impacts of microwave radiation, though these are generally considered to be minor in the context of overall market growth. Major players like LG, Samsung, and Whirlpool are actively competing through product innovation and strategic marketing campaigns.
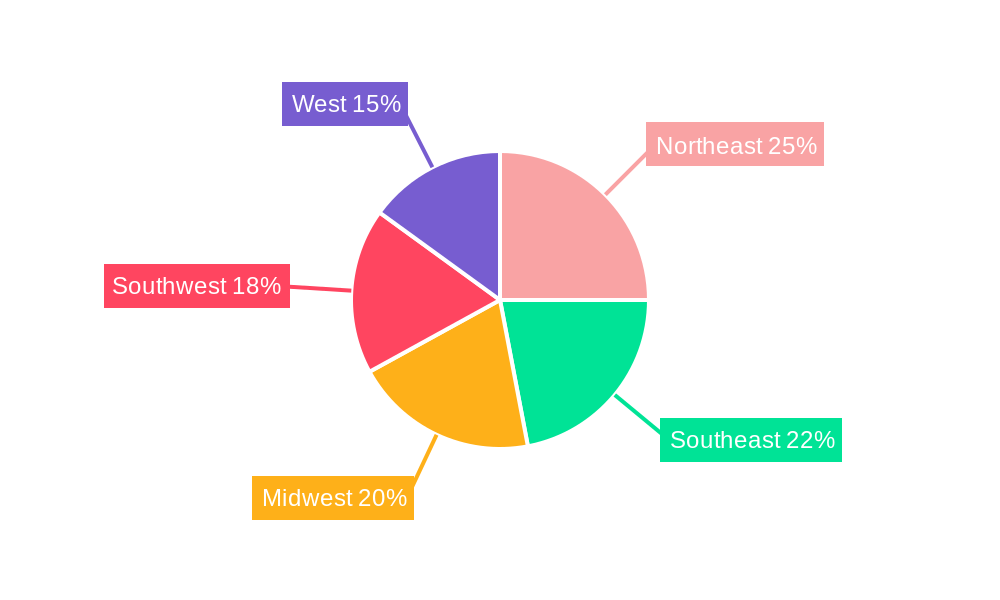
The regional breakdown shows substantial demand across all US regions, with variations based on population density and economic factors. The Northeast and West Coast, known for their high population densities and higher disposable incomes, likely represent the largest market segments. The Midwest and South show promising growth potential driven by increasing urbanization and changing consumer preferences. The competitive landscape is characterized by established brands focusing on differentiating their products based on features, pricing, and distribution channels. While established players currently dominate, smaller niche players and innovative startups are gradually emerging, creating a dynamic and evolving market. Continued growth is expected to be supported by ongoing technological improvements, increased consumer disposable income, and a steadfast demand for convenient and time-saving kitchen appliances.
US Microwaves Market Report: 2019-2033
This comprehensive report provides an in-depth analysis of the US Microwaves Market, offering invaluable insights for industry professionals, investors, and strategic decision-makers. The study covers the period 2019-2033, with 2025 as the base year and forecasts extending to 2033. Key market segments, including distribution channels, microwave types, structures, and end-users, are meticulously examined to reveal growth opportunities and potential challenges. Leading players such as LG, General Electronics Corporation, Panasonic India, Bosch Global, Electrolux, Haier, Whirlpool, IFB, Hitachi, and Samsung are profiled, highlighting their market share, strategies, and competitive dynamics.
US Microwaves Market Market Structure & Innovation Trends
The US microwave market exhibits a moderately consolidated structure, with key players holding significant market share. LG, Samsung, and Whirlpool collectively account for approximately xx% of the market (2024 data). Innovation is driven by consumer demand for advanced features, energy efficiency, and smart capabilities. Regulatory frameworks concerning energy consumption and safety standards significantly influence product design and market entry. The primary product substitutes include conventional ovens and countertop air fryers, impacting market growth. End-user demographics, particularly the growing millennial and Gen Z populations with their preference for convenience, are shaping market demand. Recent M&A activity has been relatively low, with the largest deal valued at approximately xx Million in 2022.
- Market Concentration: Moderately consolidated, with top 3 players holding xx% market share (2024).
- Innovation Drivers: Smart features, energy efficiency, compact designs.
- Regulatory Framework: Energy efficiency standards, safety regulations.
- Product Substitutes: Conventional ovens, air fryers.
- M&A Activity: Limited activity, largest deal valued at xx Million in 2022.
US Microwaves Market Market Dynamics & Trends
The US microwave market is projected to experience a Compound Annual Growth Rate (CAGR) of xx% during the forecast period (2025-2033). This growth is fueled by several key factors: increasing disposable incomes, rising demand for convenient cooking solutions, and the proliferation of smart home appliances. Technological disruptions, including the integration of IoT capabilities and advanced cooking technologies (e.g., sensor-based cooking), are further driving market expansion. Consumer preferences are shifting towards energy-efficient, multi-functional microwaves with features such as convection and grill options. Competitive dynamics are intense, with established players focusing on product innovation and differentiation while new entrants leverage cost-effective manufacturing and online distribution channels. Market penetration of smart microwaves is currently estimated at xx% and projected to reach xx% by 2033.
Dominant Regions & Segments in US Microwaves Market
The Northeast and West Coast regions dominate the US microwave market due to higher household incomes and a preference for convenient cooking solutions. Within distribution channels, E-commerce is experiencing the fastest growth, driven by the increasing adoption of online shopping and convenience. The convection microwave segment holds the largest market share due to its versatile cooking capabilities. Built-in microwaves are popular in high-end residential settings, while countertop models dominate the commercial sector. Residential end-users account for the largest portion of the market.
Key Drivers of Regional Dominance (Northeast & West Coast): Higher disposable incomes, urban population density, higher adoption of online shopping.
Key Drivers of Segment Dominance (E-commerce, Convection, Built-in (Residential)): Online shopping convenience, versatile cooking capabilities, premium features.
Detailed Dominance Analysis: The dominance of the Northeast and West Coast is attributed to higher average household incomes and increased adoption of convenient cooking methods. E-commerce is experiencing significant growth due to the ease of online purchase and increased reach. The growing popularity of convection microwaves stems from their ability to offer a wider range of cooking options. The dominance of built-in models in residential sectors shows a preference for integrated appliances and seamless kitchen design. The significant share of residential end-users underscores the prevalence of microwave use in households.
US Microwaves Market Product Innovations
Recent product innovations focus on enhanced cooking precision, smart connectivity features, and energy efficiency improvements. Manufacturers are integrating sensors and advanced algorithms to optimize cooking times and reduce energy waste. The market is also seeing the emergence of microwaves with integrated air frying capabilities, catering to the growing demand for healthier cooking options. These innovations aim to create a more user-friendly and versatile microwave experience, tailored to modern consumer needs.
Report Scope & Segmentation Analysis
This report segments the US microwaves market based on distribution channel (Multi-brand Stores, Exclusive Stores, E-commerce, Other Distribution Channel), type (Convection, Grill, Solo), structure (Built-in, Counter Top), and end-user (Residential, Commercial). Each segment’s growth projection, market size, and competitive landscape are analyzed in detail. For example, the E-commerce segment is projected to experience a significant CAGR due to online retail’s growing popularity. Similarly, the convection microwave segment is anticipated to maintain its large market share due to its versatility.
Key Drivers of US Microwaves Market Growth
The US microwave market's growth is propelled by several factors: rising disposable incomes enabling consumers to purchase premium appliances, increasing urbanization and smaller living spaces boosting the demand for compact appliances, and technological advancements improving cooking precision and convenience. Government initiatives promoting energy efficiency also contribute significantly.
Challenges in the US Microwaves Market Sector
Key challenges include intense competition among established and emerging players, fluctuating raw material costs impacting manufacturing expenses, and stringent safety and energy efficiency regulations impacting production costs. Supply chain disruptions caused by geopolitical events can also lead to production delays and increased pricing.
Emerging Opportunities in US Microwaves Market
Emerging opportunities lie in the integration of smart home technology, the growing demand for health-conscious cooking options, and the expansion into niche markets such as commercial food services. Development of eco-friendly materials and sustainable manufacturing processes represent significant growth potential.
Leading Players in the US Microwaves Market Market
- LG
- General Electronics Corporation
- Panasonic India
- Bosch Global
- Electrolux
- Haier
- Whirlpool
- IFB
- Hitachi
- Samsung
Key Developments in US Microwaves Market Industry
- October 2022: LG launched its new line of smart microwaves with integrated air frying capabilities.
- March 2023: Samsung introduced a new energy-efficient microwave model compliant with the latest energy standards.
- June 2024: Whirlpool announced a strategic partnership with a leading smart home technology provider.
Future Outlook for US Microwaves Market Market
The US microwave market is poised for continued growth, driven by technological advancements, evolving consumer preferences, and the expanding smart home ecosystem. Strategic partnerships, product diversification, and focus on sustainability will be crucial for success in the years to come. The market's growth trajectory indicates a strong potential for both established and emerging players.
US Microwaves Market Segmentation
-
1. Type
- 1.1. Convection
- 1.2. Grill
- 1.3. Solo
-
2. Structure
- 2.1. Built-in
- 2.2. Counter Top
-
3. End Users
- 3.1. Residential
- 3.2. Commercial
-
4. Distribution Channel
- 4.1. Multi-brand Stores
- 4.2. Exclusive Stores
- 4.3. E-Commerce
- 4.4. Other Distribution Channel
US Microwaves Market Segmentation By Geography
-
1. North America
- 1.1. United States
- 1.2. Canada
- 1.3. Mexico
-
2. South America
- 2.1. Brazil
- 2.2. Argentina
- 2.3. Rest of South America
-
3. Europe
- 3.1. United Kingdom
- 3.2. Germany
- 3.3. France
- 3.4. Italy
- 3.5. Spain
- 3.6. Russia
- 3.7. Benelux
- 3.8. Nordics
- 3.9. Rest of Europe
-
4. Middle East & Africa
- 4.1. Turkey
- 4.2. Israel
- 4.3. GCC
- 4.4. North Africa
- 4.5. South Africa
- 4.6. Rest of Middle East & Africa
-
5. Asia Pacific
- 5.1. China
- 5.2. India
- 5.3. Japan
- 5.4. South Korea
- 5.5. ASEAN
- 5.6. Oceania
- 5.7. Rest of Asia Pacific
US Microwaves Market REPORT HIGHLIGHTS
| Aspects | Details |
|---|---|
| Study Period | 2019-2033 |
| Base Year | 2024 |
| Estimated Year | 2025 |
| Forecast Period | 2025-2033 |
| Historical Period | 2019-2024 |
| Growth Rate | CAGR of > 4.00% from 2019-2033 |
| Segmentation |
|
Table of Contents
- 1. Introduction
- 1.1. Research Scope
- 1.2. Market Segmentation
- 1.3. Research Methodology
- 1.4. Definitions and Assumptions
- 2. Executive Summary
- 2.1. Introduction
- 3. Market Dynamics
- 3.1. Introduction
- 3.2. Market Drivers
- 3.2.1. Increasing Urbanization is Driving the Market; Increase in Usage of Smart Kitchen Appliances is Driving the Market
- 3.3. Market Restrains
- 3.3.1. High Power Consumption
- 3.4. Market Trends
- 3.4.1. Increase in Urbanization Demands for Microwable Foods
- 4. Market Factor Analysis
- 4.1. Porters Five Forces
- 4.2. Supply/Value Chain
- 4.3. PESTEL analysis
- 4.4. Market Entropy
- 4.5. Patent/Trademark Analysis
- 5. Global US Microwaves Market Analysis, Insights and Forecast, 2019-2031
- 5.1. Market Analysis, Insights and Forecast - by Type
- 5.1.1. Convection
- 5.1.2. Grill
- 5.1.3. Solo
- 5.2. Market Analysis, Insights and Forecast - by Structure
- 5.2.1. Built-in
- 5.2.2. Counter Top
- 5.3. Market Analysis, Insights and Forecast - by End Users
- 5.3.1. Residential
- 5.3.2. Commercial
- 5.4. Market Analysis, Insights and Forecast - by Distribution Channel
- 5.4.1. Multi-brand Stores
- 5.4.2. Exclusive Stores
- 5.4.3. E-Commerce
- 5.4.4. Other Distribution Channel
- 5.5. Market Analysis, Insights and Forecast - by Region
- 5.5.1. North America
- 5.5.2. South America
- 5.5.3. Europe
- 5.5.4. Middle East & Africa
- 5.5.5. Asia Pacific
- 5.1. Market Analysis, Insights and Forecast - by Type
- 6. North America US Microwaves Market Analysis, Insights and Forecast, 2019-2031
- 6.1. Market Analysis, Insights and Forecast - by Type
- 6.1.1. Convection
- 6.1.2. Grill
- 6.1.3. Solo
- 6.2. Market Analysis, Insights and Forecast - by Structure
- 6.2.1. Built-in
- 6.2.2. Counter Top
- 6.3. Market Analysis, Insights and Forecast - by End Users
- 6.3.1. Residential
- 6.3.2. Commercial
- 6.4. Market Analysis, Insights and Forecast - by Distribution Channel
- 6.4.1. Multi-brand Stores
- 6.4.2. Exclusive Stores
- 6.4.3. E-Commerce
- 6.4.4. Other Distribution Channel
- 6.1. Market Analysis, Insights and Forecast - by Type
- 7. South America US Microwaves Market Analysis, Insights and Forecast, 2019-2031
- 7.1. Market Analysis, Insights and Forecast - by Type
- 7.1.1. Convection
- 7.1.2. Grill
- 7.1.3. Solo
- 7.2. Market Analysis, Insights and Forecast - by Structure
- 7.2.1. Built-in
- 7.2.2. Counter Top
- 7.3. Market Analysis, Insights and Forecast - by End Users
- 7.3.1. Residential
- 7.3.2. Commercial
- 7.4. Market Analysis, Insights and Forecast - by Distribution Channel
- 7.4.1. Multi-brand Stores
- 7.4.2. Exclusive Stores
- 7.4.3. E-Commerce
- 7.4.4. Other Distribution Channel
- 7.1. Market Analysis, Insights and Forecast - by Type
- 8. Europe US Microwaves Market Analysis, Insights and Forecast, 2019-2031
- 8.1. Market Analysis, Insights and Forecast - by Type
- 8.1.1. Convection
- 8.1.2. Grill
- 8.1.3. Solo
- 8.2. Market Analysis, Insights and Forecast - by Structure
- 8.2.1. Built-in
- 8.2.2. Counter Top
- 8.3. Market Analysis, Insights and Forecast - by End Users
- 8.3.1. Residential
- 8.3.2. Commercial
- 8.4. Market Analysis, Insights and Forecast - by Distribution Channel
- 8.4.1. Multi-brand Stores
- 8.4.2. Exclusive Stores
- 8.4.3. E-Commerce
- 8.4.4. Other Distribution Channel
- 8.1. Market Analysis, Insights and Forecast - by Type
- 9. Middle East & Africa US Microwaves Market Analysis, Insights and Forecast, 2019-2031
- 9.1. Market Analysis, Insights and Forecast - by Type
- 9.1.1. Convection
- 9.1.2. Grill
- 9.1.3. Solo
- 9.2. Market Analysis, Insights and Forecast - by Structure
- 9.2.1. Built-in
- 9.2.2. Counter Top
- 9.3. Market Analysis, Insights and Forecast - by End Users
- 9.3.1. Residential
- 9.3.2. Commercial
- 9.4. Market Analysis, Insights and Forecast - by Distribution Channel
- 9.4.1. Multi-brand Stores
- 9.4.2. Exclusive Stores
- 9.4.3. E-Commerce
- 9.4.4. Other Distribution Channel
- 9.1. Market Analysis, Insights and Forecast - by Type
- 10. Asia Pacific US Microwaves Market Analysis, Insights and Forecast, 2019-2031
- 10.1. Market Analysis, Insights and Forecast - by Type
- 10.1.1. Convection
- 10.1.2. Grill
- 10.1.3. Solo
- 10.2. Market Analysis, Insights and Forecast - by Structure
- 10.2.1. Built-in
- 10.2.2. Counter Top
- 10.3. Market Analysis, Insights and Forecast - by End Users
- 10.3.1. Residential
- 10.3.2. Commercial
- 10.4. Market Analysis, Insights and Forecast - by Distribution Channel
- 10.4.1. Multi-brand Stores
- 10.4.2. Exclusive Stores
- 10.4.3. E-Commerce
- 10.4.4. Other Distribution Channel
- 10.1. Market Analysis, Insights and Forecast - by Type
- 11. Northeast US Microwaves Market Analysis, Insights and Forecast, 2019-2031
- 12. Southeast US Microwaves Market Analysis, Insights and Forecast, 2019-2031
- 13. Midwest US Microwaves Market Analysis, Insights and Forecast, 2019-2031
- 14. Southwest US Microwaves Market Analysis, Insights and Forecast, 2019-2031
- 15. West US Microwaves Market Analysis, Insights and Forecast, 2019-2031
- 16. Competitive Analysis
- 16.1. Global Market Share Analysis 2024
- 16.2. Company Profiles
- 16.2.1 LG
- 16.2.1.1. Overview
- 16.2.1.2. Products
- 16.2.1.3. SWOT Analysis
- 16.2.1.4. Recent Developments
- 16.2.1.5. Financials (Based on Availability)
- 16.2.2 General Electronics Corporation
- 16.2.2.1. Overview
- 16.2.2.2. Products
- 16.2.2.3. SWOT Analysis
- 16.2.2.4. Recent Developments
- 16.2.2.5. Financials (Based on Availability)
- 16.2.3 Panasonic India
- 16.2.3.1. Overview
- 16.2.3.2. Products
- 16.2.3.3. SWOT Analysis
- 16.2.3.4. Recent Developments
- 16.2.3.5. Financials (Based on Availability)
- 16.2.4 Bosch Global
- 16.2.4.1. Overview
- 16.2.4.2. Products
- 16.2.4.3. SWOT Analysis
- 16.2.4.4. Recent Developments
- 16.2.4.5. Financials (Based on Availability)
- 16.2.5 Electrolux
- 16.2.5.1. Overview
- 16.2.5.2. Products
- 16.2.5.3. SWOT Analysis
- 16.2.5.4. Recent Developments
- 16.2.5.5. Financials (Based on Availability)
- 16.2.6 Haier
- 16.2.6.1. Overview
- 16.2.6.2. Products
- 16.2.6.3. SWOT Analysis
- 16.2.6.4. Recent Developments
- 16.2.6.5. Financials (Based on Availability)
- 16.2.7 Whirlpool
- 16.2.7.1. Overview
- 16.2.7.2. Products
- 16.2.7.3. SWOT Analysis
- 16.2.7.4. Recent Developments
- 16.2.7.5. Financials (Based on Availability)
- 16.2.8 IFB
- 16.2.8.1. Overview
- 16.2.8.2. Products
- 16.2.8.3. SWOT Analysis
- 16.2.8.4. Recent Developments
- 16.2.8.5. Financials (Based on Availability)
- 16.2.9 Hitachi
- 16.2.9.1. Overview
- 16.2.9.2. Products
- 16.2.9.3. SWOT Analysis
- 16.2.9.4. Recent Developments
- 16.2.9.5. Financials (Based on Availability)
- 16.2.10 Samsung
- 16.2.10.1. Overview
- 16.2.10.2. Products
- 16.2.10.3. SWOT Analysis
- 16.2.10.4. Recent Developments
- 16.2.10.5. Financials (Based on Availability)
- 16.2.1 LG
List of Figures
- Figure 1: Global US Microwaves Market Revenue Breakdown (Million, %) by Region 2024 & 2032
- Figure 2: Global US Microwaves Market Volume Breakdown (K Unit, %) by Region 2024 & 2032
- Figure 3: United states US Microwaves Market Revenue (Million), by Country 2024 & 2032
- Figure 4: United states US Microwaves Market Volume (K Unit), by Country 2024 & 2032
- Figure 5: United states US Microwaves Market Revenue Share (%), by Country 2024 & 2032
- Figure 6: United states US Microwaves Market Volume Share (%), by Country 2024 & 2032
- Figure 7: North America US Microwaves Market Revenue (Million), by Type 2024 & 2032
- Figure 8: North America US Microwaves Market Volume (K Unit), by Type 2024 & 2032
- Figure 9: North America US Microwaves Market Revenue Share (%), by Type 2024 & 2032
- Figure 10: North America US Microwaves Market Volume Share (%), by Type 2024 & 2032
- Figure 11: North America US Microwaves Market Revenue (Million), by Structure 2024 & 2032
- Figure 12: North America US Microwaves Market Volume (K Unit), by Structure 2024 & 2032
- Figure 13: North America US Microwaves Market Revenue Share (%), by Structure 2024 & 2032
- Figure 14: North America US Microwaves Market Volume Share (%), by Structure 2024 & 2032
- Figure 15: North America US Microwaves Market Revenue (Million), by End Users 2024 & 2032
- Figure 16: North America US Microwaves Market Volume (K Unit), by End Users 2024 & 2032
- Figure 17: North America US Microwaves Market Revenue Share (%), by End Users 2024 & 2032
- Figure 18: North America US Microwaves Market Volume Share (%), by End Users 2024 & 2032
- Figure 19: North America US Microwaves Market Revenue (Million), by Distribution Channel 2024 & 2032
- Figure 20: North America US Microwaves Market Volume (K Unit), by Distribution Channel 2024 & 2032
- Figure 21: North America US Microwaves Market Revenue Share (%), by Distribution Channel 2024 & 2032
- Figure 22: North America US Microwaves Market Volume Share (%), by Distribution Channel 2024 & 2032
- Figure 23: North America US Microwaves Market Revenue (Million), by Country 2024 & 2032
- Figure 24: North America US Microwaves Market Volume (K Unit), by Country 2024 & 2032
- Figure 25: North America US Microwaves Market Revenue Share (%), by Country 2024 & 2032
- Figure 26: North America US Microwaves Market Volume Share (%), by Country 2024 & 2032
- Figure 27: South America US Microwaves Market Revenue (Million), by Type 2024 & 2032
- Figure 28: South America US Microwaves Market Volume (K Unit), by Type 2024 & 2032
- Figure 29: South America US Microwaves Market Revenue Share (%), by Type 2024 & 2032
- Figure 30: South America US Microwaves Market Volume Share (%), by Type 2024 & 2032
- Figure 31: South America US Microwaves Market Revenue (Million), by Structure 2024 & 2032
- Figure 32: South America US Microwaves Market Volume (K Unit), by Structure 2024 & 2032
- Figure 33: South America US Microwaves Market Revenue Share (%), by Structure 2024 & 2032
- Figure 34: South America US Microwaves Market Volume Share (%), by Structure 2024 & 2032
- Figure 35: South America US Microwaves Market Revenue (Million), by End Users 2024 & 2032
- Figure 36: South America US Microwaves Market Volume (K Unit), by End Users 2024 & 2032
- Figure 37: South America US Microwaves Market Revenue Share (%), by End Users 2024 & 2032
- Figure 38: South America US Microwaves Market Volume Share (%), by End Users 2024 & 2032
- Figure 39: South America US Microwaves Market Revenue (Million), by Distribution Channel 2024 & 2032
- Figure 40: South America US Microwaves Market Volume (K Unit), by Distribution Channel 2024 & 2032
- Figure 41: South America US Microwaves Market Revenue Share (%), by Distribution Channel 2024 & 2032
- Figure 42: South America US Microwaves Market Volume Share (%), by Distribution Channel 2024 & 2032
- Figure 43: South America US Microwaves Market Revenue (Million), by Country 2024 & 2032
- Figure 44: South America US Microwaves Market Volume (K Unit), by Country 2024 & 2032
- Figure 45: South America US Microwaves Market Revenue Share (%), by Country 2024 & 2032
- Figure 46: South America US Microwaves Market Volume Share (%), by Country 2024 & 2032
- Figure 47: Europe US Microwaves Market Revenue (Million), by Type 2024 & 2032
- Figure 48: Europe US Microwaves Market Volume (K Unit), by Type 2024 & 2032
- Figure 49: Europe US Microwaves Market Revenue Share (%), by Type 2024 & 2032
- Figure 50: Europe US Microwaves Market Volume Share (%), by Type 2024 & 2032
- Figure 51: Europe US Microwaves Market Revenue (Million), by Structure 2024 & 2032
- Figure 52: Europe US Microwaves Market Volume (K Unit), by Structure 2024 & 2032
- Figure 53: Europe US Microwaves Market Revenue Share (%), by Structure 2024 & 2032
- Figure 54: Europe US Microwaves Market Volume Share (%), by Structure 2024 & 2032
- Figure 55: Europe US Microwaves Market Revenue (Million), by End Users 2024 & 2032
- Figure 56: Europe US Microwaves Market Volume (K Unit), by End Users 2024 & 2032
- Figure 57: Europe US Microwaves Market Revenue Share (%), by End Users 2024 & 2032
- Figure 58: Europe US Microwaves Market Volume Share (%), by End Users 2024 & 2032
- Figure 59: Europe US Microwaves Market Revenue (Million), by Distribution Channel 2024 & 2032
- Figure 60: Europe US Microwaves Market Volume (K Unit), by Distribution Channel 2024 & 2032
- Figure 61: Europe US Microwaves Market Revenue Share (%), by Distribution Channel 2024 & 2032
- Figure 62: Europe US Microwaves Market Volume Share (%), by Distribution Channel 2024 & 2032
- Figure 63: Europe US Microwaves Market Revenue (Million), by Country 2024 & 2032
- Figure 64: Europe US Microwaves Market Volume (K Unit), by Country 2024 & 2032
- Figure 65: Europe US Microwaves Market Revenue Share (%), by Country 2024 & 2032
- Figure 66: Europe US Microwaves Market Volume Share (%), by Country 2024 & 2032
- Figure 67: Middle East & Africa US Microwaves Market Revenue (Million), by Type 2024 & 2032
- Figure 68: Middle East & Africa US Microwaves Market Volume (K Unit), by Type 2024 & 2032
- Figure 69: Middle East & Africa US Microwaves Market Revenue Share (%), by Type 2024 & 2032
- Figure 70: Middle East & Africa US Microwaves Market Volume Share (%), by Type 2024 & 2032
- Figure 71: Middle East & Africa US Microwaves Market Revenue (Million), by Structure 2024 & 2032
- Figure 72: Middle East & Africa US Microwaves Market Volume (K Unit), by Structure 2024 & 2032
- Figure 73: Middle East & Africa US Microwaves Market Revenue Share (%), by Structure 2024 & 2032
- Figure 74: Middle East & Africa US Microwaves Market Volume Share (%), by Structure 2024 & 2032
- Figure 75: Middle East & Africa US Microwaves Market Revenue (Million), by End Users 2024 & 2032
- Figure 76: Middle East & Africa US Microwaves Market Volume (K Unit), by End Users 2024 & 2032
- Figure 77: Middle East & Africa US Microwaves Market Revenue Share (%), by End Users 2024 & 2032
- Figure 78: Middle East & Africa US Microwaves Market Volume Share (%), by End Users 2024 & 2032
- Figure 79: Middle East & Africa US Microwaves Market Revenue (Million), by Distribution Channel 2024 & 2032
- Figure 80: Middle East & Africa US Microwaves Market Volume (K Unit), by Distribution Channel 2024 & 2032
- Figure 81: Middle East & Africa US Microwaves Market Revenue Share (%), by Distribution Channel 2024 & 2032
- Figure 82: Middle East & Africa US Microwaves Market Volume Share (%), by Distribution Channel 2024 & 2032
- Figure 83: Middle East & Africa US Microwaves Market Revenue (Million), by Country 2024 & 2032
- Figure 84: Middle East & Africa US Microwaves Market Volume (K Unit), by Country 2024 & 2032
- Figure 85: Middle East & Africa US Microwaves Market Revenue Share (%), by Country 2024 & 2032
- Figure 86: Middle East & Africa US Microwaves Market Volume Share (%), by Country 2024 & 2032
- Figure 87: Asia Pacific US Microwaves Market Revenue (Million), by Type 2024 & 2032
- Figure 88: Asia Pacific US Microwaves Market Volume (K Unit), by Type 2024 & 2032
- Figure 89: Asia Pacific US Microwaves Market Revenue Share (%), by Type 2024 & 2032
- Figure 90: Asia Pacific US Microwaves Market Volume Share (%), by Type 2024 & 2032
- Figure 91: Asia Pacific US Microwaves Market Revenue (Million), by Structure 2024 & 2032
- Figure 92: Asia Pacific US Microwaves Market Volume (K Unit), by Structure 2024 & 2032
- Figure 93: Asia Pacific US Microwaves Market Revenue Share (%), by Structure 2024 & 2032
- Figure 94: Asia Pacific US Microwaves Market Volume Share (%), by Structure 2024 & 2032
- Figure 95: Asia Pacific US Microwaves Market Revenue (Million), by End Users 2024 & 2032
- Figure 96: Asia Pacific US Microwaves Market Volume (K Unit), by End Users 2024 & 2032
- Figure 97: Asia Pacific US Microwaves Market Revenue Share (%), by End Users 2024 & 2032
- Figure 98: Asia Pacific US Microwaves Market Volume Share (%), by End Users 2024 & 2032
- Figure 99: Asia Pacific US Microwaves Market Revenue (Million), by Distribution Channel 2024 & 2032
- Figure 100: Asia Pacific US Microwaves Market Volume (K Unit), by Distribution Channel 2024 & 2032
- Figure 101: Asia Pacific US Microwaves Market Revenue Share (%), by Distribution Channel 2024 & 2032
- Figure 102: Asia Pacific US Microwaves Market Volume Share (%), by Distribution Channel 2024 & 2032
- Figure 103: Asia Pacific US Microwaves Market Revenue (Million), by Country 2024 & 2032
- Figure 104: Asia Pacific US Microwaves Market Volume (K Unit), by Country 2024 & 2032
- Figure 105: Asia Pacific US Microwaves Market Revenue Share (%), by Country 2024 & 2032
- Figure 106: Asia Pacific US Microwaves Market Volume Share (%), by Country 2024 & 2032
List of Tables
- Table 1: Global US Microwaves Market Revenue Million Forecast, by Region 2019 & 2032
- Table 2: Global US Microwaves Market Volume K Unit Forecast, by Region 2019 & 2032
- Table 3: Global US Microwaves Market Revenue Million Forecast, by Type 2019 & 2032
- Table 4: Global US Microwaves Market Volume K Unit Forecast, by Type 2019 & 2032
- Table 5: Global US Microwaves Market Revenue Million Forecast, by Structure 2019 & 2032
- Table 6: Global US Microwaves Market Volume K Unit Forecast, by Structure 2019 & 2032
- Table 7: Global US Microwaves Market Revenue Million Forecast, by End Users 2019 & 2032
- Table 8: Global US Microwaves Market Volume K Unit Forecast, by End Users 2019 & 2032
- Table 9: Global US Microwaves Market Revenue Million Forecast, by Distribution Channel 2019 & 2032
- Table 10: Global US Microwaves Market Volume K Unit Forecast, by Distribution Channel 2019 & 2032
- Table 11: Global US Microwaves Market Revenue Million Forecast, by Region 2019 & 2032
- Table 12: Global US Microwaves Market Volume K Unit Forecast, by Region 2019 & 2032
- Table 13: Global US Microwaves Market Revenue Million Forecast, by Country 2019 & 2032
- Table 14: Global US Microwaves Market Volume K Unit Forecast, by Country 2019 & 2032
- Table 15: Northeast US Microwaves Market Revenue (Million) Forecast, by Application 2019 & 2032
- Table 16: Northeast US Microwaves Market Volume (K Unit) Forecast, by Application 2019 & 2032
- Table 17: Southeast US Microwaves Market Revenue (Million) Forecast, by Application 2019 & 2032
- Table 18: Southeast US Microwaves Market Volume (K Unit) Forecast, by Application 2019 & 2032
- Table 19: Midwest US Microwaves Market Revenue (Million) Forecast, by Application 2019 & 2032
- Table 20: Midwest US Microwaves Market Volume (K Unit) Forecast, by Application 2019 & 2032
- Table 21: Southwest US Microwaves Market Revenue (Million) Forecast, by Application 2019 & 2032
- Table 22: Southwest US Microwaves Market Volume (K Unit) Forecast, by Application 2019 & 2032
- Table 23: West US Microwaves Market Revenue (Million) Forecast, by Application 2019 & 2032
- Table 24: West US Microwaves Market Volume (K Unit) Forecast, by Application 2019 & 2032
- Table 25: Global US Microwaves Market Revenue Million Forecast, by Type 2019 & 2032
- Table 26: Global US Microwaves Market Volume K Unit Forecast, by Type 2019 & 2032
- Table 27: Global US Microwaves Market Revenue Million Forecast, by Structure 2019 & 2032
- Table 28: Global US Microwaves Market Volume K Unit Forecast, by Structure 2019 & 2032
- Table 29: Global US Microwaves Market Revenue Million Forecast, by End Users 2019 & 2032
- Table 30: Global US Microwaves Market Volume K Unit Forecast, by End Users 2019 & 2032
- Table 31: Global US Microwaves Market Revenue Million Forecast, by Distribution Channel 2019 & 2032
- Table 32: Global US Microwaves Market Volume K Unit Forecast, by Distribution Channel 2019 & 2032
- Table 33: Global US Microwaves Market Revenue Million Forecast, by Country 2019 & 2032
- Table 34: Global US Microwaves Market Volume K Unit Forecast, by Country 2019 & 2032
- Table 35: United States US Microwaves Market Revenue (Million) Forecast, by Application 2019 & 2032
- Table 36: United States US Microwaves Market Volume (K Unit) Forecast, by Application 2019 & 2032
- Table 37: Canada US Microwaves Market Revenue (Million) Forecast, by Application 2019 & 2032
- Table 38: Canada US Microwaves Market Volume (K Unit) Forecast, by Application 2019 & 2032
- Table 39: Mexico US Microwaves Market Revenue (Million) Forecast, by Application 2019 & 2032
- Table 40: Mexico US Microwaves Market Volume (K Unit) Forecast, by Application 2019 & 2032
- Table 41: Global US Microwaves Market Revenue Million Forecast, by Type 2019 & 2032
- Table 42: Global US Microwaves Market Volume K Unit Forecast, by Type 2019 & 2032
- Table 43: Global US Microwaves Market Revenue Million Forecast, by Structure 2019 & 2032
- Table 44: Global US Microwaves Market Volume K Unit Forecast, by Structure 2019 & 2032
- Table 45: Global US Microwaves Market Revenue Million Forecast, by End Users 2019 & 2032
- Table 46: Global US Microwaves Market Volume K Unit Forecast, by End Users 2019 & 2032
- Table 47: Global US Microwaves Market Revenue Million Forecast, by Distribution Channel 2019 & 2032
- Table 48: Global US Microwaves Market Volume K Unit Forecast, by Distribution Channel 2019 & 2032
- Table 49: Global US Microwaves Market Revenue Million Forecast, by Country 2019 & 2032
- Table 50: Global US Microwaves Market Volume K Unit Forecast, by Country 2019 & 2032
- Table 51: Brazil US Microwaves Market Revenue (Million) Forecast, by Application 2019 & 2032
- Table 52: Brazil US Microwaves Market Volume (K Unit) Forecast, by Application 2019 & 2032
- Table 53: Argentina US Microwaves Market Revenue (Million) Forecast, by Application 2019 & 2032
- Table 54: Argentina US Microwaves Market Volume (K Unit) Forecast, by Application 2019 & 2032
- Table 55: Rest of South America US Microwaves Market Revenue (Million) Forecast, by Application 2019 & 2032
- Table 56: Rest of South America US Microwaves Market Volume (K Unit) Forecast, by Application 2019 & 2032
- Table 57: Global US Microwaves Market Revenue Million Forecast, by Type 2019 & 2032
- Table 58: Global US Microwaves Market Volume K Unit Forecast, by Type 2019 & 2032
- Table 59: Global US Microwaves Market Revenue Million Forecast, by Structure 2019 & 2032
- Table 60: Global US Microwaves Market Volume K Unit Forecast, by Structure 2019 & 2032
- Table 61: Global US Microwaves Market Revenue Million Forecast, by End Users 2019 & 2032
- Table 62: Global US Microwaves Market Volume K Unit Forecast, by End Users 2019 & 2032
- Table 63: Global US Microwaves Market Revenue Million Forecast, by Distribution Channel 2019 & 2032
- Table 64: Global US Microwaves Market Volume K Unit Forecast, by Distribution Channel 2019 & 2032
- Table 65: Global US Microwaves Market Revenue Million Forecast, by Country 2019 & 2032
- Table 66: Global US Microwaves Market Volume K Unit Forecast, by Country 2019 & 2032
- Table 67: United Kingdom US Microwaves Market Revenue (Million) Forecast, by Application 2019 & 2032
- Table 68: United Kingdom US Microwaves Market Volume (K Unit) Forecast, by Application 2019 & 2032
- Table 69: Germany US Microwaves Market Revenue (Million) Forecast, by Application 2019 & 2032
- Table 70: Germany US Microwaves Market Volume (K Unit) Forecast, by Application 2019 & 2032
- Table 71: France US Microwaves Market Revenue (Million) Forecast, by Application 2019 & 2032
- Table 72: France US Microwaves Market Volume (K Unit) Forecast, by Application 2019 & 2032
- Table 73: Italy US Microwaves Market Revenue (Million) Forecast, by Application 2019 & 2032
- Table 74: Italy US Microwaves Market Volume (K Unit) Forecast, by Application 2019 & 2032
- Table 75: Spain US Microwaves Market Revenue (Million) Forecast, by Application 2019 & 2032
- Table 76: Spain US Microwaves Market Volume (K Unit) Forecast, by Application 2019 & 2032
- Table 77: Russia US Microwaves Market Revenue (Million) Forecast, by Application 2019 & 2032
- Table 78: Russia US Microwaves Market Volume (K Unit) Forecast, by Application 2019 & 2032
- Table 79: Benelux US Microwaves Market Revenue (Million) Forecast, by Application 2019 & 2032
- Table 80: Benelux US Microwaves Market Volume (K Unit) Forecast, by Application 2019 & 2032
- Table 81: Nordics US Microwaves Market Revenue (Million) Forecast, by Application 2019 & 2032
- Table 82: Nordics US Microwaves Market Volume (K Unit) Forecast, by Application 2019 & 2032
- Table 83: Rest of Europe US Microwaves Market Revenue (Million) Forecast, by Application 2019 & 2032
- Table 84: Rest of Europe US Microwaves Market Volume (K Unit) Forecast, by Application 2019 & 2032
- Table 85: Global US Microwaves Market Revenue Million Forecast, by Type 2019 & 2032
- Table 86: Global US Microwaves Market Volume K Unit Forecast, by Type 2019 & 2032
- Table 87: Global US Microwaves Market Revenue Million Forecast, by Structure 2019 & 2032
- Table 88: Global US Microwaves Market Volume K Unit Forecast, by Structure 2019 & 2032
- Table 89: Global US Microwaves Market Revenue Million Forecast, by End Users 2019 & 2032
- Table 90: Global US Microwaves Market Volume K Unit Forecast, by End Users 2019 & 2032
- Table 91: Global US Microwaves Market Revenue Million Forecast, by Distribution Channel 2019 & 2032
- Table 92: Global US Microwaves Market Volume K Unit Forecast, by Distribution Channel 2019 & 2032
- Table 93: Global US Microwaves Market Revenue Million Forecast, by Country 2019 & 2032
- Table 94: Global US Microwaves Market Volume K Unit Forecast, by Country 2019 & 2032
- Table 95: Turkey US Microwaves Market Revenue (Million) Forecast, by Application 2019 & 2032
- Table 96: Turkey US Microwaves Market Volume (K Unit) Forecast, by Application 2019 & 2032
- Table 97: Israel US Microwaves Market Revenue (Million) Forecast, by Application 2019 & 2032
- Table 98: Israel US Microwaves Market Volume (K Unit) Forecast, by Application 2019 & 2032
- Table 99: GCC US Microwaves Market Revenue (Million) Forecast, by Application 2019 & 2032
- Table 100: GCC US Microwaves Market Volume (K Unit) Forecast, by Application 2019 & 2032
- Table 101: North Africa US Microwaves Market Revenue (Million) Forecast, by Application 2019 & 2032
- Table 102: North Africa US Microwaves Market Volume (K Unit) Forecast, by Application 2019 & 2032
- Table 103: South Africa US Microwaves Market Revenue (Million) Forecast, by Application 2019 & 2032
- Table 104: South Africa US Microwaves Market Volume (K Unit) Forecast, by Application 2019 & 2032
- Table 105: Rest of Middle East & Africa US Microwaves Market Revenue (Million) Forecast, by Application 2019 & 2032
- Table 106: Rest of Middle East & Africa US Microwaves Market Volume (K Unit) Forecast, by Application 2019 & 2032
- Table 107: Global US Microwaves Market Revenue Million Forecast, by Type 2019 & 2032
- Table 108: Global US Microwaves Market Volume K Unit Forecast, by Type 2019 & 2032
- Table 109: Global US Microwaves Market Revenue Million Forecast, by Structure 2019 & 2032
- Table 110: Global US Microwaves Market Volume K Unit Forecast, by Structure 2019 & 2032
- Table 111: Global US Microwaves Market Revenue Million Forecast, by End Users 2019 & 2032
- Table 112: Global US Microwaves Market Volume K Unit Forecast, by End Users 2019 & 2032
- Table 113: Global US Microwaves Market Revenue Million Forecast, by Distribution Channel 2019 & 2032
- Table 114: Global US Microwaves Market Volume K Unit Forecast, by Distribution Channel 2019 & 2032
- Table 115: Global US Microwaves Market Revenue Million Forecast, by Country 2019 & 2032
- Table 116: Global US Microwaves Market Volume K Unit Forecast, by Country 2019 & 2032
- Table 117: China US Microwaves Market Revenue (Million) Forecast, by Application 2019 & 2032
- Table 118: China US Microwaves Market Volume (K Unit) Forecast, by Application 2019 & 2032
- Table 119: India US Microwaves Market Revenue (Million) Forecast, by Application 2019 & 2032
- Table 120: India US Microwaves Market Volume (K Unit) Forecast, by Application 2019 & 2032
- Table 121: Japan US Microwaves Market Revenue (Million) Forecast, by Application 2019 & 2032
- Table 122: Japan US Microwaves Market Volume (K Unit) Forecast, by Application 2019 & 2032
- Table 123: South Korea US Microwaves Market Revenue (Million) Forecast, by Application 2019 & 2032
- Table 124: South Korea US Microwaves Market Volume (K Unit) Forecast, by Application 2019 & 2032
- Table 125: ASEAN US Microwaves Market Revenue (Million) Forecast, by Application 2019 & 2032
- Table 126: ASEAN US Microwaves Market Volume (K Unit) Forecast, by Application 2019 & 2032
- Table 127: Oceania US Microwaves Market Revenue (Million) Forecast, by Application 2019 & 2032
- Table 128: Oceania US Microwaves Market Volume (K Unit) Forecast, by Application 2019 & 2032
- Table 129: Rest of Asia Pacific US Microwaves Market Revenue (Million) Forecast, by Application 2019 & 2032
- Table 130: Rest of Asia Pacific US Microwaves Market Volume (K Unit) Forecast, by Application 2019 & 2032
Frequently Asked Questions
1. What is the projected Compound Annual Growth Rate (CAGR) of the US Microwaves Market?
The projected CAGR is approximately > 4.00%.
2. Which companies are prominent players in the US Microwaves Market?
Key companies in the market include LG, General Electronics Corporation, Panasonic India, Bosch Global, Electrolux, Haier, Whirlpool, IFB, Hitachi, Samsung.
3. What are the main segments of the US Microwaves Market?
The market segments include Type, Structure, End Users, Distribution Channel.
4. Can you provide details about the market size?
The market size is estimated to be USD XX Million as of 2022.
5. What are some drivers contributing to market growth?
Increasing Urbanization is Driving the Market; Increase in Usage of Smart Kitchen Appliances is Driving the Market.
6. What are the notable trends driving market growth?
Increase in Urbanization Demands for Microwable Foods.
7. Are there any restraints impacting market growth?
High Power Consumption.
8. Can you provide examples of recent developments in the market?
N/A
9. What pricing options are available for accessing the report?
Pricing options include single-user, multi-user, and enterprise licenses priced at USD 3800, USD 4500, and USD 5800 respectively.
10. Is the market size provided in terms of value or volume?
The market size is provided in terms of value, measured in Million and volume, measured in K Unit.
11. Are there any specific market keywords associated with the report?
Yes, the market keyword associated with the report is "US Microwaves Market," which aids in identifying and referencing the specific market segment covered.
12. How do I determine which pricing option suits my needs best?
The pricing options vary based on user requirements and access needs. Individual users may opt for single-user licenses, while businesses requiring broader access may choose multi-user or enterprise licenses for cost-effective access to the report.
13. Are there any additional resources or data provided in the US Microwaves Market report?
While the report offers comprehensive insights, it's advisable to review the specific contents or supplementary materials provided to ascertain if additional resources or data are available.
14. How can I stay updated on further developments or reports in the US Microwaves Market?
To stay informed about further developments, trends, and reports in the US Microwaves Market, consider subscribing to industry newsletters, following relevant companies and organizations, or regularly checking reputable industry news sources and publications.
Methodology
Step 1 - Identification of Relevant Samples Size from Population Database


Step 2 - Approaches for Defining Global Market Size (Value, Volume* & Price*)

Note*: In applicable scenarios
Step 3 - Data Sources
Primary Research
- Web Analytics
- Survey Reports
- Research Institute
- Latest Research Reports
- Opinion Leaders
Secondary Research
- Annual Reports
- White Paper
- Latest Press Release
- Industry Association
- Paid Database
- Investor Presentations

Step 4 - Data Triangulation
Involves using different sources of information in order to increase the validity of a study
These sources are likely to be stakeholders in a program - participants, other researchers, program staff, other community members, and so on.
Then we put all data in single framework & apply various statistical tools to find out the dynamic on the market.
During the analysis stage, feedback from the stakeholder groups would be compared to determine areas of agreement as well as areas of divergence


