

Key Insights
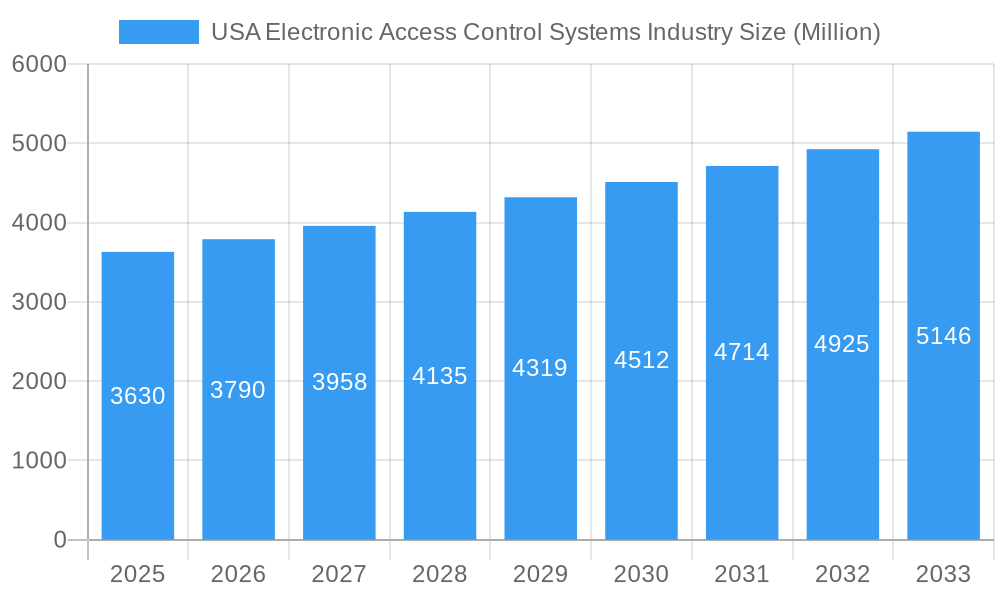
The USA electronic access control systems market, valued at $3.63 billion in 2025, is projected to experience robust growth, driven by increasing security concerns across commercial, residential, and governmental sectors. The market's Compound Annual Growth Rate (CAGR) of 4.29% from 2019 to 2024 indicates a steady upward trajectory, expected to continue through 2033. Key drivers include the rising adoption of smart building technologies, the increasing demand for advanced security solutions in response to escalating crime rates, and the growing integration of access control systems with other building management systems (BMS). Furthermore, the proliferation of cloud-based access control systems offers enhanced scalability and remote management capabilities, boosting market expansion. Market segmentation reveals strong demand across various end-user verticals, with the commercial sector leading the way due to stringent security requirements and the need for efficient workforce management. Residential applications are also witnessing significant growth, fueled by increased awareness of home security and the availability of user-friendly smart home integration options. Technological advancements, such as biometric authentication and mobile access credentials, are shaping market trends, while challenges like cybersecurity vulnerabilities and the high initial investment costs pose some restraints.
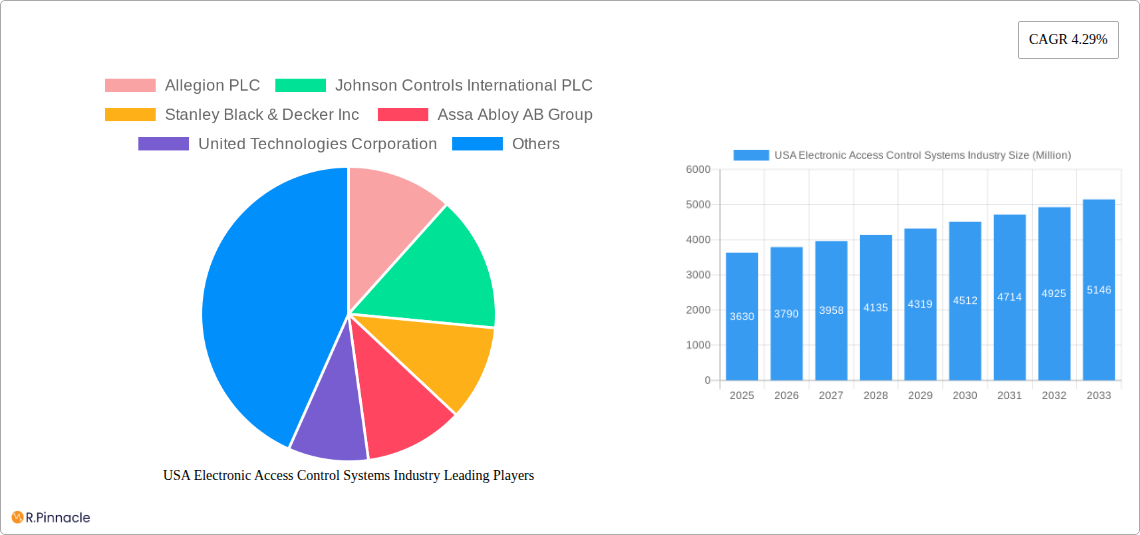
USA Electronic Access Control Systems Industry Market Size (In Billion)
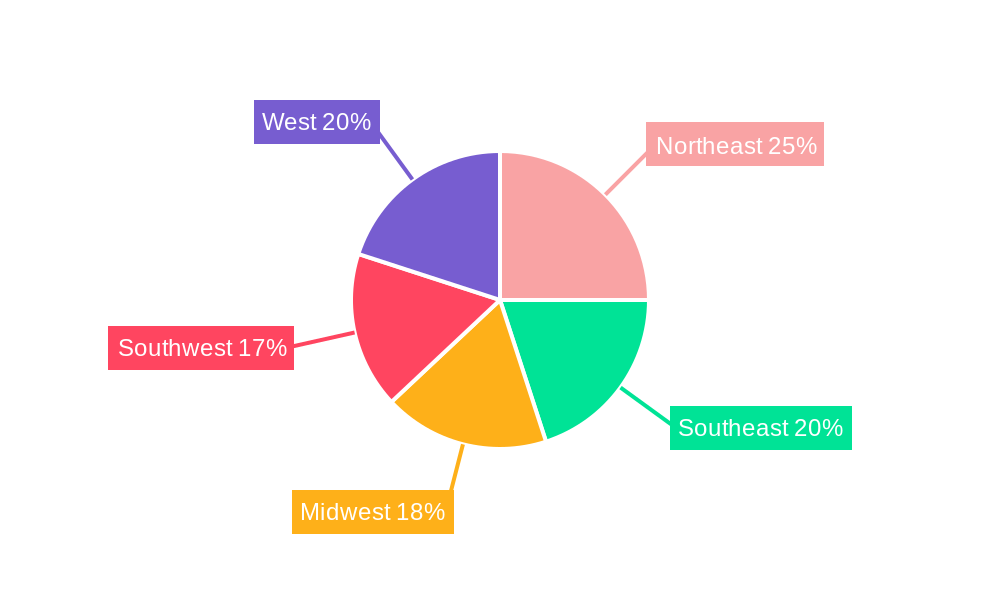
The competitive landscape is characterized by established players like Allegion PLC, Johnson Controls International PLC, and Assa Abloy AB Group, who are actively innovating and expanding their product portfolios to meet evolving market demands. Regional analysis indicates strong performance across the United States, particularly in densely populated regions like the Northeast and West, where security concerns are high. The forecast period (2025-2033) anticipates sustained growth, influenced by continued technological advancements, increasing government regulations promoting security, and rising awareness among consumers and businesses about the importance of secure access control. While specific regional breakdowns for the US market (Northeast, Southeast, etc.) are currently unavailable, regional data within the overall forecast is consistent with national trends. The continued market penetration of advanced features, coupled with consistent economic growth, should further propel the market forward.
USA Electronic Access Control Systems Industry Company Market Share
USA Electronic Access Control Systems Industry Market Report: 2019-2033
This comprehensive report provides an in-depth analysis of the USA Electronic Access Control Systems industry, offering valuable insights for industry professionals, investors, and strategic decision-makers. Covering the period from 2019 to 2033, with a focus on 2025, this report unveils market trends, growth drivers, challenges, and future opportunities within this dynamic sector.
USA Electronic Access Control Systems Industry Market Structure & Innovation Trends
The USA Electronic Access Control Systems market is moderately concentrated, with key players like Allegion PLC, Johnson Controls International PLC, Stanley Black & Decker Inc., Assa Abloy AB Group, and Honeywell Security Group holding significant market share. The exact market share distribution in 2025 is estimated at xx%, with Allegion PLC holding the largest share. Innovation is driven by advancements in biometric technology, cloud-based access control, and integration with IoT platforms. Regulatory frameworks, such as those related to data privacy and security, significantly influence market dynamics. Product substitutes, such as traditional key-based systems, are gradually losing market share due to increased security concerns and the convenience of electronic systems. The end-user demographics are diverse, encompassing commercial, residential, governmental, and industrial sectors. M&A activities have been significant, with an estimated total deal value of $xx Million in the historical period (2019-2024), driven by companies seeking to expand their product portfolios and market reach.
- Market Concentration: Moderately concentrated, with top 5 players holding xx% market share in 2025.
- Innovation Drivers: Biometric technology, cloud-based access control, IoT integration.
- Regulatory Impact: Data privacy and security regulations are key influencing factors.
- M&A Activity: Estimated $xx Million in deal value (2019-2024).
USA Electronic Access Control Systems Industry Market Dynamics & Trends
The USA Electronic Access Control Systems market is experiencing robust growth, with a projected CAGR of xx% during the forecast period (2025-2033). Key growth drivers include increasing security concerns across various sectors, the rising adoption of smart building technologies, and the growing demand for efficient access management solutions. Technological disruptions, such as the proliferation of mobile-based access credentials and advancements in artificial intelligence, are reshaping the competitive landscape. Consumer preferences are shifting towards user-friendly, integrated systems offering enhanced security and convenience. Competitive dynamics are characterized by intense rivalry among established players and the emergence of innovative startups. Market penetration of electronic access control systems is steadily increasing, particularly in the commercial and government sectors, exceeding xx% in 2025.
Dominant Regions & Segments in USA Electronic Access Control Systems Industry
The Commercial segment dominates the USA Electronic Access Control Systems market, driven by the high demand for secure access management in office buildings, retail spaces, and other commercial establishments. Within the "By Type" segmentation, the Hardware segment holds the largest market share, although Software and Services segments are experiencing significant growth. Geographically, the report identifies major metropolitan areas and regions exhibiting the highest market growth. Key drivers across segments include:
- Commercial: High security requirements, increasing adoption of smart building technologies.
- Government: Stringent security protocols, funding for infrastructure upgrades.
- Hardware: Established market presence, integration with other security systems.
- Software: Growing demand for centralized management and remote access control.
- Services: Increasing need for installation, maintenance, and support services.
USA Electronic Access Control Systems Industry Product Innovations
Recent product innovations focus on enhancing security features, improving user experience, and integrating with other security systems. Biometric access control, cloud-based management platforms, and mobile-based credentials are gaining traction. Manufacturers are emphasizing interoperability and scalability to cater to diverse customer needs. The market is witnessing a convergence of physical and digital security systems, leading to the emergence of comprehensive security solutions.
Report Scope & Segmentation Analysis
This report segments the USA Electronic Access Control Systems market by Type (Hardware, Multi-Technology Readers, Software, Services) and by End User (Commercial, Residential, Government, Industrial, Transport and Logistics, Healthcare, Military and Defense). Each segment's market size, growth projections, and competitive dynamics are analyzed individually. For example, the Residential segment is projected to witness xx% CAGR driven by increased home security concerns, while the Healthcare sector shows high growth due to the need for enhanced patient and staff safety. The Software segment demonstrates a high growth rate due to the increasing preference for cloud-based solutions.
Key Drivers of USA Electronic Access Control Systems Industry Growth
The growth of the USA Electronic Access Control Systems industry is driven by several factors: rising security concerns, particularly in the wake of recent security breaches and terrorist attacks; increasing adoption of smart building technologies; the growing demand for seamless integration with other security systems; government initiatives promoting cybersecurity and infrastructure upgrades; and the increasing availability of advanced, user-friendly electronic access control systems.
Challenges in the USA Electronic Access Control Systems Industry Sector
Challenges include the high initial investment costs associated with implementing electronic access control systems; concerns about data privacy and security; the complexity of integrating different systems; and the ongoing need for system maintenance and upgrades. Supply chain disruptions can also impact production and availability, resulting in market fluctuations. Furthermore, intense competition among established players and new entrants puts pressure on pricing and profit margins.
Emerging Opportunities in USA Electronic Access Control Systems Industry
Emerging opportunities lie in the development and deployment of innovative biometric technologies; the increasing integration of electronic access control systems with IoT platforms; the growth of the residential market due to rising homeowner security concerns; expansion into niche markets, such as healthcare and transportation; and the exploration of new business models, such as access control as a service (ACaaS).
Leading Players in the USA Electronic Access Control Systems Industry Market
Key Developments in USA Electronic Access Control Systems Industry Industry
- January 2023: Allegion PLC launches a new cloud-based access control system.
- March 2024: Assa Abloy AB Group acquires a smaller access control company.
- June 2024: Honeywell Security Group announces a partnership with a leading IoT provider. (Further developments can be added here as they become available)
Future Outlook for USA Electronic Access Control Systems Industry Market
The future outlook for the USA Electronic Access Control Systems market remains positive. Continued technological advancements, increasing security concerns, and growing demand across various sectors will drive market growth. Strategic partnerships, mergers, and acquisitions are expected to further shape the industry landscape. The market is poised for significant expansion driven by the increasing adoption of smart building technologies and the integration of access control systems with wider security and IoT ecosystems.
USA Electronic Access Control Systems Industry Segmentation
-
1. Type
- 1.1. Hardware
- 1.2. Software
- 1.3. Services
-
2. End User
- 2.1. Commercial
- 2.2. Residential
- 2.3. Government
- 2.4. Industrial
- 2.5. Transport and Logistics
- 2.6. Healthcare
- 2.7. Military and Defense
USA Electronic Access Control Systems Industry Segmentation By Geography
-
1. North America
- 1.1. United States
- 1.2. Canada
- 1.3. Mexico
-
2. South America
- 2.1. Brazil
- 2.2. Argentina
- 2.3. Rest of South America
-
3. Europe
- 3.1. United Kingdom
- 3.2. Germany
- 3.3. France
- 3.4. Italy
- 3.5. Spain
- 3.6. Russia
- 3.7. Benelux
- 3.8. Nordics
- 3.9. Rest of Europe
-
4. Middle East & Africa
- 4.1. Turkey
- 4.2. Israel
- 4.3. GCC
- 4.4. North Africa
- 4.5. South Africa
- 4.6. Rest of Middle East & Africa
-
5. Asia Pacific
- 5.1. China
- 5.2. India
- 5.3. Japan
- 5.4. South Korea
- 5.5. ASEAN
- 5.6. Oceania
- 5.7. Rest of Asia Pacific
USA Electronic Access Control Systems Industry Regional Market Share
Geographic Coverage of USA Electronic Access Control Systems Industry
USA Electronic Access Control Systems Industry REPORT HIGHLIGHTS
| Aspects | Details |
|---|---|
| Study Period | 2020-2034 |
| Base Year | 2025 |
| Estimated Year | 2026 |
| Forecast Period | 2026-2034 |
| Historical Period | 2020-2025 |
| Growth Rate | CAGR of 4.29% from 2020-2034 |
| Segmentation |
|
Table of Contents
- 1. Introduction
- 1.1. Research Scope
- 1.2. Market Segmentation
- 1.3. Research Objective
- 1.4. Definitions and Assumptions
- 2. Executive Summary
- 2.1. Market Snapshot
- 3. Market Dynamics
- 3.1. Market Drivers
- 3.2. Market Restrains
- 3.3. Market Trends
- 3.4. Market Opportunities
- 4. Market Factor Analysis
- 4.1. Porters Five Forces
- 4.1.1. Bargaining Power of Suppliers
- 4.1.2. Bargaining Power of Buyers
- 4.1.3. Threat of New Entrants
- 4.1.4. Threat of Substitutes
- 4.1.5. Competitive Rivalry
- 4.2. PESTEL analysis
- 4.3. BCG Analysis
- 4.3.1. Stars (High Growth, High Market Share)
- 4.3.2. Cash Cows (Low Growth, High Market Share)
- 4.3.3. Question Mark (High Growth, Low Market Share)
- 4.3.4. Dogs (Low Growth, Low Market Share)
- 4.4. Ansoff Matrix Analysis
- 4.5. Supply Chain Analysis
- 4.6. Regulatory Landscape
- 4.7. Current Market Potential and Opportunity Assessment (TAM–SAM–SOM Framework)
- 4.8. PRI Analyst Note
- 4.1. Porters Five Forces
- 5. Market Analysis, Insights and Forecast 2021-2033
- 5.1. Market Analysis, Insights and Forecast - by Type
- 5.1.1. Hardware
- 5.1.2. Software
- 5.1.3. Services
- 5.2. Market Analysis, Insights and Forecast - by End User
- 5.2.1. Commercial
- 5.2.2. Residential
- 5.2.3. Government
- 5.2.4. Industrial
- 5.2.5. Transport and Logistics
- 5.2.6. Healthcare
- 5.2.7. Military and Defense
- 5.3. Market Analysis, Insights and Forecast - by Region
- 5.3.1. North America
- 5.3.2. South America
- 5.3.3. Europe
- 5.3.4. Middle East & Africa
- 5.3.5. Asia Pacific
- 5.1. Market Analysis, Insights and Forecast - by Type
- 6. Global USA Electronic Access Control Systems Industry Analysis, Insights and Forecast, 2021-2033
- 6.1. Market Analysis, Insights and Forecast - by Type
- 6.1.1. Hardware
- 6.1.2. Software
- 6.1.3. Services
- 6.2. Market Analysis, Insights and Forecast - by End User
- 6.2.1. Commercial
- 6.2.2. Residential
- 6.2.3. Government
- 6.2.4. Industrial
- 6.2.5. Transport and Logistics
- 6.2.6. Healthcare
- 6.2.7. Military and Defense
- 6.1. Market Analysis, Insights and Forecast - by Type
- 7. North America USA Electronic Access Control Systems Industry Analysis, Insights and Forecast, 2020-2032
- 7.1. Market Analysis, Insights and Forecast - by Type
- 7.1.1. Hardware
- 7.1.2. Software
- 7.1.3. Services
- 7.2. Market Analysis, Insights and Forecast - by End User
- 7.2.1. Commercial
- 7.2.2. Residential
- 7.2.3. Government
- 7.2.4. Industrial
- 7.2.5. Transport and Logistics
- 7.2.6. Healthcare
- 7.2.7. Military and Defense
- 7.1. Market Analysis, Insights and Forecast - by Type
- 8. South America USA Electronic Access Control Systems Industry Analysis, Insights and Forecast, 2020-2032
- 8.1. Market Analysis, Insights and Forecast - by Type
- 8.1.1. Hardware
- 8.1.2. Software
- 8.1.3. Services
- 8.2. Market Analysis, Insights and Forecast - by End User
- 8.2.1. Commercial
- 8.2.2. Residential
- 8.2.3. Government
- 8.2.4. Industrial
- 8.2.5. Transport and Logistics
- 8.2.6. Healthcare
- 8.2.7. Military and Defense
- 8.1. Market Analysis, Insights and Forecast - by Type
- 9. Europe USA Electronic Access Control Systems Industry Analysis, Insights and Forecast, 2020-2032
- 9.1. Market Analysis, Insights and Forecast - by Type
- 9.1.1. Hardware
- 9.1.2. Software
- 9.1.3. Services
- 9.2. Market Analysis, Insights and Forecast - by End User
- 9.2.1. Commercial
- 9.2.2. Residential
- 9.2.3. Government
- 9.2.4. Industrial
- 9.2.5. Transport and Logistics
- 9.2.6. Healthcare
- 9.2.7. Military and Defense
- 9.1. Market Analysis, Insights and Forecast - by Type
- 10. Middle East & Africa USA Electronic Access Control Systems Industry Analysis, Insights and Forecast, 2020-2032
- 10.1. Market Analysis, Insights and Forecast - by Type
- 10.1.1. Hardware
- 10.1.2. Software
- 10.1.3. Services
- 10.2. Market Analysis, Insights and Forecast - by End User
- 10.2.1. Commercial
- 10.2.2. Residential
- 10.2.3. Government
- 10.2.4. Industrial
- 10.2.5. Transport and Logistics
- 10.2.6. Healthcare
- 10.2.7. Military and Defense
- 10.1. Market Analysis, Insights and Forecast - by Type
- 11. Asia Pacific USA Electronic Access Control Systems Industry Analysis, Insights and Forecast, 2020-2032
- 11.1. Market Analysis, Insights and Forecast - by Type
- 11.1.1. Hardware
- 11.1.2. Software
- 11.1.3. Services
- 11.2. Market Analysis, Insights and Forecast - by End User
- 11.2.1. Commercial
- 11.2.2. Residential
- 11.2.3. Government
- 11.2.4. Industrial
- 11.2.5. Transport and Logistics
- 11.2.6. Healthcare
- 11.2.7. Military and Defense
- 11.1. Market Analysis, Insights and Forecast - by Type
- 12. Competitive Analysis
- 12.1. Company Profiles
- 12.1.1 Allegion PLC
- 12.1.1.1. Company Overview
- 12.1.1.2. Products
- 12.1.1.3. Company Financials
- 12.1.1.4. SWOT Analysis
- 12.1.2 Johnson Controls International PLC
- 12.1.2.1. Company Overview
- 12.1.2.2. Products
- 12.1.2.3. Company Financials
- 12.1.2.4. SWOT Analysis
- 12.1.3 Stanley Black & Decker Inc
- 12.1.3.1. Company Overview
- 12.1.3.2. Products
- 12.1.3.3. Company Financials
- 12.1.3.4. SWOT Analysis
- 12.1.4 Assa Abloy AB Group
- 12.1.4.1. Company Overview
- 12.1.4.2. Products
- 12.1.4.3. Company Financials
- 12.1.4.4. SWOT Analysis
- 12.1.5 United Technologies Corporation
- 12.1.5.1. Company Overview
- 12.1.5.2. Products
- 12.1.5.3. Company Financials
- 12.1.5.4. SWOT Analysis
- 12.1.6 Honeywell Security Group
- 12.1.6.1. Company Overview
- 12.1.6.2. Products
- 12.1.6.3. Company Financials
- 12.1.6.4. SWOT Analysis
- 12.1.7 Schneider Electric SE
- 12.1.7.1. Company Overview
- 12.1.7.2. Products
- 12.1.7.3. Company Financials
- 12.1.7.4. SWOT Analysis
- 12.1.8 Bosch Security System Inc
- 12.1.8.1. Company Overview
- 12.1.8.2. Products
- 12.1.8.3. Company Financials
- 12.1.8.4. SWOT Analysis
- 12.1.9 dormakaba Holding AG
- 12.1.9.1. Company Overview
- 12.1.9.2. Products
- 12.1.9.3. Company Financials
- 12.1.9.4. SWOT Analysis
- 12.1.10 IDEMIA Identity & Security SAS
- 12.1.10.1. Company Overview
- 12.1.10.2. Products
- 12.1.10.3. Company Financials
- 12.1.10.4. SWOT Analysis
- 12.1.1 Allegion PLC
- 12.2. Market Entropy
- 12.2.1 Company's Key Areas Served
- 12.2.2 Recent Developments
- 12.3. Company Market Share Analysis 2025
- 12.3.1 Top 5 Companies Market Share Analysis
- 12.3.2 Top 3 Companies Market Share Analysis
- 12.4. List of Potential Customers
- 13. Research Methodology
List of Figures
- Figure 1: Global USA Electronic Access Control Systems Industry Revenue Breakdown (Million, %) by Region 2025 & 2033
- Figure 2: Global USA Electronic Access Control Systems Industry Volume Breakdown (K Unit, %) by Region 2025 & 2033
- Figure 3: North America USA Electronic Access Control Systems Industry Revenue (Million), by Type 2025 & 2033
- Figure 4: North America USA Electronic Access Control Systems Industry Volume (K Unit), by Type 2025 & 2033
- Figure 5: North America USA Electronic Access Control Systems Industry Revenue Share (%), by Type 2025 & 2033
- Figure 6: North America USA Electronic Access Control Systems Industry Volume Share (%), by Type 2025 & 2033
- Figure 7: North America USA Electronic Access Control Systems Industry Revenue (Million), by End User 2025 & 2033
- Figure 8: North America USA Electronic Access Control Systems Industry Volume (K Unit), by End User 2025 & 2033
- Figure 9: North America USA Electronic Access Control Systems Industry Revenue Share (%), by End User 2025 & 2033
- Figure 10: North America USA Electronic Access Control Systems Industry Volume Share (%), by End User 2025 & 2033
- Figure 11: North America USA Electronic Access Control Systems Industry Revenue (Million), by Country 2025 & 2033
- Figure 12: North America USA Electronic Access Control Systems Industry Volume (K Unit), by Country 2025 & 2033
- Figure 13: North America USA Electronic Access Control Systems Industry Revenue Share (%), by Country 2025 & 2033
- Figure 14: North America USA Electronic Access Control Systems Industry Volume Share (%), by Country 2025 & 2033
- Figure 15: South America USA Electronic Access Control Systems Industry Revenue (Million), by Type 2025 & 2033
- Figure 16: South America USA Electronic Access Control Systems Industry Volume (K Unit), by Type 2025 & 2033
- Figure 17: South America USA Electronic Access Control Systems Industry Revenue Share (%), by Type 2025 & 2033
- Figure 18: South America USA Electronic Access Control Systems Industry Volume Share (%), by Type 2025 & 2033
- Figure 19: South America USA Electronic Access Control Systems Industry Revenue (Million), by End User 2025 & 2033
- Figure 20: South America USA Electronic Access Control Systems Industry Volume (K Unit), by End User 2025 & 2033
- Figure 21: South America USA Electronic Access Control Systems Industry Revenue Share (%), by End User 2025 & 2033
- Figure 22: South America USA Electronic Access Control Systems Industry Volume Share (%), by End User 2025 & 2033
- Figure 23: South America USA Electronic Access Control Systems Industry Revenue (Million), by Country 2025 & 2033
- Figure 24: South America USA Electronic Access Control Systems Industry Volume (K Unit), by Country 2025 & 2033
- Figure 25: South America USA Electronic Access Control Systems Industry Revenue Share (%), by Country 2025 & 2033
- Figure 26: South America USA Electronic Access Control Systems Industry Volume Share (%), by Country 2025 & 2033
- Figure 27: Europe USA Electronic Access Control Systems Industry Revenue (Million), by Type 2025 & 2033
- Figure 28: Europe USA Electronic Access Control Systems Industry Volume (K Unit), by Type 2025 & 2033
- Figure 29: Europe USA Electronic Access Control Systems Industry Revenue Share (%), by Type 2025 & 2033
- Figure 30: Europe USA Electronic Access Control Systems Industry Volume Share (%), by Type 2025 & 2033
- Figure 31: Europe USA Electronic Access Control Systems Industry Revenue (Million), by End User 2025 & 2033
- Figure 32: Europe USA Electronic Access Control Systems Industry Volume (K Unit), by End User 2025 & 2033
- Figure 33: Europe USA Electronic Access Control Systems Industry Revenue Share (%), by End User 2025 & 2033
- Figure 34: Europe USA Electronic Access Control Systems Industry Volume Share (%), by End User 2025 & 2033
- Figure 35: Europe USA Electronic Access Control Systems Industry Revenue (Million), by Country 2025 & 2033
- Figure 36: Europe USA Electronic Access Control Systems Industry Volume (K Unit), by Country 2025 & 2033
- Figure 37: Europe USA Electronic Access Control Systems Industry Revenue Share (%), by Country 2025 & 2033
- Figure 38: Europe USA Electronic Access Control Systems Industry Volume Share (%), by Country 2025 & 2033
- Figure 39: Middle East & Africa USA Electronic Access Control Systems Industry Revenue (Million), by Type 2025 & 2033
- Figure 40: Middle East & Africa USA Electronic Access Control Systems Industry Volume (K Unit), by Type 2025 & 2033
- Figure 41: Middle East & Africa USA Electronic Access Control Systems Industry Revenue Share (%), by Type 2025 & 2033
- Figure 42: Middle East & Africa USA Electronic Access Control Systems Industry Volume Share (%), by Type 2025 & 2033
- Figure 43: Middle East & Africa USA Electronic Access Control Systems Industry Revenue (Million), by End User 2025 & 2033
- Figure 44: Middle East & Africa USA Electronic Access Control Systems Industry Volume (K Unit), by End User 2025 & 2033
- Figure 45: Middle East & Africa USA Electronic Access Control Systems Industry Revenue Share (%), by End User 2025 & 2033
- Figure 46: Middle East & Africa USA Electronic Access Control Systems Industry Volume Share (%), by End User 2025 & 2033
- Figure 47: Middle East & Africa USA Electronic Access Control Systems Industry Revenue (Million), by Country 2025 & 2033
- Figure 48: Middle East & Africa USA Electronic Access Control Systems Industry Volume (K Unit), by Country 2025 & 2033
- Figure 49: Middle East & Africa USA Electronic Access Control Systems Industry Revenue Share (%), by Country 2025 & 2033
- Figure 50: Middle East & Africa USA Electronic Access Control Systems Industry Volume Share (%), by Country 2025 & 2033
- Figure 51: Asia Pacific USA Electronic Access Control Systems Industry Revenue (Million), by Type 2025 & 2033
- Figure 52: Asia Pacific USA Electronic Access Control Systems Industry Volume (K Unit), by Type 2025 & 2033
- Figure 53: Asia Pacific USA Electronic Access Control Systems Industry Revenue Share (%), by Type 2025 & 2033
- Figure 54: Asia Pacific USA Electronic Access Control Systems Industry Volume Share (%), by Type 2025 & 2033
- Figure 55: Asia Pacific USA Electronic Access Control Systems Industry Revenue (Million), by End User 2025 & 2033
- Figure 56: Asia Pacific USA Electronic Access Control Systems Industry Volume (K Unit), by End User 2025 & 2033
- Figure 57: Asia Pacific USA Electronic Access Control Systems Industry Revenue Share (%), by End User 2025 & 2033
- Figure 58: Asia Pacific USA Electronic Access Control Systems Industry Volume Share (%), by End User 2025 & 2033
- Figure 59: Asia Pacific USA Electronic Access Control Systems Industry Revenue (Million), by Country 2025 & 2033
- Figure 60: Asia Pacific USA Electronic Access Control Systems Industry Volume (K Unit), by Country 2025 & 2033
- Figure 61: Asia Pacific USA Electronic Access Control Systems Industry Revenue Share (%), by Country 2025 & 2033
- Figure 62: Asia Pacific USA Electronic Access Control Systems Industry Volume Share (%), by Country 2025 & 2033
List of Tables
- Table 1: Global USA Electronic Access Control Systems Industry Revenue Million Forecast, by Type 2020 & 2033
- Table 2: Global USA Electronic Access Control Systems Industry Volume K Unit Forecast, by Type 2020 & 2033
- Table 3: Global USA Electronic Access Control Systems Industry Revenue Million Forecast, by End User 2020 & 2033
- Table 4: Global USA Electronic Access Control Systems Industry Volume K Unit Forecast, by End User 2020 & 2033
- Table 5: Global USA Electronic Access Control Systems Industry Revenue Million Forecast, by Region 2020 & 2033
- Table 6: Global USA Electronic Access Control Systems Industry Volume K Unit Forecast, by Region 2020 & 2033
- Table 7: Global USA Electronic Access Control Systems Industry Revenue Million Forecast, by Type 2020 & 2033
- Table 8: Global USA Electronic Access Control Systems Industry Volume K Unit Forecast, by Type 2020 & 2033
- Table 9: Global USA Electronic Access Control Systems Industry Revenue Million Forecast, by End User 2020 & 2033
- Table 10: Global USA Electronic Access Control Systems Industry Volume K Unit Forecast, by End User 2020 & 2033
- Table 11: Global USA Electronic Access Control Systems Industry Revenue Million Forecast, by Country 2020 & 2033
- Table 12: Global USA Electronic Access Control Systems Industry Volume K Unit Forecast, by Country 2020 & 2033
- Table 13: United States USA Electronic Access Control Systems Industry Revenue (Million) Forecast, by Application 2020 & 2033
- Table 14: United States USA Electronic Access Control Systems Industry Volume (K Unit) Forecast, by Application 2020 & 2033
- Table 15: Canada USA Electronic Access Control Systems Industry Revenue (Million) Forecast, by Application 2020 & 2033
- Table 16: Canada USA Electronic Access Control Systems Industry Volume (K Unit) Forecast, by Application 2020 & 2033
- Table 17: Mexico USA Electronic Access Control Systems Industry Revenue (Million) Forecast, by Application 2020 & 2033
- Table 18: Mexico USA Electronic Access Control Systems Industry Volume (K Unit) Forecast, by Application 2020 & 2033
- Table 19: Global USA Electronic Access Control Systems Industry Revenue Million Forecast, by Type 2020 & 2033
- Table 20: Global USA Electronic Access Control Systems Industry Volume K Unit Forecast, by Type 2020 & 2033
- Table 21: Global USA Electronic Access Control Systems Industry Revenue Million Forecast, by End User 2020 & 2033
- Table 22: Global USA Electronic Access Control Systems Industry Volume K Unit Forecast, by End User 2020 & 2033
- Table 23: Global USA Electronic Access Control Systems Industry Revenue Million Forecast, by Country 2020 & 2033
- Table 24: Global USA Electronic Access Control Systems Industry Volume K Unit Forecast, by Country 2020 & 2033
- Table 25: Brazil USA Electronic Access Control Systems Industry Revenue (Million) Forecast, by Application 2020 & 2033
- Table 26: Brazil USA Electronic Access Control Systems Industry Volume (K Unit) Forecast, by Application 2020 & 2033
- Table 27: Argentina USA Electronic Access Control Systems Industry Revenue (Million) Forecast, by Application 2020 & 2033
- Table 28: Argentina USA Electronic Access Control Systems Industry Volume (K Unit) Forecast, by Application 2020 & 2033
- Table 29: Rest of South America USA Electronic Access Control Systems Industry Revenue (Million) Forecast, by Application 2020 & 2033
- Table 30: Rest of South America USA Electronic Access Control Systems Industry Volume (K Unit) Forecast, by Application 2020 & 2033
- Table 31: Global USA Electronic Access Control Systems Industry Revenue Million Forecast, by Type 2020 & 2033
- Table 32: Global USA Electronic Access Control Systems Industry Volume K Unit Forecast, by Type 2020 & 2033
- Table 33: Global USA Electronic Access Control Systems Industry Revenue Million Forecast, by End User 2020 & 2033
- Table 34: Global USA Electronic Access Control Systems Industry Volume K Unit Forecast, by End User 2020 & 2033
- Table 35: Global USA Electronic Access Control Systems Industry Revenue Million Forecast, by Country 2020 & 2033
- Table 36: Global USA Electronic Access Control Systems Industry Volume K Unit Forecast, by Country 2020 & 2033
- Table 37: United Kingdom USA Electronic Access Control Systems Industry Revenue (Million) Forecast, by Application 2020 & 2033
- Table 38: United Kingdom USA Electronic Access Control Systems Industry Volume (K Unit) Forecast, by Application 2020 & 2033
- Table 39: Germany USA Electronic Access Control Systems Industry Revenue (Million) Forecast, by Application 2020 & 2033
- Table 40: Germany USA Electronic Access Control Systems Industry Volume (K Unit) Forecast, by Application 2020 & 2033
- Table 41: France USA Electronic Access Control Systems Industry Revenue (Million) Forecast, by Application 2020 & 2033
- Table 42: France USA Electronic Access Control Systems Industry Volume (K Unit) Forecast, by Application 2020 & 2033
- Table 43: Italy USA Electronic Access Control Systems Industry Revenue (Million) Forecast, by Application 2020 & 2033
- Table 44: Italy USA Electronic Access Control Systems Industry Volume (K Unit) Forecast, by Application 2020 & 2033
- Table 45: Spain USA Electronic Access Control Systems Industry Revenue (Million) Forecast, by Application 2020 & 2033
- Table 46: Spain USA Electronic Access Control Systems Industry Volume (K Unit) Forecast, by Application 2020 & 2033
- Table 47: Russia USA Electronic Access Control Systems Industry Revenue (Million) Forecast, by Application 2020 & 2033
- Table 48: Russia USA Electronic Access Control Systems Industry Volume (K Unit) Forecast, by Application 2020 & 2033
- Table 49: Benelux USA Electronic Access Control Systems Industry Revenue (Million) Forecast, by Application 2020 & 2033
- Table 50: Benelux USA Electronic Access Control Systems Industry Volume (K Unit) Forecast, by Application 2020 & 2033
- Table 51: Nordics USA Electronic Access Control Systems Industry Revenue (Million) Forecast, by Application 2020 & 2033
- Table 52: Nordics USA Electronic Access Control Systems Industry Volume (K Unit) Forecast, by Application 2020 & 2033
- Table 53: Rest of Europe USA Electronic Access Control Systems Industry Revenue (Million) Forecast, by Application 2020 & 2033
- Table 54: Rest of Europe USA Electronic Access Control Systems Industry Volume (K Unit) Forecast, by Application 2020 & 2033
- Table 55: Global USA Electronic Access Control Systems Industry Revenue Million Forecast, by Type 2020 & 2033
- Table 56: Global USA Electronic Access Control Systems Industry Volume K Unit Forecast, by Type 2020 & 2033
- Table 57: Global USA Electronic Access Control Systems Industry Revenue Million Forecast, by End User 2020 & 2033
- Table 58: Global USA Electronic Access Control Systems Industry Volume K Unit Forecast, by End User 2020 & 2033
- Table 59: Global USA Electronic Access Control Systems Industry Revenue Million Forecast, by Country 2020 & 2033
- Table 60: Global USA Electronic Access Control Systems Industry Volume K Unit Forecast, by Country 2020 & 2033
- Table 61: Turkey USA Electronic Access Control Systems Industry Revenue (Million) Forecast, by Application 2020 & 2033
- Table 62: Turkey USA Electronic Access Control Systems Industry Volume (K Unit) Forecast, by Application 2020 & 2033
- Table 63: Israel USA Electronic Access Control Systems Industry Revenue (Million) Forecast, by Application 2020 & 2033
- Table 64: Israel USA Electronic Access Control Systems Industry Volume (K Unit) Forecast, by Application 2020 & 2033
- Table 65: GCC USA Electronic Access Control Systems Industry Revenue (Million) Forecast, by Application 2020 & 2033
- Table 66: GCC USA Electronic Access Control Systems Industry Volume (K Unit) Forecast, by Application 2020 & 2033
- Table 67: North Africa USA Electronic Access Control Systems Industry Revenue (Million) Forecast, by Application 2020 & 2033
- Table 68: North Africa USA Electronic Access Control Systems Industry Volume (K Unit) Forecast, by Application 2020 & 2033
- Table 69: South Africa USA Electronic Access Control Systems Industry Revenue (Million) Forecast, by Application 2020 & 2033
- Table 70: South Africa USA Electronic Access Control Systems Industry Volume (K Unit) Forecast, by Application 2020 & 2033
- Table 71: Rest of Middle East & Africa USA Electronic Access Control Systems Industry Revenue (Million) Forecast, by Application 2020 & 2033
- Table 72: Rest of Middle East & Africa USA Electronic Access Control Systems Industry Volume (K Unit) Forecast, by Application 2020 & 2033
- Table 73: Global USA Electronic Access Control Systems Industry Revenue Million Forecast, by Type 2020 & 2033
- Table 74: Global USA Electronic Access Control Systems Industry Volume K Unit Forecast, by Type 2020 & 2033
- Table 75: Global USA Electronic Access Control Systems Industry Revenue Million Forecast, by End User 2020 & 2033
- Table 76: Global USA Electronic Access Control Systems Industry Volume K Unit Forecast, by End User 2020 & 2033
- Table 77: Global USA Electronic Access Control Systems Industry Revenue Million Forecast, by Country 2020 & 2033
- Table 78: Global USA Electronic Access Control Systems Industry Volume K Unit Forecast, by Country 2020 & 2033
- Table 79: China USA Electronic Access Control Systems Industry Revenue (Million) Forecast, by Application 2020 & 2033
- Table 80: China USA Electronic Access Control Systems Industry Volume (K Unit) Forecast, by Application 2020 & 2033
- Table 81: India USA Electronic Access Control Systems Industry Revenue (Million) Forecast, by Application 2020 & 2033
- Table 82: India USA Electronic Access Control Systems Industry Volume (K Unit) Forecast, by Application 2020 & 2033
- Table 83: Japan USA Electronic Access Control Systems Industry Revenue (Million) Forecast, by Application 2020 & 2033
- Table 84: Japan USA Electronic Access Control Systems Industry Volume (K Unit) Forecast, by Application 2020 & 2033
- Table 85: South Korea USA Electronic Access Control Systems Industry Revenue (Million) Forecast, by Application 2020 & 2033
- Table 86: South Korea USA Electronic Access Control Systems Industry Volume (K Unit) Forecast, by Application 2020 & 2033
- Table 87: ASEAN USA Electronic Access Control Systems Industry Revenue (Million) Forecast, by Application 2020 & 2033
- Table 88: ASEAN USA Electronic Access Control Systems Industry Volume (K Unit) Forecast, by Application 2020 & 2033
- Table 89: Oceania USA Electronic Access Control Systems Industry Revenue (Million) Forecast, by Application 2020 & 2033
- Table 90: Oceania USA Electronic Access Control Systems Industry Volume (K Unit) Forecast, by Application 2020 & 2033
- Table 91: Rest of Asia Pacific USA Electronic Access Control Systems Industry Revenue (Million) Forecast, by Application 2020 & 2033
- Table 92: Rest of Asia Pacific USA Electronic Access Control Systems Industry Volume (K Unit) Forecast, by Application 2020 & 2033
Frequently Asked Questions
1. What is the projected Compound Annual Growth Rate (CAGR) of the USA Electronic Access Control Systems Industry?
The projected CAGR is approximately 4.29%.
2. Which companies are prominent players in the USA Electronic Access Control Systems Industry?
Key companies in the market include Allegion PLC, Johnson Controls International PLC, Stanley Black & Decker Inc , Assa Abloy AB Group, United Technologies Corporation, Honeywell Security Group, Schneider Electric SE, Bosch Security System Inc, dormakaba Holding AG, IDEMIA Identity & Security SAS.
3. What are the main segments of the USA Electronic Access Control Systems Industry?
The market segments include Type, End User.
4. Can you provide details about the market size?
The market size is estimated to be USD 3.63 Million as of 2022.
5. What are some drivers contributing to market growth?
Increasing Safety and Security Concerns; Increasing Adoption of Smart Home Architecture.
6. What are the notable trends driving market growth?
The Healthcare Sector to Hold the Major Market Share.
7. Are there any restraints impacting market growth?
High cost involved in replacing the existing Deep UV with EUV lasers; Monopoly existing within the market.
8. Can you provide examples of recent developments in the market?
N/A
9. What pricing options are available for accessing the report?
Pricing options include single-user, multi-user, and enterprise licenses priced at USD 3800, USD 4500, and USD 5800 respectively.
10. Is the market size provided in terms of value or volume?
The market size is provided in terms of value, measured in Million and volume, measured in K Unit.
11. Are there any specific market keywords associated with the report?
Yes, the market keyword associated with the report is "USA Electronic Access Control Systems Industry," which aids in identifying and referencing the specific market segment covered.
12. How do I determine which pricing option suits my needs best?
The pricing options vary based on user requirements and access needs. Individual users may opt for single-user licenses, while businesses requiring broader access may choose multi-user or enterprise licenses for cost-effective access to the report.
13. Are there any additional resources or data provided in the USA Electronic Access Control Systems Industry report?
While the report offers comprehensive insights, it's advisable to review the specific contents or supplementary materials provided to ascertain if additional resources or data are available.
14. How can I stay updated on further developments or reports in the USA Electronic Access Control Systems Industry?
To stay informed about further developments, trends, and reports in the USA Electronic Access Control Systems Industry, consider subscribing to industry newsletters, following relevant companies and organizations, or regularly checking reputable industry news sources and publications.
Methodology
Step 1 - Identification of Relevant Samples Size from Population Database


Step 2 - Approaches for Defining Global Market Size (Value, Volume* & Price*)

Note*: In applicable scenarios
Step 3 - Data Sources
Primary Research
- Web Analytics
- Survey Reports
- Research Institute
- Latest Research Reports
- Opinion Leaders
Secondary Research
- Annual Reports
- White Paper
- Latest Press Release
- Industry Association
- Paid Database
- Investor Presentations

Step 4 - Data Triangulation
Involves using different sources of information in order to increase the validity of a study
These sources are likely to be stakeholders in a program - participants, other researchers, program staff, other community members, and so on.
Then we put all data in single framework & apply various statistical tools to find out the dynamic on the market.
During the analysis stage, feedback from the stakeholder groups would be compared to determine areas of agreement as well as areas of divergence