
Key Insights
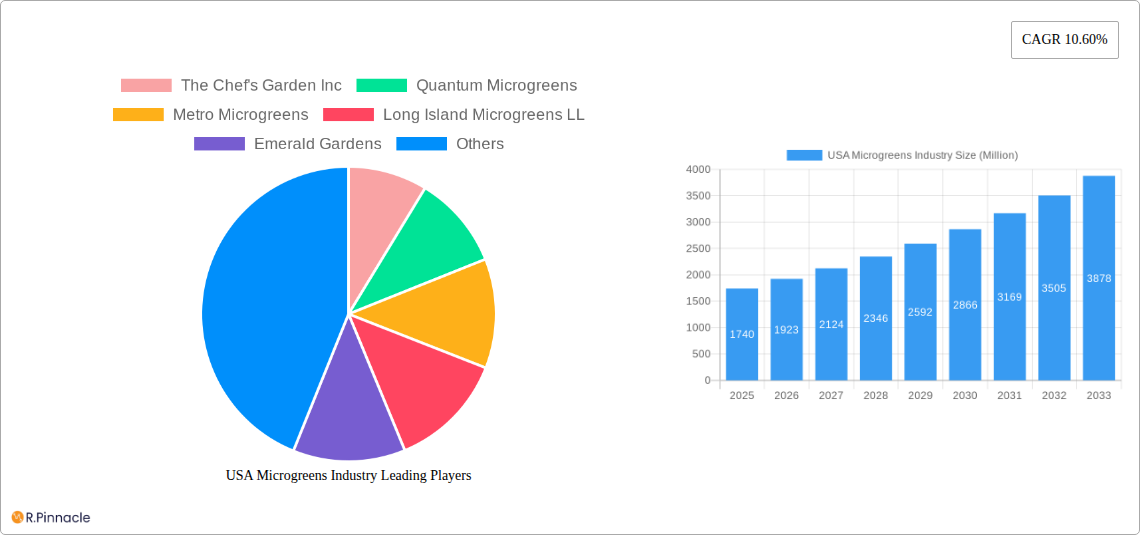
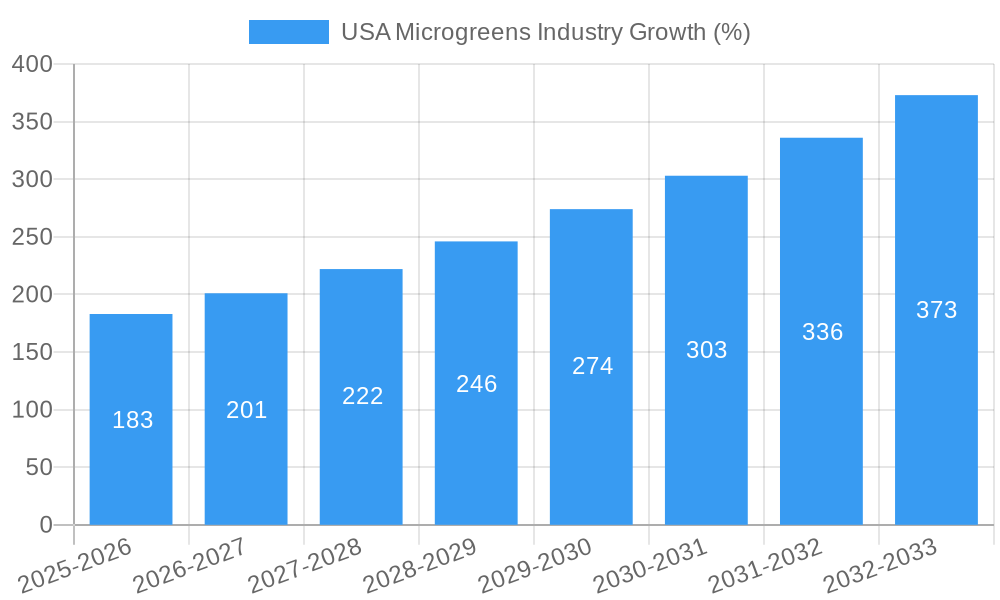
The U.S. microgreens industry, valued at $1.74 billion in 2025, is experiencing robust growth, projected to expand at a compound annual growth rate (CAGR) of 10.60% from 2025 to 2033. This surge is driven by several key factors. Increased consumer awareness of the nutritional benefits of microgreens, their versatility in culinary applications, and the growing demand for locally sourced and sustainable produce are significant contributors. The rise of indoor farming techniques, such as vertical farming and commercial greenhouses, is also fueling expansion, allowing for year-round production and reduced reliance on traditional agricultural methods. The industry is segmented by sales channels (hypermarkets/supermarkets, restaurants, other channels) and microgreen types (broccoli, lettuce & chicory, basil, fennel, and others), reflecting diverse consumer preferences and market segments. Competition is relatively high, with established players like AeroFarms LLC and emerging companies vying for market share. While the industry faces challenges such as managing production costs and ensuring consistent product quality, the overall outlook remains positive due to continued consumer preference shifts towards healthier eating and innovative agricultural practices.
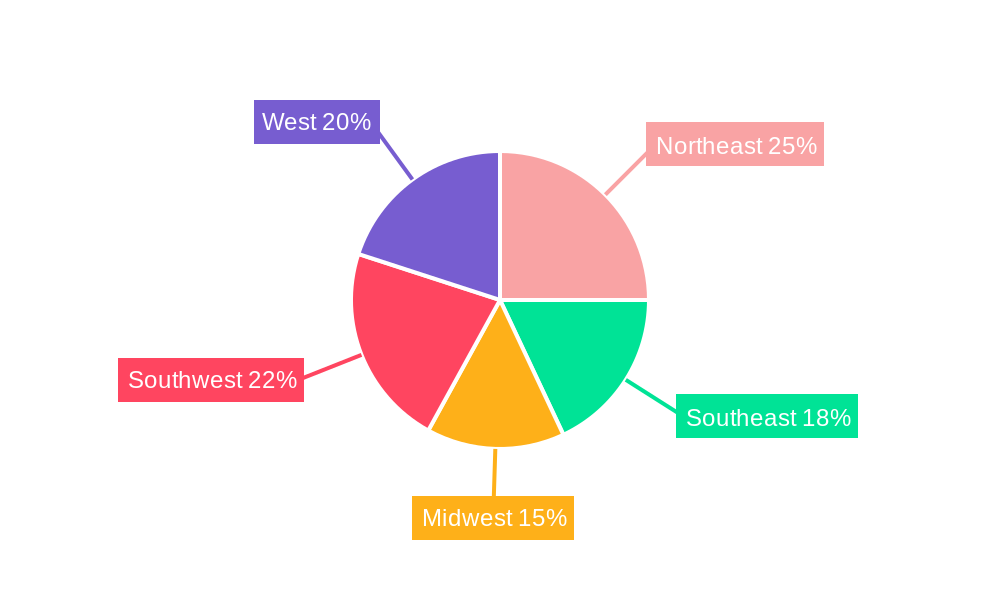
The regional distribution of the U.S. microgreens market shows varied growth potential across the Northeast, Southeast, Midwest, Southwest, and West regions. The Northeast and West, with their higher concentrations of population and health-conscious consumers, may present the strongest growth opportunities. However, expanding distribution networks and targeted marketing strategies are crucial for penetrating all regions effectively. Future growth will likely be influenced by advancements in indoor farming technology, further innovation in packaging and preservation to extend shelf life, and potentially, government support for sustainable agricultural practices. The ongoing expansion of the food service sector, particularly restaurants emphasizing fresh and locally sourced ingredients, will also positively impact industry growth. Competitive pressures will likely remain intense, prompting companies to focus on differentiation through product variety, quality control, and brand building.
USA Microgreens Industry Market Report: 2019-2033
This comprehensive report provides a detailed analysis of the USA microgreens industry, offering invaluable insights for industry professionals, investors, and stakeholders. The report covers the period 2019-2033, with a focus on the 2025-2033 forecast period. Discover key market trends, growth drivers, challenges, and opportunities within this dynamic sector.
USA Microgreens Industry Market Structure & Innovation Trends
This section analyzes the competitive landscape of the US microgreens market, encompassing market concentration, innovation drivers, regulatory frameworks, product substitutes, end-user demographics, and M&A activities. The report examines the market share held by key players such as The Chef's Garden Inc, Quantum Microgreens, Metro Microgreens, Long Island Microgreens LL, Emerald Gardens, Fresh Origins, Florida Microgreens, Farmbox Greens LLC, Arizona Microgreens LLC, and AeroFarms LLC. We delve into the impact of M&A activities, estimating a total M&A deal value of approximately $xx Million during the historical period. The report further explores the influence of regulatory frameworks on innovation and market growth, and analyzes the role of substitute products, such as conventionally grown greens. End-user demographics are analyzed to understand consumption patterns and preferences. Market share data for major players will be presented, illustrating the current concentration of the market.
USA Microgreens Industry Market Dynamics & Trends
This section details the market dynamics shaping the US microgreens industry. We analyze the Compound Annual Growth Rate (CAGR) for the historical period (2019-2024) and provide a forecast CAGR for the period 2025-2033. This includes an analysis of market growth drivers such as increasing consumer demand for healthy and nutritious food, rising disposable incomes, and the growing popularity of plant-based diets. Technological disruptions, such as advancements in vertical farming and indoor agricultural techniques, are examined, as are consumer preferences regarding product types (e.g., Broccoli, Lettuce and Chicory, Basil, etc.) and sales channels (Hypermarket/Supermarket, Restaurants, Other Channels). The competitive dynamics are evaluated, taking into account factors such as pricing strategies, product differentiation, and marketing efforts. Market penetration rates for various microgreen types across different sales channels are quantified.
Dominant Regions & Segments in USA Microgreens Industry
This section identifies the dominant regions and segments within the US microgreens market. We analyze regional variations in growth rates, consumer preferences, and competitive intensity.
Leading Sales Channels: The report details the market share and growth projections for each sales channel (Hypermarket/Supermarket, Restaurants, Other Channels). Key drivers for dominance in each segment are discussed. For example, the rise of restaurants focusing on farm-to-table menus drives the restaurant segment's growth.
Dominant Farming Techniques: The report compares and contrasts Indoor Farming, Vertical Farming, Commercial Greenhouses, and Other Farming Techniques. It analyzes the market share of each and explores factors influencing their dominance, like cost-efficiency and scalability.
Most Popular Microgreen Types: The report analyzes market share and growth prospects for each microgreen type (Broccoli, Lettuce and Chicory, Basil, Fennel, Carrots, Radish, Amaranth, Arugula, Beets, Mustard, Kale, Cress and Chard). Key drivers such as consumer preferences and nutritional benefits are discussed.
Detailed analysis of each segment's dominance will be provided, including the identification of specific regions (e.g., California's dominance in the West Coast market). Economic policies and infrastructure development influencing regional growth are also explored.
USA Microgreens Industry Product Innovations
This section highlights recent product developments, applications, and competitive advantages in the US microgreens market. The emphasis is on technological trends and market fit, such as the adoption of hydroponics and aeroponics, leading to higher yields and improved quality. Innovations driving competitiveness, such as new packaging methods to maintain freshness and unique product offerings (e.g., specialty blends), will be detailed.
Report Scope & Segmentation Analysis
This report segments the US microgreens market based on sales channel (Hypermarket/Supermarket, Restaurants, Other Channels), farming technique (Indoor Farming, Vertical Farming, Commercial Greenhouses, Other Farming Techniques), and microgreen type (Broccoli, Lettuce and Chicory, Basil, Fennel, Carrots, Radish, Amaranth, Arugula, Beets, Mustard, Kale, Cress and Chard). Each segment's market size, growth projections, and competitive dynamics will be comprehensively analyzed. For example, the hypermarket/supermarket segment's growth will be tied to consumer trends and retail strategies.
Key Drivers of USA Microgreens Industry Growth
The growth of the US microgreens industry is driven by factors such as increasing health consciousness among consumers, the rising popularity of plant-based diets, and advancements in farming technology resulting in increased efficiency and lower production costs. Favorable government regulations supporting sustainable agriculture also contribute significantly. Specific examples will be provided, illustrating the quantifiable impact of these factors on market expansion.
Challenges in the USA Microgreens Industry Sector
Challenges in the US microgreens industry include maintaining consistent product quality, managing supply chain complexities, and facing competition from established produce companies. Regulatory hurdles and seasonal variations in production also pose significant challenges, affecting overall market growth and profitability. The report quantifies these challenges, where possible, through analysis of market data and industry reports.
Emerging Opportunities in USA Microgreens Industry
Emerging opportunities in the US microgreens industry include expanding into new market segments (e.g., direct-to-consumer sales), adopting innovative marketing strategies, and leveraging technology to enhance production efficiency and reduce waste. Growing demand for sustainable and locally sourced food presents considerable opportunities for growth, as does the increasing acceptance of microgreens in diverse culinary applications.
Leading Players in the USA Microgreens Industry Market
- The Chef's Garden Inc
- Quantum Microgreens
- Metro Microgreens
- Long Island Microgreens LL
- Emerald Gardens
- Fresh Origins
- Florida Microgreens
- Farmbox Greens LLC
- Arizona Microgreens LLC
- AeroFarms LLC
Key Developments in USA Microgreens Industry Industry
September 2022: AeroFarms established the world's largest aeroponic smart farm in Danville, VA, capable of producing over 3 million lbs of leafy greens annually. This significantly increased the company's production capacity and market share.
July 2022: AeroFarms expanded its vertical farm in Pittsylvania County, further increasing its production capacity to meet growing consumer demand.
February 2022: Infarm established a new vertical farming center in Texas, adding over 40,000 sq ft of growing capacity to the market and bolstering the regional microgreens market.
Future Outlook for USA Microgreens Industry Market
The US microgreens industry is poised for robust growth over the forecast period (2025-2033), driven by continued consumer demand for healthy and convenient food options and the ongoing advancements in vertical farming technologies. Strategic partnerships, product diversification, and expanding into new markets will be critical for success. The industry's potential for sustainable and efficient food production positions it for significant expansion in the coming years.
USA Microgreens Industry Segmentation
- 1. Production Analysis
- 2. Consumption Analysis
- 3. Import Market Analysis (Value & Volume)
- 4. Export Market Analysis (Value & Volume)
- 5. Price Trend Analysis
USA Microgreens Industry Segmentation By Geography
-
1. North America
- 1.1. United States
- 1.2. Canada
- 1.3. Mexico
-
2. South America
- 2.1. Brazil
- 2.2. Argentina
- 2.3. Rest of South America
-
3. Europe
- 3.1. United Kingdom
- 3.2. Germany
- 3.3. France
- 3.4. Italy
- 3.5. Spain
- 3.6. Russia
- 3.7. Benelux
- 3.8. Nordics
- 3.9. Rest of Europe
-
4. Middle East & Africa
- 4.1. Turkey
- 4.2. Israel
- 4.3. GCC
- 4.4. North Africa
- 4.5. South Africa
- 4.6. Rest of Middle East & Africa
-
5. Asia Pacific
- 5.1. China
- 5.2. India
- 5.3. Japan
- 5.4. South Korea
- 5.5. ASEAN
- 5.6. Oceania
- 5.7. Rest of Asia Pacific
USA Microgreens Industry REPORT HIGHLIGHTS
| Aspects | Details |
|---|---|
| Study Period | 2019-2033 |
| Base Year | 2024 |
| Estimated Year | 2025 |
| Forecast Period | 2025-2033 |
| Historical Period | 2019-2024 |
| Growth Rate | CAGR of 10.60% from 2019-2033 |
| Segmentation |
|
Table of Contents
- 1. Introduction
- 1.1. Research Scope
- 1.2. Market Segmentation
- 1.3. Research Methodology
- 1.4. Definitions and Assumptions
- 2. Executive Summary
- 2.1. Introduction
- 3. Market Dynamics
- 3.1. Introduction
- 3.2. Market Drivers
- 3.2.1. Need for Custom Product Development; Use of CROs for Regulatory Services
- 3.3. Market Restrains
- 3.3.1. Data and Cyber Security Concerns; Lack of Experts and Professionals in this Industry
- 3.4. Market Trends
- 3.4.1. Increased Investments in Vertical Farming Domain
- 4. Market Factor Analysis
- 4.1. Porters Five Forces
- 4.2. Supply/Value Chain
- 4.3. PESTEL analysis
- 4.4. Market Entropy
- 4.5. Patent/Trademark Analysis
- 5. Global USA Microgreens Industry Analysis, Insights and Forecast, 2019-2031
- 5.1. Market Analysis, Insights and Forecast - by Production Analysis
- 5.2. Market Analysis, Insights and Forecast - by Consumption Analysis
- 5.3. Market Analysis, Insights and Forecast - by Import Market Analysis (Value & Volume)
- 5.4. Market Analysis, Insights and Forecast - by Export Market Analysis (Value & Volume)
- 5.5. Market Analysis, Insights and Forecast - by Price Trend Analysis
- 5.6. Market Analysis, Insights and Forecast - by Region
- 5.6.1. North America
- 5.6.2. South America
- 5.6.3. Europe
- 5.6.4. Middle East & Africa
- 5.6.5. Asia Pacific
- 5.1. Market Analysis, Insights and Forecast - by Production Analysis
- 6. North America USA Microgreens Industry Analysis, Insights and Forecast, 2019-2031
- 6.1. Market Analysis, Insights and Forecast - by Production Analysis
- 6.2. Market Analysis, Insights and Forecast - by Consumption Analysis
- 6.3. Market Analysis, Insights and Forecast - by Import Market Analysis (Value & Volume)
- 6.4. Market Analysis, Insights and Forecast - by Export Market Analysis (Value & Volume)
- 6.5. Market Analysis, Insights and Forecast - by Price Trend Analysis
- 6.1. Market Analysis, Insights and Forecast - by Production Analysis
- 7. South America USA Microgreens Industry Analysis, Insights and Forecast, 2019-2031
- 7.1. Market Analysis, Insights and Forecast - by Production Analysis
- 7.2. Market Analysis, Insights and Forecast - by Consumption Analysis
- 7.3. Market Analysis, Insights and Forecast - by Import Market Analysis (Value & Volume)
- 7.4. Market Analysis, Insights and Forecast - by Export Market Analysis (Value & Volume)
- 7.5. Market Analysis, Insights and Forecast - by Price Trend Analysis
- 7.1. Market Analysis, Insights and Forecast - by Production Analysis
- 8. Europe USA Microgreens Industry Analysis, Insights and Forecast, 2019-2031
- 8.1. Market Analysis, Insights and Forecast - by Production Analysis
- 8.2. Market Analysis, Insights and Forecast - by Consumption Analysis
- 8.3. Market Analysis, Insights and Forecast - by Import Market Analysis (Value & Volume)
- 8.4. Market Analysis, Insights and Forecast - by Export Market Analysis (Value & Volume)
- 8.5. Market Analysis, Insights and Forecast - by Price Trend Analysis
- 8.1. Market Analysis, Insights and Forecast - by Production Analysis
- 9. Middle East & Africa USA Microgreens Industry Analysis, Insights and Forecast, 2019-2031
- 9.1. Market Analysis, Insights and Forecast - by Production Analysis
- 9.2. Market Analysis, Insights and Forecast - by Consumption Analysis
- 9.3. Market Analysis, Insights and Forecast - by Import Market Analysis (Value & Volume)
- 9.4. Market Analysis, Insights and Forecast - by Export Market Analysis (Value & Volume)
- 9.5. Market Analysis, Insights and Forecast - by Price Trend Analysis
- 9.1. Market Analysis, Insights and Forecast - by Production Analysis
- 10. Asia Pacific USA Microgreens Industry Analysis, Insights and Forecast, 2019-2031
- 10.1. Market Analysis, Insights and Forecast - by Production Analysis
- 10.2. Market Analysis, Insights and Forecast - by Consumption Analysis
- 10.3. Market Analysis, Insights and Forecast - by Import Market Analysis (Value & Volume)
- 10.4. Market Analysis, Insights and Forecast - by Export Market Analysis (Value & Volume)
- 10.5. Market Analysis, Insights and Forecast - by Price Trend Analysis
- 10.1. Market Analysis, Insights and Forecast - by Production Analysis
- 11. Northeast USA Microgreens Industry Analysis, Insights and Forecast, 2019-2031
- 12. Southeast USA Microgreens Industry Analysis, Insights and Forecast, 2019-2031
- 13. Midwest USA Microgreens Industry Analysis, Insights and Forecast, 2019-2031
- 14. Southwest USA Microgreens Industry Analysis, Insights and Forecast, 2019-2031
- 15. West USA Microgreens Industry Analysis, Insights and Forecast, 2019-2031
- 16. Competitive Analysis
- 16.1. Global Market Share Analysis 2024
- 16.2. Company Profiles
- 16.2.1 The Chef's Garden Inc
- 16.2.1.1. Overview
- 16.2.1.2. Products
- 16.2.1.3. SWOT Analysis
- 16.2.1.4. Recent Developments
- 16.2.1.5. Financials (Based on Availability)
- 16.2.2 Quantum Microgreens
- 16.2.2.1. Overview
- 16.2.2.2. Products
- 16.2.2.3. SWOT Analysis
- 16.2.2.4. Recent Developments
- 16.2.2.5. Financials (Based on Availability)
- 16.2.3 Metro Microgreens
- 16.2.3.1. Overview
- 16.2.3.2. Products
- 16.2.3.3. SWOT Analysis
- 16.2.3.4. Recent Developments
- 16.2.3.5. Financials (Based on Availability)
- 16.2.4 Long Island Microgreens LL
- 16.2.4.1. Overview
- 16.2.4.2. Products
- 16.2.4.3. SWOT Analysis
- 16.2.4.4. Recent Developments
- 16.2.4.5. Financials (Based on Availability)
- 16.2.5 Emerald Gardens
- 16.2.5.1. Overview
- 16.2.5.2. Products
- 16.2.5.3. SWOT Analysis
- 16.2.5.4. Recent Developments
- 16.2.5.5. Financials (Based on Availability)
- 16.2.6 Fresh Origins
- 16.2.6.1. Overview
- 16.2.6.2. Products
- 16.2.6.3. SWOT Analysis
- 16.2.6.4. Recent Developments
- 16.2.6.5. Financials (Based on Availability)
- 16.2.7 Florida Microgreens
- 16.2.7.1. Overview
- 16.2.7.2. Products
- 16.2.7.3. SWOT Analysis
- 16.2.7.4. Recent Developments
- 16.2.7.5. Financials (Based on Availability)
- 16.2.8 Farmbox Greens LLC
- 16.2.8.1. Overview
- 16.2.8.2. Products
- 16.2.8.3. SWOT Analysis
- 16.2.8.4. Recent Developments
- 16.2.8.5. Financials (Based on Availability)
- 16.2.9 Arizona Microgreens LLC
- 16.2.9.1. Overview
- 16.2.9.2. Products
- 16.2.9.3. SWOT Analysis
- 16.2.9.4. Recent Developments
- 16.2.9.5. Financials (Based on Availability)
- 16.2.10 AeroFarms LLC
- 16.2.10.1. Overview
- 16.2.10.2. Products
- 16.2.10.3. SWOT Analysis
- 16.2.10.4. Recent Developments
- 16.2.10.5. Financials (Based on Availability)
- 16.2.1 The Chef's Garden Inc
List of Figures
- Figure 1: Global USA Microgreens Industry Revenue Breakdown (Million, %) by Region 2024 & 2032
- Figure 2: United states USA Microgreens Industry Revenue (Million), by Country 2024 & 2032
- Figure 3: United states USA Microgreens Industry Revenue Share (%), by Country 2024 & 2032
- Figure 4: North America USA Microgreens Industry Revenue (Million), by Production Analysis 2024 & 2032
- Figure 5: North America USA Microgreens Industry Revenue Share (%), by Production Analysis 2024 & 2032
- Figure 6: North America USA Microgreens Industry Revenue (Million), by Consumption Analysis 2024 & 2032
- Figure 7: North America USA Microgreens Industry Revenue Share (%), by Consumption Analysis 2024 & 2032
- Figure 8: North America USA Microgreens Industry Revenue (Million), by Import Market Analysis (Value & Volume) 2024 & 2032
- Figure 9: North America USA Microgreens Industry Revenue Share (%), by Import Market Analysis (Value & Volume) 2024 & 2032
- Figure 10: North America USA Microgreens Industry Revenue (Million), by Export Market Analysis (Value & Volume) 2024 & 2032
- Figure 11: North America USA Microgreens Industry Revenue Share (%), by Export Market Analysis (Value & Volume) 2024 & 2032
- Figure 12: North America USA Microgreens Industry Revenue (Million), by Price Trend Analysis 2024 & 2032
- Figure 13: North America USA Microgreens Industry Revenue Share (%), by Price Trend Analysis 2024 & 2032
- Figure 14: North America USA Microgreens Industry Revenue (Million), by Country 2024 & 2032
- Figure 15: North America USA Microgreens Industry Revenue Share (%), by Country 2024 & 2032
- Figure 16: South America USA Microgreens Industry Revenue (Million), by Production Analysis 2024 & 2032
- Figure 17: South America USA Microgreens Industry Revenue Share (%), by Production Analysis 2024 & 2032
- Figure 18: South America USA Microgreens Industry Revenue (Million), by Consumption Analysis 2024 & 2032
- Figure 19: South America USA Microgreens Industry Revenue Share (%), by Consumption Analysis 2024 & 2032
- Figure 20: South America USA Microgreens Industry Revenue (Million), by Import Market Analysis (Value & Volume) 2024 & 2032
- Figure 21: South America USA Microgreens Industry Revenue Share (%), by Import Market Analysis (Value & Volume) 2024 & 2032
- Figure 22: South America USA Microgreens Industry Revenue (Million), by Export Market Analysis (Value & Volume) 2024 & 2032
- Figure 23: South America USA Microgreens Industry Revenue Share (%), by Export Market Analysis (Value & Volume) 2024 & 2032
- Figure 24: South America USA Microgreens Industry Revenue (Million), by Price Trend Analysis 2024 & 2032
- Figure 25: South America USA Microgreens Industry Revenue Share (%), by Price Trend Analysis 2024 & 2032
- Figure 26: South America USA Microgreens Industry Revenue (Million), by Country 2024 & 2032
- Figure 27: South America USA Microgreens Industry Revenue Share (%), by Country 2024 & 2032
- Figure 28: Europe USA Microgreens Industry Revenue (Million), by Production Analysis 2024 & 2032
- Figure 29: Europe USA Microgreens Industry Revenue Share (%), by Production Analysis 2024 & 2032
- Figure 30: Europe USA Microgreens Industry Revenue (Million), by Consumption Analysis 2024 & 2032
- Figure 31: Europe USA Microgreens Industry Revenue Share (%), by Consumption Analysis 2024 & 2032
- Figure 32: Europe USA Microgreens Industry Revenue (Million), by Import Market Analysis (Value & Volume) 2024 & 2032
- Figure 33: Europe USA Microgreens Industry Revenue Share (%), by Import Market Analysis (Value & Volume) 2024 & 2032
- Figure 34: Europe USA Microgreens Industry Revenue (Million), by Export Market Analysis (Value & Volume) 2024 & 2032
- Figure 35: Europe USA Microgreens Industry Revenue Share (%), by Export Market Analysis (Value & Volume) 2024 & 2032
- Figure 36: Europe USA Microgreens Industry Revenue (Million), by Price Trend Analysis 2024 & 2032
- Figure 37: Europe USA Microgreens Industry Revenue Share (%), by Price Trend Analysis 2024 & 2032
- Figure 38: Europe USA Microgreens Industry Revenue (Million), by Country 2024 & 2032
- Figure 39: Europe USA Microgreens Industry Revenue Share (%), by Country 2024 & 2032
- Figure 40: Middle East & Africa USA Microgreens Industry Revenue (Million), by Production Analysis 2024 & 2032
- Figure 41: Middle East & Africa USA Microgreens Industry Revenue Share (%), by Production Analysis 2024 & 2032
- Figure 42: Middle East & Africa USA Microgreens Industry Revenue (Million), by Consumption Analysis 2024 & 2032
- Figure 43: Middle East & Africa USA Microgreens Industry Revenue Share (%), by Consumption Analysis 2024 & 2032
- Figure 44: Middle East & Africa USA Microgreens Industry Revenue (Million), by Import Market Analysis (Value & Volume) 2024 & 2032
- Figure 45: Middle East & Africa USA Microgreens Industry Revenue Share (%), by Import Market Analysis (Value & Volume) 2024 & 2032
- Figure 46: Middle East & Africa USA Microgreens Industry Revenue (Million), by Export Market Analysis (Value & Volume) 2024 & 2032
- Figure 47: Middle East & Africa USA Microgreens Industry Revenue Share (%), by Export Market Analysis (Value & Volume) 2024 & 2032
- Figure 48: Middle East & Africa USA Microgreens Industry Revenue (Million), by Price Trend Analysis 2024 & 2032
- Figure 49: Middle East & Africa USA Microgreens Industry Revenue Share (%), by Price Trend Analysis 2024 & 2032
- Figure 50: Middle East & Africa USA Microgreens Industry Revenue (Million), by Country 2024 & 2032
- Figure 51: Middle East & Africa USA Microgreens Industry Revenue Share (%), by Country 2024 & 2032
- Figure 52: Asia Pacific USA Microgreens Industry Revenue (Million), by Production Analysis 2024 & 2032
- Figure 53: Asia Pacific USA Microgreens Industry Revenue Share (%), by Production Analysis 2024 & 2032
- Figure 54: Asia Pacific USA Microgreens Industry Revenue (Million), by Consumption Analysis 2024 & 2032
- Figure 55: Asia Pacific USA Microgreens Industry Revenue Share (%), by Consumption Analysis 2024 & 2032
- Figure 56: Asia Pacific USA Microgreens Industry Revenue (Million), by Import Market Analysis (Value & Volume) 2024 & 2032
- Figure 57: Asia Pacific USA Microgreens Industry Revenue Share (%), by Import Market Analysis (Value & Volume) 2024 & 2032
- Figure 58: Asia Pacific USA Microgreens Industry Revenue (Million), by Export Market Analysis (Value & Volume) 2024 & 2032
- Figure 59: Asia Pacific USA Microgreens Industry Revenue Share (%), by Export Market Analysis (Value & Volume) 2024 & 2032
- Figure 60: Asia Pacific USA Microgreens Industry Revenue (Million), by Price Trend Analysis 2024 & 2032
- Figure 61: Asia Pacific USA Microgreens Industry Revenue Share (%), by Price Trend Analysis 2024 & 2032
- Figure 62: Asia Pacific USA Microgreens Industry Revenue (Million), by Country 2024 & 2032
- Figure 63: Asia Pacific USA Microgreens Industry Revenue Share (%), by Country 2024 & 2032
List of Tables
- Table 1: Global USA Microgreens Industry Revenue Million Forecast, by Region 2019 & 2032
- Table 2: Global USA Microgreens Industry Revenue Million Forecast, by Production Analysis 2019 & 2032
- Table 3: Global USA Microgreens Industry Revenue Million Forecast, by Consumption Analysis 2019 & 2032
- Table 4: Global USA Microgreens Industry Revenue Million Forecast, by Import Market Analysis (Value & Volume) 2019 & 2032
- Table 5: Global USA Microgreens Industry Revenue Million Forecast, by Export Market Analysis (Value & Volume) 2019 & 2032
- Table 6: Global USA Microgreens Industry Revenue Million Forecast, by Price Trend Analysis 2019 & 2032
- Table 7: Global USA Microgreens Industry Revenue Million Forecast, by Region 2019 & 2032
- Table 8: Global USA Microgreens Industry Revenue Million Forecast, by Country 2019 & 2032
- Table 9: Northeast USA Microgreens Industry Revenue (Million) Forecast, by Application 2019 & 2032
- Table 10: Southeast USA Microgreens Industry Revenue (Million) Forecast, by Application 2019 & 2032
- Table 11: Midwest USA Microgreens Industry Revenue (Million) Forecast, by Application 2019 & 2032
- Table 12: Southwest USA Microgreens Industry Revenue (Million) Forecast, by Application 2019 & 2032
- Table 13: West USA Microgreens Industry Revenue (Million) Forecast, by Application 2019 & 2032
- Table 14: Global USA Microgreens Industry Revenue Million Forecast, by Production Analysis 2019 & 2032
- Table 15: Global USA Microgreens Industry Revenue Million Forecast, by Consumption Analysis 2019 & 2032
- Table 16: Global USA Microgreens Industry Revenue Million Forecast, by Import Market Analysis (Value & Volume) 2019 & 2032
- Table 17: Global USA Microgreens Industry Revenue Million Forecast, by Export Market Analysis (Value & Volume) 2019 & 2032
- Table 18: Global USA Microgreens Industry Revenue Million Forecast, by Price Trend Analysis 2019 & 2032
- Table 19: Global USA Microgreens Industry Revenue Million Forecast, by Country 2019 & 2032
- Table 20: United States USA Microgreens Industry Revenue (Million) Forecast, by Application 2019 & 2032
- Table 21: Canada USA Microgreens Industry Revenue (Million) Forecast, by Application 2019 & 2032
- Table 22: Mexico USA Microgreens Industry Revenue (Million) Forecast, by Application 2019 & 2032
- Table 23: Global USA Microgreens Industry Revenue Million Forecast, by Production Analysis 2019 & 2032
- Table 24: Global USA Microgreens Industry Revenue Million Forecast, by Consumption Analysis 2019 & 2032
- Table 25: Global USA Microgreens Industry Revenue Million Forecast, by Import Market Analysis (Value & Volume) 2019 & 2032
- Table 26: Global USA Microgreens Industry Revenue Million Forecast, by Export Market Analysis (Value & Volume) 2019 & 2032
- Table 27: Global USA Microgreens Industry Revenue Million Forecast, by Price Trend Analysis 2019 & 2032
- Table 28: Global USA Microgreens Industry Revenue Million Forecast, by Country 2019 & 2032
- Table 29: Brazil USA Microgreens Industry Revenue (Million) Forecast, by Application 2019 & 2032
- Table 30: Argentina USA Microgreens Industry Revenue (Million) Forecast, by Application 2019 & 2032
- Table 31: Rest of South America USA Microgreens Industry Revenue (Million) Forecast, by Application 2019 & 2032
- Table 32: Global USA Microgreens Industry Revenue Million Forecast, by Production Analysis 2019 & 2032
- Table 33: Global USA Microgreens Industry Revenue Million Forecast, by Consumption Analysis 2019 & 2032
- Table 34: Global USA Microgreens Industry Revenue Million Forecast, by Import Market Analysis (Value & Volume) 2019 & 2032
- Table 35: Global USA Microgreens Industry Revenue Million Forecast, by Export Market Analysis (Value & Volume) 2019 & 2032
- Table 36: Global USA Microgreens Industry Revenue Million Forecast, by Price Trend Analysis 2019 & 2032
- Table 37: Global USA Microgreens Industry Revenue Million Forecast, by Country 2019 & 2032
- Table 38: United Kingdom USA Microgreens Industry Revenue (Million) Forecast, by Application 2019 & 2032
- Table 39: Germany USA Microgreens Industry Revenue (Million) Forecast, by Application 2019 & 2032
- Table 40: France USA Microgreens Industry Revenue (Million) Forecast, by Application 2019 & 2032
- Table 41: Italy USA Microgreens Industry Revenue (Million) Forecast, by Application 2019 & 2032
- Table 42: Spain USA Microgreens Industry Revenue (Million) Forecast, by Application 2019 & 2032
- Table 43: Russia USA Microgreens Industry Revenue (Million) Forecast, by Application 2019 & 2032
- Table 44: Benelux USA Microgreens Industry Revenue (Million) Forecast, by Application 2019 & 2032
- Table 45: Nordics USA Microgreens Industry Revenue (Million) Forecast, by Application 2019 & 2032
- Table 46: Rest of Europe USA Microgreens Industry Revenue (Million) Forecast, by Application 2019 & 2032
- Table 47: Global USA Microgreens Industry Revenue Million Forecast, by Production Analysis 2019 & 2032
- Table 48: Global USA Microgreens Industry Revenue Million Forecast, by Consumption Analysis 2019 & 2032
- Table 49: Global USA Microgreens Industry Revenue Million Forecast, by Import Market Analysis (Value & Volume) 2019 & 2032
- Table 50: Global USA Microgreens Industry Revenue Million Forecast, by Export Market Analysis (Value & Volume) 2019 & 2032
- Table 51: Global USA Microgreens Industry Revenue Million Forecast, by Price Trend Analysis 2019 & 2032
- Table 52: Global USA Microgreens Industry Revenue Million Forecast, by Country 2019 & 2032
- Table 53: Turkey USA Microgreens Industry Revenue (Million) Forecast, by Application 2019 & 2032
- Table 54: Israel USA Microgreens Industry Revenue (Million) Forecast, by Application 2019 & 2032
- Table 55: GCC USA Microgreens Industry Revenue (Million) Forecast, by Application 2019 & 2032
- Table 56: North Africa USA Microgreens Industry Revenue (Million) Forecast, by Application 2019 & 2032
- Table 57: South Africa USA Microgreens Industry Revenue (Million) Forecast, by Application 2019 & 2032
- Table 58: Rest of Middle East & Africa USA Microgreens Industry Revenue (Million) Forecast, by Application 2019 & 2032
- Table 59: Global USA Microgreens Industry Revenue Million Forecast, by Production Analysis 2019 & 2032
- Table 60: Global USA Microgreens Industry Revenue Million Forecast, by Consumption Analysis 2019 & 2032
- Table 61: Global USA Microgreens Industry Revenue Million Forecast, by Import Market Analysis (Value & Volume) 2019 & 2032
- Table 62: Global USA Microgreens Industry Revenue Million Forecast, by Export Market Analysis (Value & Volume) 2019 & 2032
- Table 63: Global USA Microgreens Industry Revenue Million Forecast, by Price Trend Analysis 2019 & 2032
- Table 64: Global USA Microgreens Industry Revenue Million Forecast, by Country 2019 & 2032
- Table 65: China USA Microgreens Industry Revenue (Million) Forecast, by Application 2019 & 2032
- Table 66: India USA Microgreens Industry Revenue (Million) Forecast, by Application 2019 & 2032
- Table 67: Japan USA Microgreens Industry Revenue (Million) Forecast, by Application 2019 & 2032
- Table 68: South Korea USA Microgreens Industry Revenue (Million) Forecast, by Application 2019 & 2032
- Table 69: ASEAN USA Microgreens Industry Revenue (Million) Forecast, by Application 2019 & 2032
- Table 70: Oceania USA Microgreens Industry Revenue (Million) Forecast, by Application 2019 & 2032
- Table 71: Rest of Asia Pacific USA Microgreens Industry Revenue (Million) Forecast, by Application 2019 & 2032
Frequently Asked Questions
1. What is the projected Compound Annual Growth Rate (CAGR) of the USA Microgreens Industry?
The projected CAGR is approximately 10.60%.
2. Which companies are prominent players in the USA Microgreens Industry?
Key companies in the market include The Chef's Garden Inc, Quantum Microgreens, Metro Microgreens, Long Island Microgreens LL, Emerald Gardens, Fresh Origins, Florida Microgreens, Farmbox Greens LLC, Arizona Microgreens LLC, AeroFarms LLC.
3. What are the main segments of the USA Microgreens Industry?
The market segments include Production Analysis, Consumption Analysis, Import Market Analysis (Value & Volume), Export Market Analysis (Value & Volume), Price Trend Analysis.
4. Can you provide details about the market size?
The market size is estimated to be USD 1.74 Million as of 2022.
5. What are some drivers contributing to market growth?
Need for Custom Product Development; Use of CROs for Regulatory Services.
6. What are the notable trends driving market growth?
Increased Investments in Vertical Farming Domain.
7. Are there any restraints impacting market growth?
Data and Cyber Security Concerns; Lack of Experts and Professionals in this Industry.
8. Can you provide examples of recent developments in the market?
September 2022: To meet increased customer demand, AeroFarmsDanville VA established the world's largest Aeroponic Smart Farm with the newest Indoor Vertical Farm capable of growing over 3 million lb of fresh leafy greens annually.
9. What pricing options are available for accessing the report?
Pricing options include single-user, multi-user, and enterprise licenses priced at USD 3800, USD 4500, and USD 5800 respectively.
10. Is the market size provided in terms of value or volume?
The market size is provided in terms of value, measured in Million.
11. Are there any specific market keywords associated with the report?
Yes, the market keyword associated with the report is "USA Microgreens Industry," which aids in identifying and referencing the specific market segment covered.
12. How do I determine which pricing option suits my needs best?
The pricing options vary based on user requirements and access needs. Individual users may opt for single-user licenses, while businesses requiring broader access may choose multi-user or enterprise licenses for cost-effective access to the report.
13. Are there any additional resources or data provided in the USA Microgreens Industry report?
While the report offers comprehensive insights, it's advisable to review the specific contents or supplementary materials provided to ascertain if additional resources or data are available.
14. How can I stay updated on further developments or reports in the USA Microgreens Industry?
To stay informed about further developments, trends, and reports in the USA Microgreens Industry, consider subscribing to industry newsletters, following relevant companies and organizations, or regularly checking reputable industry news sources and publications.
Methodology
Step 1 - Identification of Relevant Samples Size from Population Database


Step 2 - Approaches for Defining Global Market Size (Value, Volume* & Price*)

Note*: In applicable scenarios
Step 3 - Data Sources
Primary Research
- Web Analytics
- Survey Reports
- Research Institute
- Latest Research Reports
- Opinion Leaders
Secondary Research
- Annual Reports
- White Paper
- Latest Press Release
- Industry Association
- Paid Database
- Investor Presentations

Step 4 - Data Triangulation
Involves using different sources of information in order to increase the validity of a study
These sources are likely to be stakeholders in a program - participants, other researchers, program staff, other community members, and so on.
Then we put all data in single framework & apply various statistical tools to find out the dynamic on the market.
During the analysis stage, feedback from the stakeholder groups would be compared to determine areas of agreement as well as areas of divergence


