
Key Insights
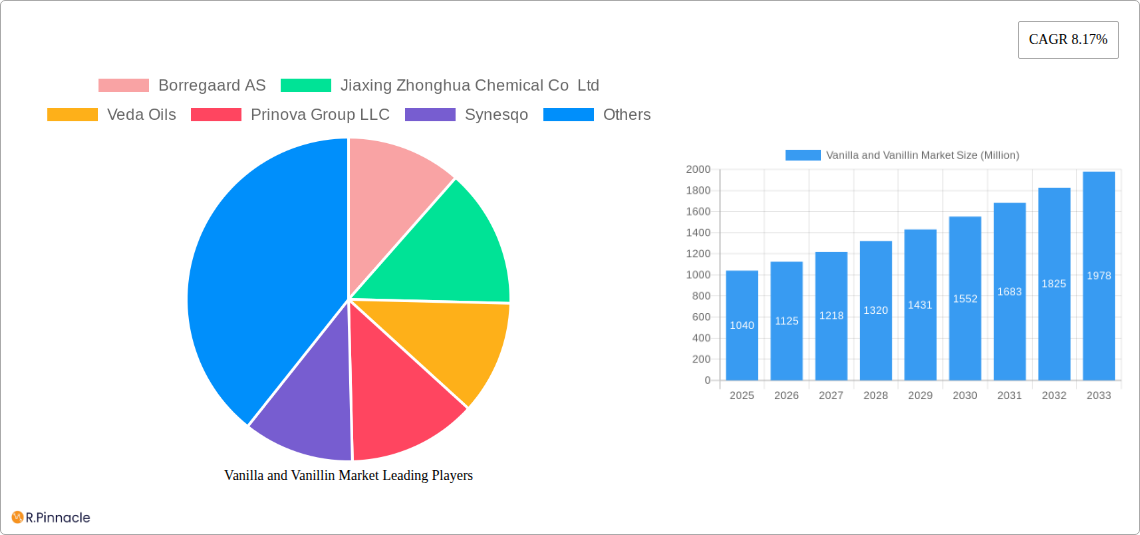
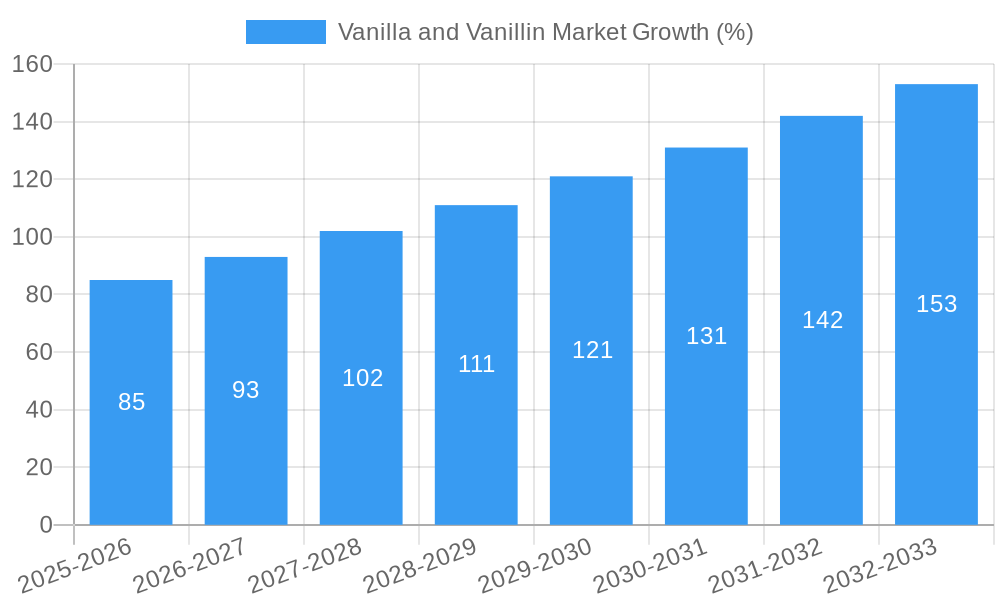
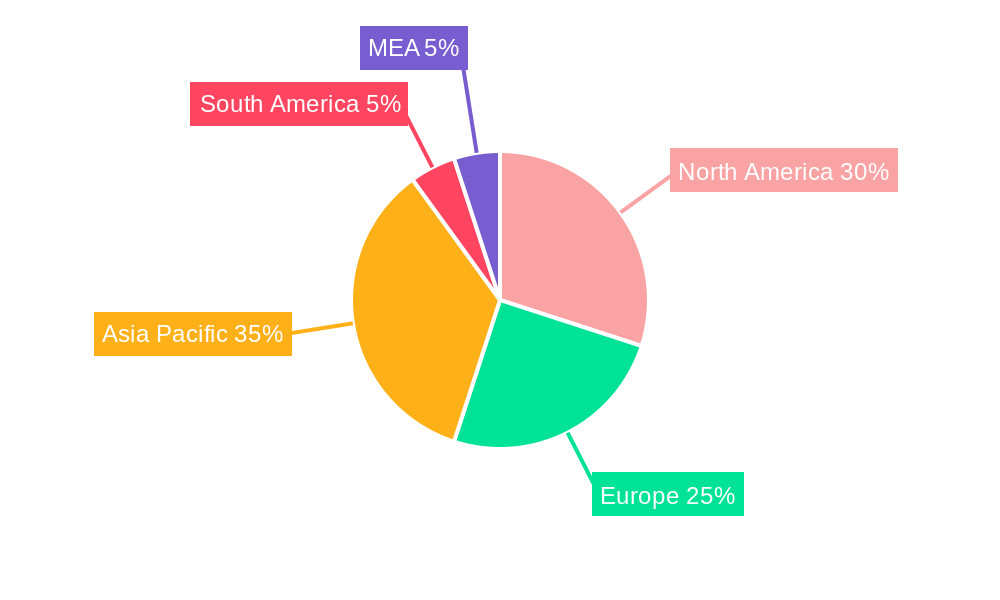
The global vanilla and vanillin market is experiencing robust growth, projected to reach a market size of $1.04 billion in 2025 and exhibiting a compound annual growth rate (CAGR) of 8.17% from 2025 to 2033. This expansion is driven by several key factors. The increasing demand for natural and artificial flavorings in the food and beverage industry, particularly in confectionery, bakery products, and beverages, significantly fuels market growth. Furthermore, the expanding pharmaceutical and fragrance industries, which utilize vanillin for its aroma and therapeutic properties, contribute to market expansion. Consumer preference for natural vanilla extract, coupled with the rising awareness of its health benefits, is further bolstering demand, particularly in developed regions like North America and Europe. However, price volatility of natural vanilla beans due to weather patterns and fluctuating supply, along with the availability of cheaper synthetic alternatives, presents challenges to market growth. The market is segmented by product type (natural vanillin and synthetic vanillin) and application (food and beverage, pharmaceuticals, fragrances, and other applications). Natural vanillin, while commanding a premium, is witnessing increased adoption due to its superior flavor profile and perceived health advantages. The Asia-Pacific region, driven by robust economic growth and a large and expanding consumer base, is expected to be a key market for both natural and synthetic vanillin.
The competitive landscape includes both large multinational corporations and smaller specialized manufacturers. Companies such as Borregaard AS, Jiaxing Zhonghua Chemical Co Ltd, and others are engaged in continuous innovation to improve production efficiency, explore new applications, and address consumer demand for sustainable and ethically sourced vanilla and vanillin. The forecast period (2025-2033) is expected to witness continued growth, primarily driven by the expansion of existing application areas and exploration of new avenues for vanillin utilization. However, sustainable and responsible sourcing practices will be crucial for the long-term health of this industry, balancing market growth with environmental considerations and ethical supply chains. Market players are likely to focus on product diversification, strategic partnerships, and research and development to maintain competitiveness and cater to the evolving consumer preferences in this dynamic market.
Vanilla and Vanillin Market: A Comprehensive Market Report (2019-2033)
This in-depth report provides a comprehensive analysis of the global Vanilla and Vanillin Market, offering invaluable insights for industry professionals, investors, and strategic decision-makers. Covering the period from 2019 to 2033, with a focus on 2025, this report meticulously examines market dynamics, segmentation, key players, and future growth potential. The report leverages extensive data analysis and expert insights to deliver actionable intelligence for navigating this dynamic market. The global market size is estimated to reach xx Million by 2025 and is projected to experience significant growth over the forecast period (2025-2033).
Vanilla and Vanillin Market Structure & Innovation Trends
This section delves into the competitive landscape of the vanilla and vanillin market, analyzing market concentration, innovation drivers, regulatory frameworks, and market dynamics. We examine the impact of mergers and acquisitions (M&A) activities, providing insights into deal values and their influence on market share.
Market Concentration: The market exhibits a moderately concentrated structure with a few major players holding significant market share. Borregaard AS, Jiaxing Zhonghua Chemical Co Ltd, and Merck KGaA are among the key players, together accounting for an estimated xx% of the global market share in 2025. However, numerous smaller players also contribute significantly to the overall market volume.
Innovation Drivers: The demand for natural and sustainable vanillin is a major driver of innovation. Companies are investing in research and development to enhance extraction methods and develop new, cost-effective processes for producing natural vanillin. This includes exploring bio-based alternatives and improving the efficiency of synthetic vanillin production.
Regulatory Frameworks: Government regulations concerning food additives and labeling requirements significantly impact the market. Stricter regulations in certain regions are driving the demand for high-quality, certified vanillin. The compliance cost can influence price fluctuations in various regions.
Product Substitutes: While vanilla and vanillin have few direct substitutes in many applications, the emergence of alternative flavoring agents is a factor to consider. The ongoing R&D efforts are exploring substitute products to vanillin which are more environmentally friendly with cost-effective methods.
End-User Demographics: The food and beverage industry remains the dominant end-user, followed by pharmaceuticals and fragrances. The changing consumer preferences toward natural and organic products significantly affect the demand for natural vanillin.
M&A Activities: Recent years have witnessed several notable M&A activities in the market, including the formation of Synesqo from Solvay's specialty business division. While precise deal values are often confidential, such activities indicate consolidation trends and the pursuit of greater market share and efficiency. The total value of M&A transactions during the historical period (2019-2024) is estimated to be xx Million.
Vanilla and Vanillin Market Dynamics & Trends
This section analyzes market growth drivers, technological disruptions, consumer preferences, and competitive dynamics. Specific metrics such as CAGR and market penetration are incorporated to provide a comprehensive understanding of market evolution. The global vanilla and vanillin market is projected to register a CAGR of xx% during the forecast period (2025-2033). The market penetration of natural vanillin is steadily increasing, driven by growing consumer demand for natural and organic products.
The rising demand for natural vanillin is largely due to increasing health consciousness and the preference for natural flavoring agents in the food and beverage industry. The growing adoption of natural vanillin in pharmaceuticals and cosmetics is also contributing to market expansion. The report also reveals the influence of price fluctuations in raw materials and the impact of the global economic climate on the market’s growth trajectory. Technological advancements in extraction and production methods, as well as the exploration of sustainable and environmentally friendly practices, are reshaping the competitive landscape. The increasing emphasis on traceability and transparency in the supply chain has led to a preference for ethically sourced vanillin, favoring sustainable and traceable production methods.
Dominant Regions & Segments in Vanilla and Vanillin Market
This section identifies the leading regions and segments within the vanilla and vanillin market, focusing on type (Natural Vanillin, Synthetic Vanillin) and application (Food and Beverage, Pharmaceuticals, Fragrances, Other Applications).
Type: The synthetic vanillin segment currently holds the largest market share due to its lower cost and greater availability. However, the natural vanillin segment is experiencing rapid growth, fueled by increasing consumer preference for natural ingredients.
Application: The food and beverage industry remains the dominant application segment, accounting for the largest share of global consumption. However, the pharmaceutical and fragrance industries are showing promising growth potential.
Key Drivers by Region: While specific regional dominance details require extensive data analysis, generally, North America and Europe are projected as leading regions owing to strong consumer demand, established infrastructure, and robust regulatory frameworks. Asia-Pacific is also expected to exhibit high growth, driven by increasing disposable incomes and expanding food and beverage industries.
Dominance Analysis: Detailed analysis shows that the specific dominance of regions and segments are influenced by factors such as economic growth, consumer preferences, regulatory policies, and technological advancements. Variations in production costs and distribution networks across different regions also influence the market dynamics.
Vanilla and Vanillin Market Product Innovations
Recent years have witnessed significant innovations in vanilla and vanillin production, with a growing focus on sustainability and cost-effectiveness. Companies are investing in research and development to improve the efficiency of extraction methods for natural vanillin and to develop new processes for producing synthetic vanillin with a reduced environmental footprint. These innovations aim to meet the increasing demand for natural and sustainable options while also addressing concerns regarding cost and availability. The market is witnessing a convergence of technology and nature, resulting in advanced methods for extracting natural flavors and optimizing synthetic production.
Report Scope & Segmentation Analysis
This report comprehensively segments the vanilla and vanillin market by type (Natural Vanillin and Synthetic Vanillin) and application (Food and Beverage, Pharmaceuticals, Fragrances, and Other Applications). Each segment's growth projections, market sizes, and competitive dynamics are analyzed in detail.
Natural Vanillin: This segment is experiencing rapid growth driven by increasing consumer preference for natural and organic products. Market size is estimated at xx Million in 2025 and is projected to reach xx Million by 2033.
Synthetic Vanillin: This segment holds the largest market share due to its lower cost and greater availability. The market size is projected to remain substantial, despite the increasing popularity of natural vanillin, due to cost considerations.
Food and Beverage: This remains the largest application segment, driven by the wide use of vanilla and vanillin in various food and beverage products. Growth is closely tied to the overall growth of the food and beverage industry.
Pharmaceuticals: This segment is experiencing steady growth as vanilla and vanillin find applications in pharmaceutical products. The demand for vanilla is increasing in the pharmaceutical segment due to its health benefits and the rising demand for natural products.
Fragrances: This segment represents a significant market for vanillin, with growth driven by the popularity of vanilla-scented products.
Other Applications: This segment encompasses various other applications, such as cosmetics and animal feed, and shows moderate growth potential.
Key Drivers of Vanilla and Vanillin Market Growth
Several factors contribute to the growth of the vanilla and vanillin market. Increasing consumer demand for natural and organic products is a significant driver, along with the growing popularity of vanilla-flavored food and beverages. Technological advancements in extraction and production methods are also boosting market growth, enhancing efficiency and reducing costs. Furthermore, the expanding applications of vanillin in pharmaceuticals, fragrances, and other industries contribute to market expansion. The overall growth of the global food and beverage industry provides a strong base for the continued expansion of the market.
Challenges in the Vanilla and Vanillin Market Sector
The vanilla and vanillin market faces several challenges. Price volatility of raw materials, particularly vanilla beans, can impact profitability. Competition from synthetic vanillin and other flavoring agents can be fierce. Supply chain issues and disruptions can also pose challenges, particularly for the supply of natural vanilla beans. Furthermore, stringent regulations concerning food additives can impose compliance costs, impacting overall business margins.
Emerging Opportunities in Vanilla and Vanillin Market
Despite the challenges, numerous opportunities exist within the vanilla and vanillin market. The rising demand for natural and sustainable products presents a significant opportunity for companies offering ethically sourced and sustainably produced vanillin. Further innovation in extraction and production methods is necessary to optimize costs and enhance the efficiency of natural vanilla extraction. Expanding into new markets and applications, such as specialized food products, cosmetics, and nutraceuticals, also presents significant growth potential.
Leading Players in the Vanilla and Vanillin Market Market
- Borregaard AS
- Jiaxing Zhonghua Chemical Co Ltd
- Veda Oils
- Prinova Group LLC
- Synesqo
- Merck KGaA
- FoodChem International Corporation
- Evolva Holding SA
- Camlin Fine Sciences Ltd
- Lesaffre Et Compagnie
Key Developments in Vanilla and Vanillin Market Industry
July 2023: Camlin Fine Sciences Ltd. (CFS) launched its premium vanillin product—adorr in North America, expanding its product portfolio and market reach.
June 2023: Solvay unveiled Synesqo, its new specialty company, potentially impacting the market dynamics through focused innovation and strategic partnerships.
June 2023: Merck expanded its production capacity for highly purified reagents in China, boosting its production capabilities for high-purity vanillin and related products.
Future Outlook for Vanilla and Vanillin Market Market
The future of the vanilla and vanillin market appears promising, driven by sustained demand for natural flavors and increasing innovation. The market is likely to witness increased consolidation, with larger players acquiring smaller companies to gain market share and efficiency. Further technological advancements, coupled with a growing focus on sustainability, will likely shape the market's evolution. The demand for natural vanillin will continue its upward trajectory, driven by health-conscious consumers, leading to more investment in sustainable and traceable production methods. The exploration of novel applications and markets will further contribute to market growth.
Vanilla and Vanillin Market Segmentation
-
1. Type
- 1.1. Natural Vanillin
- 1.2. Synthetic Vanillin
-
2. Application
- 2.1. Food and Beverage
- 2.2. Pharmaceuticals
- 2.3. Fragrances
- 2.4. Other Applications
Vanilla and Vanillin Market Segmentation By Geography
-
1. North America
- 1.1. United States
- 1.2. Canada
- 1.3. Mexico
- 1.4. Rest of North America
-
2. Europe
- 2.1. Germany
- 2.2. United Kingdom
- 2.3. France
- 2.4. Russia
- 2.5. Spain
- 2.6. Italy
- 2.7. Rest of Europe
-
3. Asia Pacific
- 3.1. China
- 3.2. India
- 3.3. Australia
- 3.4. Japan
- 3.5. Rest of Asia Pacific
- 4. Rest of the World
Vanilla and Vanillin Market REPORT HIGHLIGHTS
| Aspects | Details |
|---|---|
| Study Period | 2019-2033 |
| Base Year | 2024 |
| Estimated Year | 2025 |
| Forecast Period | 2025-2033 |
| Historical Period | 2019-2024 |
| Growth Rate | CAGR of 8.17% from 2019-2033 |
| Segmentation |
|
Table of Contents
- 1. Introduction
- 1.1. Research Scope
- 1.2. Market Segmentation
- 1.3. Research Methodology
- 1.4. Definitions and Assumptions
- 2. Executive Summary
- 2.1. Introduction
- 3. Market Dynamics
- 3.1. Introduction
- 3.2. Market Drivers
- 3.2.1. Innovation in Vanillin Synthesis; Diverse Functionality of Vanillin In End-use Industries
- 3.3. Market Restrains
- 3.3.1. Supply Chain Variability Impacting Vanilla Bean Availability For Flavor Production
- 3.4. Market Trends
- 3.4.1. Diverse Functionality of Vanillin in End-use Industries
- 4. Market Factor Analysis
- 4.1. Porters Five Forces
- 4.2. Supply/Value Chain
- 4.3. PESTEL analysis
- 4.4. Market Entropy
- 4.5. Patent/Trademark Analysis
- 5. Global Vanilla and Vanillin Market Analysis, Insights and Forecast, 2019-2031
- 5.1. Market Analysis, Insights and Forecast - by Type
- 5.1.1. Natural Vanillin
- 5.1.2. Synthetic Vanillin
- 5.2. Market Analysis, Insights and Forecast - by Application
- 5.2.1. Food and Beverage
- 5.2.2. Pharmaceuticals
- 5.2.3. Fragrances
- 5.2.4. Other Applications
- 5.3. Market Analysis, Insights and Forecast - by Region
- 5.3.1. North America
- 5.3.2. Europe
- 5.3.3. Asia Pacific
- 5.3.4. Rest of the World
- 5.1. Market Analysis, Insights and Forecast - by Type
- 6. North America Vanilla and Vanillin Market Analysis, Insights and Forecast, 2019-2031
- 6.1. Market Analysis, Insights and Forecast - by Type
- 6.1.1. Natural Vanillin
- 6.1.2. Synthetic Vanillin
- 6.2. Market Analysis, Insights and Forecast - by Application
- 6.2.1. Food and Beverage
- 6.2.2. Pharmaceuticals
- 6.2.3. Fragrances
- 6.2.4. Other Applications
- 6.1. Market Analysis, Insights and Forecast - by Type
- 7. Europe Vanilla and Vanillin Market Analysis, Insights and Forecast, 2019-2031
- 7.1. Market Analysis, Insights and Forecast - by Type
- 7.1.1. Natural Vanillin
- 7.1.2. Synthetic Vanillin
- 7.2. Market Analysis, Insights and Forecast - by Application
- 7.2.1. Food and Beverage
- 7.2.2. Pharmaceuticals
- 7.2.3. Fragrances
- 7.2.4. Other Applications
- 7.1. Market Analysis, Insights and Forecast - by Type
- 8. Asia Pacific Vanilla and Vanillin Market Analysis, Insights and Forecast, 2019-2031
- 8.1. Market Analysis, Insights and Forecast - by Type
- 8.1.1. Natural Vanillin
- 8.1.2. Synthetic Vanillin
- 8.2. Market Analysis, Insights and Forecast - by Application
- 8.2.1. Food and Beverage
- 8.2.2. Pharmaceuticals
- 8.2.3. Fragrances
- 8.2.4. Other Applications
- 8.1. Market Analysis, Insights and Forecast - by Type
- 9. Rest of the World Vanilla and Vanillin Market Analysis, Insights and Forecast, 2019-2031
- 9.1. Market Analysis, Insights and Forecast - by Type
- 9.1.1. Natural Vanillin
- 9.1.2. Synthetic Vanillin
- 9.2. Market Analysis, Insights and Forecast - by Application
- 9.2.1. Food and Beverage
- 9.2.2. Pharmaceuticals
- 9.2.3. Fragrances
- 9.2.4. Other Applications
- 9.1. Market Analysis, Insights and Forecast - by Type
- 10. North America Vanilla and Vanillin Market Analysis, Insights and Forecast, 2019-2031
- 10.1. Market Analysis, Insights and Forecast - By Country/Sub-region
- 10.1.1 United States
- 10.1.2 Canada
- 10.1.3 Mexico
- 11. Europe Vanilla and Vanillin Market Analysis, Insights and Forecast, 2019-2031
- 11.1. Market Analysis, Insights and Forecast - By Country/Sub-region
- 11.1.1 Germany
- 11.1.2 United Kingdom
- 11.1.3 France
- 11.1.4 Spain
- 11.1.5 Italy
- 11.1.6 Spain
- 11.1.7 Belgium
- 11.1.8 Netherland
- 11.1.9 Nordics
- 11.1.10 Rest of Europe
- 12. Asia Pacific Vanilla and Vanillin Market Analysis, Insights and Forecast, 2019-2031
- 12.1. Market Analysis, Insights and Forecast - By Country/Sub-region
- 12.1.1 China
- 12.1.2 Japan
- 12.1.3 India
- 12.1.4 South Korea
- 12.1.5 Southeast Asia
- 12.1.6 Australia
- 12.1.7 Indonesia
- 12.1.8 Phillipes
- 12.1.9 Singapore
- 12.1.10 Thailandc
- 12.1.11 Rest of Asia Pacific
- 13. South America Vanilla and Vanillin Market Analysis, Insights and Forecast, 2019-2031
- 13.1. Market Analysis, Insights and Forecast - By Country/Sub-region
- 13.1.1 Brazil
- 13.1.2 Argentina
- 13.1.3 Peru
- 13.1.4 Chile
- 13.1.5 Colombia
- 13.1.6 Ecuador
- 13.1.7 Venezuela
- 13.1.8 Rest of South America
- 14. MEA Vanilla and Vanillin Market Analysis, Insights and Forecast, 2019-2031
- 14.1. Market Analysis, Insights and Forecast - By Country/Sub-region
- 14.1.1 United Arab Emirates
- 14.1.2 Saudi Arabia
- 14.1.3 South Africa
- 14.1.4 Rest of Middle East and Africa
- 15. Competitive Analysis
- 15.1. Global Market Share Analysis 2024
- 15.2. Company Profiles
- 15.2.1 Borregaard AS
- 15.2.1.1. Overview
- 15.2.1.2. Products
- 15.2.1.3. SWOT Analysis
- 15.2.1.4. Recent Developments
- 15.2.1.5. Financials (Based on Availability)
- 15.2.2 Jiaxing Zhonghua Chemical Co Ltd
- 15.2.2.1. Overview
- 15.2.2.2. Products
- 15.2.2.3. SWOT Analysis
- 15.2.2.4. Recent Developments
- 15.2.2.5. Financials (Based on Availability)
- 15.2.3 Veda Oils
- 15.2.3.1. Overview
- 15.2.3.2. Products
- 15.2.3.3. SWOT Analysis
- 15.2.3.4. Recent Developments
- 15.2.3.5. Financials (Based on Availability)
- 15.2.4 Prinova Group LLC
- 15.2.4.1. Overview
- 15.2.4.2. Products
- 15.2.4.3. SWOT Analysis
- 15.2.4.4. Recent Developments
- 15.2.4.5. Financials (Based on Availability)
- 15.2.5 Synesqo
- 15.2.5.1. Overview
- 15.2.5.2. Products
- 15.2.5.3. SWOT Analysis
- 15.2.5.4. Recent Developments
- 15.2.5.5. Financials (Based on Availability)
- 15.2.6 Merck KGaA
- 15.2.6.1. Overview
- 15.2.6.2. Products
- 15.2.6.3. SWOT Analysis
- 15.2.6.4. Recent Developments
- 15.2.6.5. Financials (Based on Availability)
- 15.2.7 FoodChem International Corporation
- 15.2.7.1. Overview
- 15.2.7.2. Products
- 15.2.7.3. SWOT Analysis
- 15.2.7.4. Recent Developments
- 15.2.7.5. Financials (Based on Availability)
- 15.2.8 Evolva Holding SA
- 15.2.8.1. Overview
- 15.2.8.2. Products
- 15.2.8.3. SWOT Analysis
- 15.2.8.4. Recent Developments
- 15.2.8.5. Financials (Based on Availability)
- 15.2.9 Camlin Fine Sciences Ltd
- 15.2.9.1. Overview
- 15.2.9.2. Products
- 15.2.9.3. SWOT Analysis
- 15.2.9.4. Recent Developments
- 15.2.9.5. Financials (Based on Availability)
- 15.2.10 Lesaffre Et Compagnie
- 15.2.10.1. Overview
- 15.2.10.2. Products
- 15.2.10.3. SWOT Analysis
- 15.2.10.4. Recent Developments
- 15.2.10.5. Financials (Based on Availability)
- 15.2.1 Borregaard AS
List of Figures
- Figure 1: Global Vanilla and Vanillin Market Revenue Breakdown (Million, %) by Region 2024 & 2032
- Figure 2: North America Vanilla and Vanillin Market Revenue (Million), by Country 2024 & 2032
- Figure 3: North America Vanilla and Vanillin Market Revenue Share (%), by Country 2024 & 2032
- Figure 4: Europe Vanilla and Vanillin Market Revenue (Million), by Country 2024 & 2032
- Figure 5: Europe Vanilla and Vanillin Market Revenue Share (%), by Country 2024 & 2032
- Figure 6: Asia Pacific Vanilla and Vanillin Market Revenue (Million), by Country 2024 & 2032
- Figure 7: Asia Pacific Vanilla and Vanillin Market Revenue Share (%), by Country 2024 & 2032
- Figure 8: South America Vanilla and Vanillin Market Revenue (Million), by Country 2024 & 2032
- Figure 9: South America Vanilla and Vanillin Market Revenue Share (%), by Country 2024 & 2032
- Figure 10: MEA Vanilla and Vanillin Market Revenue (Million), by Country 2024 & 2032
- Figure 11: MEA Vanilla and Vanillin Market Revenue Share (%), by Country 2024 & 2032
- Figure 12: North America Vanilla and Vanillin Market Revenue (Million), by Type 2024 & 2032
- Figure 13: North America Vanilla and Vanillin Market Revenue Share (%), by Type 2024 & 2032
- Figure 14: North America Vanilla and Vanillin Market Revenue (Million), by Application 2024 & 2032
- Figure 15: North America Vanilla and Vanillin Market Revenue Share (%), by Application 2024 & 2032
- Figure 16: North America Vanilla and Vanillin Market Revenue (Million), by Country 2024 & 2032
- Figure 17: North America Vanilla and Vanillin Market Revenue Share (%), by Country 2024 & 2032
- Figure 18: Europe Vanilla and Vanillin Market Revenue (Million), by Type 2024 & 2032
- Figure 19: Europe Vanilla and Vanillin Market Revenue Share (%), by Type 2024 & 2032
- Figure 20: Europe Vanilla and Vanillin Market Revenue (Million), by Application 2024 & 2032
- Figure 21: Europe Vanilla and Vanillin Market Revenue Share (%), by Application 2024 & 2032
- Figure 22: Europe Vanilla and Vanillin Market Revenue (Million), by Country 2024 & 2032
- Figure 23: Europe Vanilla and Vanillin Market Revenue Share (%), by Country 2024 & 2032
- Figure 24: Asia Pacific Vanilla and Vanillin Market Revenue (Million), by Type 2024 & 2032
- Figure 25: Asia Pacific Vanilla and Vanillin Market Revenue Share (%), by Type 2024 & 2032
- Figure 26: Asia Pacific Vanilla and Vanillin Market Revenue (Million), by Application 2024 & 2032
- Figure 27: Asia Pacific Vanilla and Vanillin Market Revenue Share (%), by Application 2024 & 2032
- Figure 28: Asia Pacific Vanilla and Vanillin Market Revenue (Million), by Country 2024 & 2032
- Figure 29: Asia Pacific Vanilla and Vanillin Market Revenue Share (%), by Country 2024 & 2032
- Figure 30: Rest of the World Vanilla and Vanillin Market Revenue (Million), by Type 2024 & 2032
- Figure 31: Rest of the World Vanilla and Vanillin Market Revenue Share (%), by Type 2024 & 2032
- Figure 32: Rest of the World Vanilla and Vanillin Market Revenue (Million), by Application 2024 & 2032
- Figure 33: Rest of the World Vanilla and Vanillin Market Revenue Share (%), by Application 2024 & 2032
- Figure 34: Rest of the World Vanilla and Vanillin Market Revenue (Million), by Country 2024 & 2032
- Figure 35: Rest of the World Vanilla and Vanillin Market Revenue Share (%), by Country 2024 & 2032
List of Tables
- Table 1: Global Vanilla and Vanillin Market Revenue Million Forecast, by Region 2019 & 2032
- Table 2: Global Vanilla and Vanillin Market Revenue Million Forecast, by Type 2019 & 2032
- Table 3: Global Vanilla and Vanillin Market Revenue Million Forecast, by Application 2019 & 2032
- Table 4: Global Vanilla and Vanillin Market Revenue Million Forecast, by Region 2019 & 2032
- Table 5: Global Vanilla and Vanillin Market Revenue Million Forecast, by Country 2019 & 2032
- Table 6: United States Vanilla and Vanillin Market Revenue (Million) Forecast, by Application 2019 & 2032
- Table 7: Canada Vanilla and Vanillin Market Revenue (Million) Forecast, by Application 2019 & 2032
- Table 8: Mexico Vanilla and Vanillin Market Revenue (Million) Forecast, by Application 2019 & 2032
- Table 9: Global Vanilla and Vanillin Market Revenue Million Forecast, by Country 2019 & 2032
- Table 10: Germany Vanilla and Vanillin Market Revenue (Million) Forecast, by Application 2019 & 2032
- Table 11: United Kingdom Vanilla and Vanillin Market Revenue (Million) Forecast, by Application 2019 & 2032
- Table 12: France Vanilla and Vanillin Market Revenue (Million) Forecast, by Application 2019 & 2032
- Table 13: Spain Vanilla and Vanillin Market Revenue (Million) Forecast, by Application 2019 & 2032
- Table 14: Italy Vanilla and Vanillin Market Revenue (Million) Forecast, by Application 2019 & 2032
- Table 15: Spain Vanilla and Vanillin Market Revenue (Million) Forecast, by Application 2019 & 2032
- Table 16: Belgium Vanilla and Vanillin Market Revenue (Million) Forecast, by Application 2019 & 2032
- Table 17: Netherland Vanilla and Vanillin Market Revenue (Million) Forecast, by Application 2019 & 2032
- Table 18: Nordics Vanilla and Vanillin Market Revenue (Million) Forecast, by Application 2019 & 2032
- Table 19: Rest of Europe Vanilla and Vanillin Market Revenue (Million) Forecast, by Application 2019 & 2032
- Table 20: Global Vanilla and Vanillin Market Revenue Million Forecast, by Country 2019 & 2032
- Table 21: China Vanilla and Vanillin Market Revenue (Million) Forecast, by Application 2019 & 2032
- Table 22: Japan Vanilla and Vanillin Market Revenue (Million) Forecast, by Application 2019 & 2032
- Table 23: India Vanilla and Vanillin Market Revenue (Million) Forecast, by Application 2019 & 2032
- Table 24: South Korea Vanilla and Vanillin Market Revenue (Million) Forecast, by Application 2019 & 2032
- Table 25: Southeast Asia Vanilla and Vanillin Market Revenue (Million) Forecast, by Application 2019 & 2032
- Table 26: Australia Vanilla and Vanillin Market Revenue (Million) Forecast, by Application 2019 & 2032
- Table 27: Indonesia Vanilla and Vanillin Market Revenue (Million) Forecast, by Application 2019 & 2032
- Table 28: Phillipes Vanilla and Vanillin Market Revenue (Million) Forecast, by Application 2019 & 2032
- Table 29: Singapore Vanilla and Vanillin Market Revenue (Million) Forecast, by Application 2019 & 2032
- Table 30: Thailandc Vanilla and Vanillin Market Revenue (Million) Forecast, by Application 2019 & 2032
- Table 31: Rest of Asia Pacific Vanilla and Vanillin Market Revenue (Million) Forecast, by Application 2019 & 2032
- Table 32: Global Vanilla and Vanillin Market Revenue Million Forecast, by Country 2019 & 2032
- Table 33: Brazil Vanilla and Vanillin Market Revenue (Million) Forecast, by Application 2019 & 2032
- Table 34: Argentina Vanilla and Vanillin Market Revenue (Million) Forecast, by Application 2019 & 2032
- Table 35: Peru Vanilla and Vanillin Market Revenue (Million) Forecast, by Application 2019 & 2032
- Table 36: Chile Vanilla and Vanillin Market Revenue (Million) Forecast, by Application 2019 & 2032
- Table 37: Colombia Vanilla and Vanillin Market Revenue (Million) Forecast, by Application 2019 & 2032
- Table 38: Ecuador Vanilla and Vanillin Market Revenue (Million) Forecast, by Application 2019 & 2032
- Table 39: Venezuela Vanilla and Vanillin Market Revenue (Million) Forecast, by Application 2019 & 2032
- Table 40: Rest of South America Vanilla and Vanillin Market Revenue (Million) Forecast, by Application 2019 & 2032
- Table 41: Global Vanilla and Vanillin Market Revenue Million Forecast, by Country 2019 & 2032
- Table 42: United Arab Emirates Vanilla and Vanillin Market Revenue (Million) Forecast, by Application 2019 & 2032
- Table 43: Saudi Arabia Vanilla and Vanillin Market Revenue (Million) Forecast, by Application 2019 & 2032
- Table 44: South Africa Vanilla and Vanillin Market Revenue (Million) Forecast, by Application 2019 & 2032
- Table 45: Rest of Middle East and Africa Vanilla and Vanillin Market Revenue (Million) Forecast, by Application 2019 & 2032
- Table 46: Global Vanilla and Vanillin Market Revenue Million Forecast, by Type 2019 & 2032
- Table 47: Global Vanilla and Vanillin Market Revenue Million Forecast, by Application 2019 & 2032
- Table 48: Global Vanilla and Vanillin Market Revenue Million Forecast, by Country 2019 & 2032
- Table 49: United States Vanilla and Vanillin Market Revenue (Million) Forecast, by Application 2019 & 2032
- Table 50: Canada Vanilla and Vanillin Market Revenue (Million) Forecast, by Application 2019 & 2032
- Table 51: Mexico Vanilla and Vanillin Market Revenue (Million) Forecast, by Application 2019 & 2032
- Table 52: Rest of North America Vanilla and Vanillin Market Revenue (Million) Forecast, by Application 2019 & 2032
- Table 53: Global Vanilla and Vanillin Market Revenue Million Forecast, by Type 2019 & 2032
- Table 54: Global Vanilla and Vanillin Market Revenue Million Forecast, by Application 2019 & 2032
- Table 55: Global Vanilla and Vanillin Market Revenue Million Forecast, by Country 2019 & 2032
- Table 56: Germany Vanilla and Vanillin Market Revenue (Million) Forecast, by Application 2019 & 2032
- Table 57: United Kingdom Vanilla and Vanillin Market Revenue (Million) Forecast, by Application 2019 & 2032
- Table 58: France Vanilla and Vanillin Market Revenue (Million) Forecast, by Application 2019 & 2032
- Table 59: Russia Vanilla and Vanillin Market Revenue (Million) Forecast, by Application 2019 & 2032
- Table 60: Spain Vanilla and Vanillin Market Revenue (Million) Forecast, by Application 2019 & 2032
- Table 61: Italy Vanilla and Vanillin Market Revenue (Million) Forecast, by Application 2019 & 2032
- Table 62: Rest of Europe Vanilla and Vanillin Market Revenue (Million) Forecast, by Application 2019 & 2032
- Table 63: Global Vanilla and Vanillin Market Revenue Million Forecast, by Type 2019 & 2032
- Table 64: Global Vanilla and Vanillin Market Revenue Million Forecast, by Application 2019 & 2032
- Table 65: Global Vanilla and Vanillin Market Revenue Million Forecast, by Country 2019 & 2032
- Table 66: China Vanilla and Vanillin Market Revenue (Million) Forecast, by Application 2019 & 2032
- Table 67: India Vanilla and Vanillin Market Revenue (Million) Forecast, by Application 2019 & 2032
- Table 68: Australia Vanilla and Vanillin Market Revenue (Million) Forecast, by Application 2019 & 2032
- Table 69: Japan Vanilla and Vanillin Market Revenue (Million) Forecast, by Application 2019 & 2032
- Table 70: Rest of Asia Pacific Vanilla and Vanillin Market Revenue (Million) Forecast, by Application 2019 & 2032
- Table 71: Global Vanilla and Vanillin Market Revenue Million Forecast, by Type 2019 & 2032
- Table 72: Global Vanilla and Vanillin Market Revenue Million Forecast, by Application 2019 & 2032
- Table 73: Global Vanilla and Vanillin Market Revenue Million Forecast, by Country 2019 & 2032
Frequently Asked Questions
1. What is the projected Compound Annual Growth Rate (CAGR) of the Vanilla and Vanillin Market?
The projected CAGR is approximately 8.17%.
2. Which companies are prominent players in the Vanilla and Vanillin Market?
Key companies in the market include Borregaard AS, Jiaxing Zhonghua Chemical Co Ltd, Veda Oils, Prinova Group LLC, Synesqo, Merck KGaA, FoodChem International Corporation, Evolva Holding SA, Camlin Fine Sciences Ltd, Lesaffre Et Compagnie.
3. What are the main segments of the Vanilla and Vanillin Market?
The market segments include Type, Application.
4. Can you provide details about the market size?
The market size is estimated to be USD 1.04 Million as of 2022.
5. What are some drivers contributing to market growth?
Innovation in Vanillin Synthesis; Diverse Functionality of Vanillin In End-use Industries.
6. What are the notable trends driving market growth?
Diverse Functionality of Vanillin in End-use Industries.
7. Are there any restraints impacting market growth?
Supply Chain Variability Impacting Vanilla Bean Availability For Flavor Production.
8. Can you provide examples of recent developments in the market?
July 2023: Camlin Fine Sciences Ltd. (CFS) launched its vanillin premium product—adorr in North America.
9. What pricing options are available for accessing the report?
Pricing options include single-user, multi-user, and enterprise licenses priced at USD 4750, USD 5250, and USD 8750 respectively.
10. Is the market size provided in terms of value or volume?
The market size is provided in terms of value, measured in Million.
11. Are there any specific market keywords associated with the report?
Yes, the market keyword associated with the report is "Vanilla and Vanillin Market," which aids in identifying and referencing the specific market segment covered.
12. How do I determine which pricing option suits my needs best?
The pricing options vary based on user requirements and access needs. Individual users may opt for single-user licenses, while businesses requiring broader access may choose multi-user or enterprise licenses for cost-effective access to the report.
13. Are there any additional resources or data provided in the Vanilla and Vanillin Market report?
While the report offers comprehensive insights, it's advisable to review the specific contents or supplementary materials provided to ascertain if additional resources or data are available.
14. How can I stay updated on further developments or reports in the Vanilla and Vanillin Market?
To stay informed about further developments, trends, and reports in the Vanilla and Vanillin Market, consider subscribing to industry newsletters, following relevant companies and organizations, or regularly checking reputable industry news sources and publications.
Methodology
Step 1 - Identification of Relevant Samples Size from Population Database


Step 2 - Approaches for Defining Global Market Size (Value, Volume* & Price*)

Note*: In applicable scenarios
Step 3 - Data Sources
Primary Research
- Web Analytics
- Survey Reports
- Research Institute
- Latest Research Reports
- Opinion Leaders
Secondary Research
- Annual Reports
- White Paper
- Latest Press Release
- Industry Association
- Paid Database
- Investor Presentations

Step 4 - Data Triangulation
Involves using different sources of information in order to increase the validity of a study
These sources are likely to be stakeholders in a program - participants, other researchers, program staff, other community members, and so on.
Then we put all data in single framework & apply various statistical tools to find out the dynamic on the market.
During the analysis stage, feedback from the stakeholder groups would be compared to determine areas of agreement as well as areas of divergence


