
Key Insights
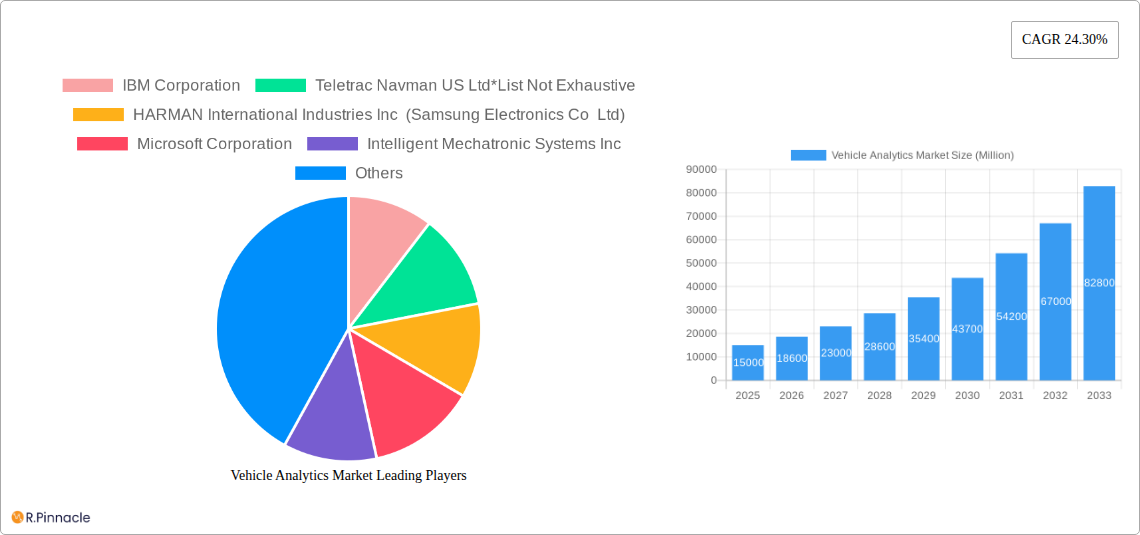
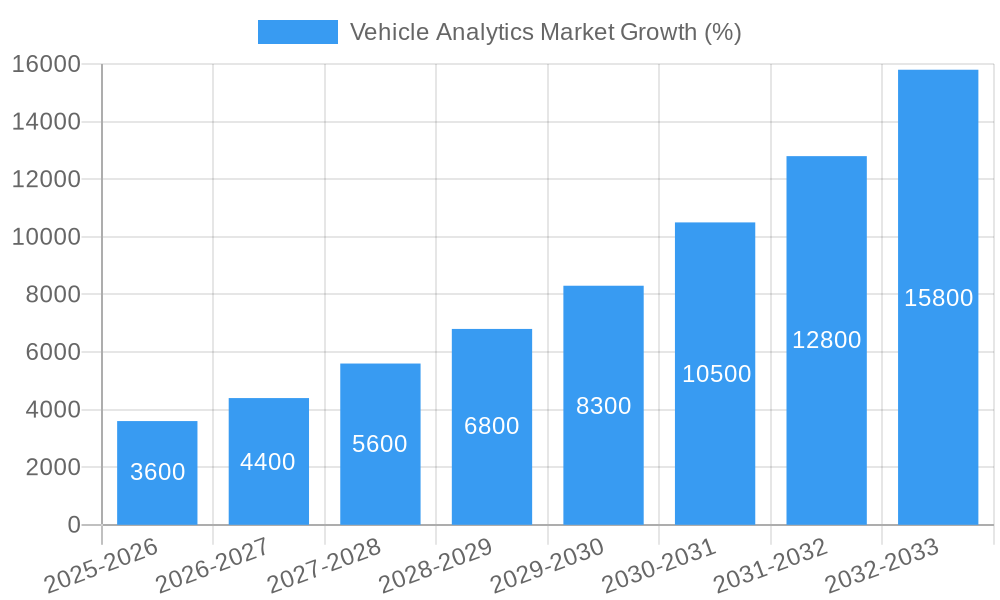
The Vehicle Analytics market is experiencing robust growth, projected to reach a significant value by 2033, driven by a compound annual growth rate (CAGR) of 24.30%. This expansion is fueled by several key factors. The increasing adoption of connected vehicles and the proliferation of Internet of Things (IoT) devices within the automotive sector are generating massive amounts of data. Analyzing this data offers significant advantages, including improved fleet management efficiency (reduced fuel consumption, optimized routing), enhanced vehicle safety (predictive maintenance minimizing breakdowns and accidents), and better driver performance (leading to fuel savings and reduced insurance premiums). Furthermore, stringent government regulations related to vehicle safety and emissions are pushing adoption of these analytic solutions. The market is segmented by deployment (on-premise and cloud), application (predictive maintenance, safety and security, driver performance analysis, and others), and end-user industry (fleet owners, insurers, OEMs, and service providers). Cloud-based solutions are gaining traction due to their scalability and cost-effectiveness. Predictive maintenance, in particular, represents a lucrative application segment due to its ability to significantly reduce operational costs and downtime.
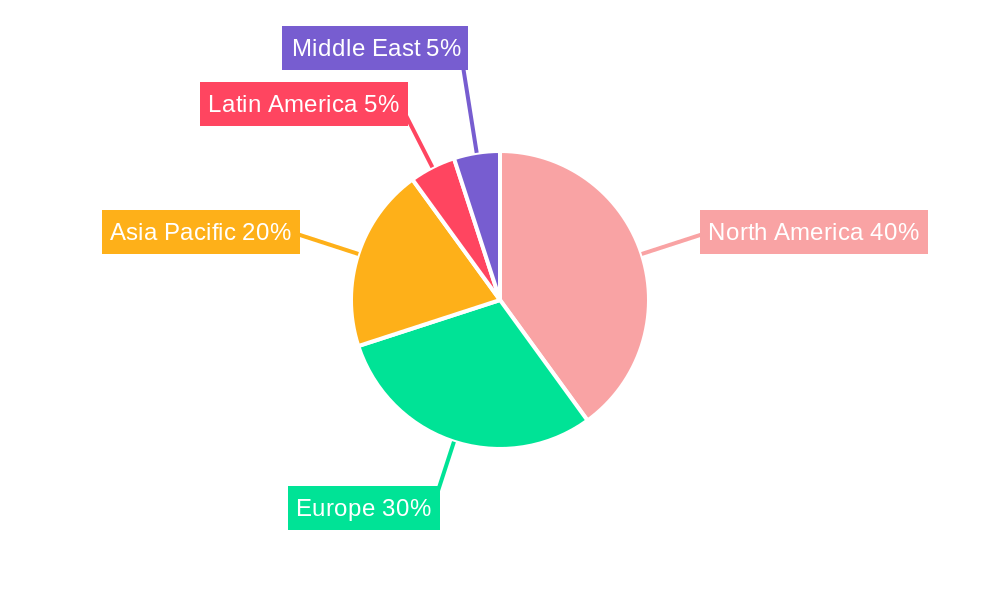
The competitive landscape is marked by the presence of established technology giants like IBM, Microsoft, and SAP, alongside specialized players such as Teletrac Navman and HARMAN. These companies are constantly innovating and expanding their product offerings to cater to the evolving needs of different customer segments. The North American market currently holds a substantial share, but the Asia-Pacific region is expected to witness the fastest growth in the coming years due to the rising adoption of advanced technologies and increasing vehicle ownership in developing economies. While data security and privacy concerns pose a potential restraint, the overall market outlook remains positive, driven by continuous technological advancements and the increasing demand for data-driven decision-making within the automotive industry. The ongoing integration of AI and machine learning algorithms further enhances the capabilities of vehicle analytics platforms, resulting in more sophisticated and insightful data analysis.
Vehicle Analytics Market: A Comprehensive Report (2019-2033)
This comprehensive report provides a detailed analysis of the Vehicle Analytics Market, offering invaluable insights for industry professionals, investors, and strategic decision-makers. With a focus on market structure, dynamics, key players, and future trends, this report covers the period from 2019 to 2033, with a base year of 2025 and a forecast period of 2025-2033. The study period includes the historical period of 2019-2024 and the estimated year of 2025. The report value is in Millions.
Vehicle Analytics Market Structure & Innovation Trends
This section analyzes the competitive landscape of the Vehicle Analytics Market, examining market concentration, innovation drivers, regulatory frameworks, product substitutes, end-user demographics, and mergers & acquisitions (M&A) activities. The market is characterized by a mix of established players and emerging startups, leading to a dynamic competitive environment.
- Market Concentration: The market exhibits a moderately concentrated structure, with a few dominant players holding significant market share (xx%). However, the presence of numerous smaller companies fosters innovation and competition.
- Innovation Drivers: Advancements in connected car technology, the increasing adoption of IoT (Internet of Things) devices, and the growing need for data-driven decision-making are key innovation drivers.
- Regulatory Frameworks: Government regulations concerning data privacy and cybersecurity are shaping the market landscape, influencing data collection and analysis practices.
- Product Substitutes: The market faces limited direct substitutes, but alternative approaches to data analysis and fleet management may emerge as technology evolves.
- End-User Demographics: The key end-user industries are fleet owners, insurers, OEMs, and service providers. Their specific needs and preferences influence the demand for different types of vehicle analytics solutions.
- M&A Activities: The Vehicle Analytics Market has witnessed significant M&A activity in recent years, with deal values exceeding xx Million. These activities reflect the strategic importance of vehicle analytics and the consolidation trend within the industry. For example, the acquisition of [Company A] by [Company B] in [Year] significantly impacted market share dynamics.
Vehicle Analytics Market Dynamics & Trends
This section explores the key factors driving market growth, including technological advancements, changing consumer preferences, and competitive dynamics. The market is expected to exhibit a Compound Annual Growth Rate (CAGR) of xx% during the forecast period (2025-2033), driven by the increasing adoption of connected vehicles and the growing demand for enhanced safety and efficiency. Market penetration is expected to reach xx% by 2033.
(Detailed paragraph explaining market growth drivers, technological disruptions, consumer preferences, and competitive dynamics with specific examples and data points would be included here – approximately 600 words).
Dominant Regions & Segments in Vehicle Analytics Market
This section identifies the leading regions, countries, and market segments within the Vehicle Analytics Market.
By Deployment:
- Cloud: The cloud-based segment is the dominant deployment model, driven by its scalability, cost-effectiveness, and ease of access.
- On-premise: While less dominant than cloud, the on-premise segment maintains a significant market share, particularly amongst organizations with stringent data security requirements.
By Application:
- Predictive Maintenance: This application is a major growth driver, as it reduces downtime and operational costs.
- Safety and Security Management: The increasing focus on road safety is fueling the demand for vehicle analytics solutions in this segment.
- Driver Performance Analysis: This application is gaining traction as businesses seek to improve driver behavior and reduce accidents.
By End-user Industry:
- Fleet Owners: This segment is the largest end-user industry, driving significant demand for vehicle analytics solutions.
- OEMs and Service Providers: OEMs are increasingly integrating vehicle analytics capabilities into their products and services, driving market growth.
(Detailed paragraphs with analysis of each segment’s dominance, including key drivers (economic policies, infrastructure) would be included here – approximately 600 words).
Vehicle Analytics Market Product Innovations
Recent product developments in the vehicle analytics market focus on integrating advanced AI and machine learning algorithms to enhance data analysis and predictive capabilities. The integration of real-time data streams from connected vehicles provides valuable insights into driving patterns, vehicle health, and fuel efficiency. These advancements offer significant competitive advantages, enabling more effective fleet management, proactive maintenance, and improved driver safety.
Report Scope & Segmentation Analysis
This report provides a comprehensive analysis of the Vehicle Analytics Market, segmented by deployment (on-premise and cloud), application (predictive maintenance, safety and security management, driver performance analysis, and other applications), and end-user industry (fleet owners, insurers, OEMs and service providers, and other end-user industries). Each segment is thoroughly analyzed, including growth projections, market sizes, and competitive dynamics. (Detailed paragraphs for each segment, similar to the previous section, would be included here - approximately 150 words)
Key Drivers of Vehicle Analytics Market Growth
The Vehicle Analytics Market is fueled by several key growth drivers. Advancements in sensor technology and telematics are enabling the collection of vast amounts of vehicle data. The growing adoption of connected vehicles and the increasing penetration of IoT devices are generating substantial data volumes that can be analyzed for valuable insights. Furthermore, stringent government regulations promoting road safety and fuel efficiency are stimulating the adoption of vehicle analytics solutions.
Challenges in the Vehicle Analytics Market Sector
The Vehicle Analytics Market faces several challenges. Data security and privacy concerns are paramount. The need to comply with stringent data protection regulations presents significant operational challenges and potential compliance costs. Furthermore, the high upfront investment required for implementing vehicle analytics solutions can be a barrier to adoption, particularly for small and medium-sized businesses. The high cost and complexity associated with integrating different data sources also impede the growth of this market.
Emerging Opportunities in Vehicle Analytics Market
Emerging opportunities exist within the Vehicle Analytics Market, primarily driven by the expanding adoption of autonomous vehicles. The integration of vehicle analytics with autonomous driving technologies will enable the optimization of vehicle operations, improving safety and efficiency. The development of advanced analytics capabilities, utilizing AI and machine learning, will further enhance the value proposition of vehicle analytics solutions. Furthermore, the increasing adoption of predictive maintenance will contribute to significant cost savings for fleet owners.
Leading Players in the Vehicle Analytics Market Market
- IBM Corporation (IBM)
- Teletrac Navman US Ltd
- HARMAN International Industries Inc (Samsung Electronics Co Ltd) (HARMAN)
- Microsoft Corporation (Microsoft)
- Intelligent Mechatronic Systems Inc
- Genetec Inc
- Inquiron Ltd
- CloudMade
- SAP SE (SAP)
Key Developments in Vehicle Analytics Market Industry
- October 2022: BMW partnered with Amazon Web Services (AWS) to develop software for collecting and analyzing data from connected vehicles, expediting feature development and software life cycle management.
- May 2022: Red Hat, Inc. and General Motors partnered to accelerate software-defined car development, building an innovation ecosystem around Red Hat's In-Vehicle Operating System for GM's Ultifi platform.
Future Outlook for Vehicle Analytics Market Market
The Vehicle Analytics Market is poised for significant growth in the coming years. The increasing connectivity of vehicles, the growing adoption of AI and machine learning, and the rising demand for improved safety and efficiency will drive market expansion. Strategic partnerships and investments in innovative technologies will further shape the market landscape, creating lucrative opportunities for businesses operating in this dynamic sector.
Vehicle Analytics Market Segmentation
-
1. Deployment
- 1.1. On-premise
- 1.2. Cloud
-
2. Application
- 2.1. Predictive Maintenence
- 2.2. Safety and Security Management
- 2.3. Driver Performance Analysis
- 2.4. Other Applications
-
3. End-user Industry
- 3.1. Fleet Owners
- 3.2. Insurers
- 3.3. OEMs and Service Providers
- 3.4. Other End-user Industries
Vehicle Analytics Market Segmentation By Geography
- 1. North America
- 2. Europe
- 3. Asia
- 4. Australia and New Zealand
- 5. Latin America
- 6. Middle East and Africa
Vehicle Analytics Market REPORT HIGHLIGHTS
| Aspects | Details |
|---|---|
| Study Period | 2019-2033 |
| Base Year | 2024 |
| Estimated Year | 2025 |
| Forecast Period | 2025-2033 |
| Historical Period | 2019-2024 |
| Growth Rate | CAGR of 24.30% from 2019-2033 |
| Segmentation |
|
Table of Contents
- 1. Introduction
- 1.1. Research Scope
- 1.2. Market Segmentation
- 1.3. Research Methodology
- 1.4. Definitions and Assumptions
- 2. Executive Summary
- 2.1. Introduction
- 3. Market Dynamics
- 3.1. Introduction
- 3.2. Market Drivers
- 3.2.1 Growing Adoption Of Vehicle Telematics; Advancements in Technology
- 3.2.2 Such as Artificial Intelligence and Predictive Analytics Leading to Applications in Vehicle Management
- 3.3. Market Restrains
- 3.3.1. High Cost of Solutions Limiting Adoption in High End Cars
- 3.4. Market Trends
- 3.4.1. Predictive Maintenence is Expected to Hold Significant Market Share
- 4. Market Factor Analysis
- 4.1. Porters Five Forces
- 4.2. Supply/Value Chain
- 4.3. PESTEL analysis
- 4.4. Market Entropy
- 4.5. Patent/Trademark Analysis
- 5. Global Vehicle Analytics Market Analysis, Insights and Forecast, 2019-2031
- 5.1. Market Analysis, Insights and Forecast - by Deployment
- 5.1.1. On-premise
- 5.1.2. Cloud
- 5.2. Market Analysis, Insights and Forecast - by Application
- 5.2.1. Predictive Maintenence
- 5.2.2. Safety and Security Management
- 5.2.3. Driver Performance Analysis
- 5.2.4. Other Applications
- 5.3. Market Analysis, Insights and Forecast - by End-user Industry
- 5.3.1. Fleet Owners
- 5.3.2. Insurers
- 5.3.3. OEMs and Service Providers
- 5.3.4. Other End-user Industries
- 5.4. Market Analysis, Insights and Forecast - by Region
- 5.4.1. North America
- 5.4.2. Europe
- 5.4.3. Asia
- 5.4.4. Australia and New Zealand
- 5.4.5. Latin America
- 5.4.6. Middle East and Africa
- 5.1. Market Analysis, Insights and Forecast - by Deployment
- 6. North America Vehicle Analytics Market Analysis, Insights and Forecast, 2019-2031
- 6.1. Market Analysis, Insights and Forecast - by Deployment
- 6.1.1. On-premise
- 6.1.2. Cloud
- 6.2. Market Analysis, Insights and Forecast - by Application
- 6.2.1. Predictive Maintenence
- 6.2.2. Safety and Security Management
- 6.2.3. Driver Performance Analysis
- 6.2.4. Other Applications
- 6.3. Market Analysis, Insights and Forecast - by End-user Industry
- 6.3.1. Fleet Owners
- 6.3.2. Insurers
- 6.3.3. OEMs and Service Providers
- 6.3.4. Other End-user Industries
- 6.1. Market Analysis, Insights and Forecast - by Deployment
- 7. Europe Vehicle Analytics Market Analysis, Insights and Forecast, 2019-2031
- 7.1. Market Analysis, Insights and Forecast - by Deployment
- 7.1.1. On-premise
- 7.1.2. Cloud
- 7.2. Market Analysis, Insights and Forecast - by Application
- 7.2.1. Predictive Maintenence
- 7.2.2. Safety and Security Management
- 7.2.3. Driver Performance Analysis
- 7.2.4. Other Applications
- 7.3. Market Analysis, Insights and Forecast - by End-user Industry
- 7.3.1. Fleet Owners
- 7.3.2. Insurers
- 7.3.3. OEMs and Service Providers
- 7.3.4. Other End-user Industries
- 7.1. Market Analysis, Insights and Forecast - by Deployment
- 8. Asia Vehicle Analytics Market Analysis, Insights and Forecast, 2019-2031
- 8.1. Market Analysis, Insights and Forecast - by Deployment
- 8.1.1. On-premise
- 8.1.2. Cloud
- 8.2. Market Analysis, Insights and Forecast - by Application
- 8.2.1. Predictive Maintenence
- 8.2.2. Safety and Security Management
- 8.2.3. Driver Performance Analysis
- 8.2.4. Other Applications
- 8.3. Market Analysis, Insights and Forecast - by End-user Industry
- 8.3.1. Fleet Owners
- 8.3.2. Insurers
- 8.3.3. OEMs and Service Providers
- 8.3.4. Other End-user Industries
- 8.1. Market Analysis, Insights and Forecast - by Deployment
- 9. Australia and New Zealand Vehicle Analytics Market Analysis, Insights and Forecast, 2019-2031
- 9.1. Market Analysis, Insights and Forecast - by Deployment
- 9.1.1. On-premise
- 9.1.2. Cloud
- 9.2. Market Analysis, Insights and Forecast - by Application
- 9.2.1. Predictive Maintenence
- 9.2.2. Safety and Security Management
- 9.2.3. Driver Performance Analysis
- 9.2.4. Other Applications
- 9.3. Market Analysis, Insights and Forecast - by End-user Industry
- 9.3.1. Fleet Owners
- 9.3.2. Insurers
- 9.3.3. OEMs and Service Providers
- 9.3.4. Other End-user Industries
- 9.1. Market Analysis, Insights and Forecast - by Deployment
- 10. Latin America Vehicle Analytics Market Analysis, Insights and Forecast, 2019-2031
- 10.1. Market Analysis, Insights and Forecast - by Deployment
- 10.1.1. On-premise
- 10.1.2. Cloud
- 10.2. Market Analysis, Insights and Forecast - by Application
- 10.2.1. Predictive Maintenence
- 10.2.2. Safety and Security Management
- 10.2.3. Driver Performance Analysis
- 10.2.4. Other Applications
- 10.3. Market Analysis, Insights and Forecast - by End-user Industry
- 10.3.1. Fleet Owners
- 10.3.2. Insurers
- 10.3.3. OEMs and Service Providers
- 10.3.4. Other End-user Industries
- 10.1. Market Analysis, Insights and Forecast - by Deployment
- 11. Middle East and Africa Vehicle Analytics Market Analysis, Insights and Forecast, 2019-2031
- 11.1. Market Analysis, Insights and Forecast - by Deployment
- 11.1.1. On-premise
- 11.1.2. Cloud
- 11.2. Market Analysis, Insights and Forecast - by Application
- 11.2.1. Predictive Maintenence
- 11.2.2. Safety and Security Management
- 11.2.3. Driver Performance Analysis
- 11.2.4. Other Applications
- 11.3. Market Analysis, Insights and Forecast - by End-user Industry
- 11.3.1. Fleet Owners
- 11.3.2. Insurers
- 11.3.3. OEMs and Service Providers
- 11.3.4. Other End-user Industries
- 11.1. Market Analysis, Insights and Forecast - by Deployment
- 12. North America Vehicle Analytics Market Analysis, Insights and Forecast, 2019-2031
- 12.1. Market Analysis, Insights and Forecast - By Country/Sub-region
- 12.1.1.
- 13. Europe Vehicle Analytics Market Analysis, Insights and Forecast, 2019-2031
- 13.1. Market Analysis, Insights and Forecast - By Country/Sub-region
- 13.1.1.
- 14. Asia Pacific Vehicle Analytics Market Analysis, Insights and Forecast, 2019-2031
- 14.1. Market Analysis, Insights and Forecast - By Country/Sub-region
- 14.1.1.
- 15. Latin America Vehicle Analytics Market Analysis, Insights and Forecast, 2019-2031
- 15.1. Market Analysis, Insights and Forecast - By Country/Sub-region
- 15.1.1.
- 16. Middle East Vehicle Analytics Market Analysis, Insights and Forecast, 2019-2031
- 16.1. Market Analysis, Insights and Forecast - By Country/Sub-region
- 16.1.1.
- 17. Competitive Analysis
- 17.1. Global Market Share Analysis 2024
- 17.2. Company Profiles
- 17.2.1 IBM Corporation
- 17.2.1.1. Overview
- 17.2.1.2. Products
- 17.2.1.3. SWOT Analysis
- 17.2.1.4. Recent Developments
- 17.2.1.5. Financials (Based on Availability)
- 17.2.2 Teletrac Navman US Ltd*List Not Exhaustive
- 17.2.2.1. Overview
- 17.2.2.2. Products
- 17.2.2.3. SWOT Analysis
- 17.2.2.4. Recent Developments
- 17.2.2.5. Financials (Based on Availability)
- 17.2.3 HARMAN International Industries Inc (Samsung Electronics Co Ltd)
- 17.2.3.1. Overview
- 17.2.3.2. Products
- 17.2.3.3. SWOT Analysis
- 17.2.3.4. Recent Developments
- 17.2.3.5. Financials (Based on Availability)
- 17.2.4 Microsoft Corporation
- 17.2.4.1. Overview
- 17.2.4.2. Products
- 17.2.4.3. SWOT Analysis
- 17.2.4.4. Recent Developments
- 17.2.4.5. Financials (Based on Availability)
- 17.2.5 Intelligent Mechatronic Systems Inc
- 17.2.5.1. Overview
- 17.2.5.2. Products
- 17.2.5.3. SWOT Analysis
- 17.2.5.4. Recent Developments
- 17.2.5.5. Financials (Based on Availability)
- 17.2.6 Genetec Inc
- 17.2.6.1. Overview
- 17.2.6.2. Products
- 17.2.6.3. SWOT Analysis
- 17.2.6.4. Recent Developments
- 17.2.6.5. Financials (Based on Availability)
- 17.2.7 Inquiron Ltd
- 17.2.7.1. Overview
- 17.2.7.2. Products
- 17.2.7.3. SWOT Analysis
- 17.2.7.4. Recent Developments
- 17.2.7.5. Financials (Based on Availability)
- 17.2.8 CloudMade
- 17.2.8.1. Overview
- 17.2.8.2. Products
- 17.2.8.3. SWOT Analysis
- 17.2.8.4. Recent Developments
- 17.2.8.5. Financials (Based on Availability)
- 17.2.9 SAP SE
- 17.2.9.1. Overview
- 17.2.9.2. Products
- 17.2.9.3. SWOT Analysis
- 17.2.9.4. Recent Developments
- 17.2.9.5. Financials (Based on Availability)
- 17.2.1 IBM Corporation
List of Figures
- Figure 1: Global Vehicle Analytics Market Revenue Breakdown (Million, %) by Region 2024 & 2032
- Figure 2: North America Vehicle Analytics Market Revenue (Million), by Country 2024 & 2032
- Figure 3: North America Vehicle Analytics Market Revenue Share (%), by Country 2024 & 2032
- Figure 4: Europe Vehicle Analytics Market Revenue (Million), by Country 2024 & 2032
- Figure 5: Europe Vehicle Analytics Market Revenue Share (%), by Country 2024 & 2032
- Figure 6: Asia Pacific Vehicle Analytics Market Revenue (Million), by Country 2024 & 2032
- Figure 7: Asia Pacific Vehicle Analytics Market Revenue Share (%), by Country 2024 & 2032
- Figure 8: Latin America Vehicle Analytics Market Revenue (Million), by Country 2024 & 2032
- Figure 9: Latin America Vehicle Analytics Market Revenue Share (%), by Country 2024 & 2032
- Figure 10: Middle East Vehicle Analytics Market Revenue (Million), by Country 2024 & 2032
- Figure 11: Middle East Vehicle Analytics Market Revenue Share (%), by Country 2024 & 2032
- Figure 12: North America Vehicle Analytics Market Revenue (Million), by Deployment 2024 & 2032
- Figure 13: North America Vehicle Analytics Market Revenue Share (%), by Deployment 2024 & 2032
- Figure 14: North America Vehicle Analytics Market Revenue (Million), by Application 2024 & 2032
- Figure 15: North America Vehicle Analytics Market Revenue Share (%), by Application 2024 & 2032
- Figure 16: North America Vehicle Analytics Market Revenue (Million), by End-user Industry 2024 & 2032
- Figure 17: North America Vehicle Analytics Market Revenue Share (%), by End-user Industry 2024 & 2032
- Figure 18: North America Vehicle Analytics Market Revenue (Million), by Country 2024 & 2032
- Figure 19: North America Vehicle Analytics Market Revenue Share (%), by Country 2024 & 2032
- Figure 20: Europe Vehicle Analytics Market Revenue (Million), by Deployment 2024 & 2032
- Figure 21: Europe Vehicle Analytics Market Revenue Share (%), by Deployment 2024 & 2032
- Figure 22: Europe Vehicle Analytics Market Revenue (Million), by Application 2024 & 2032
- Figure 23: Europe Vehicle Analytics Market Revenue Share (%), by Application 2024 & 2032
- Figure 24: Europe Vehicle Analytics Market Revenue (Million), by End-user Industry 2024 & 2032
- Figure 25: Europe Vehicle Analytics Market Revenue Share (%), by End-user Industry 2024 & 2032
- Figure 26: Europe Vehicle Analytics Market Revenue (Million), by Country 2024 & 2032
- Figure 27: Europe Vehicle Analytics Market Revenue Share (%), by Country 2024 & 2032
- Figure 28: Asia Vehicle Analytics Market Revenue (Million), by Deployment 2024 & 2032
- Figure 29: Asia Vehicle Analytics Market Revenue Share (%), by Deployment 2024 & 2032
- Figure 30: Asia Vehicle Analytics Market Revenue (Million), by Application 2024 & 2032
- Figure 31: Asia Vehicle Analytics Market Revenue Share (%), by Application 2024 & 2032
- Figure 32: Asia Vehicle Analytics Market Revenue (Million), by End-user Industry 2024 & 2032
- Figure 33: Asia Vehicle Analytics Market Revenue Share (%), by End-user Industry 2024 & 2032
- Figure 34: Asia Vehicle Analytics Market Revenue (Million), by Country 2024 & 2032
- Figure 35: Asia Vehicle Analytics Market Revenue Share (%), by Country 2024 & 2032
- Figure 36: Australia and New Zealand Vehicle Analytics Market Revenue (Million), by Deployment 2024 & 2032
- Figure 37: Australia and New Zealand Vehicle Analytics Market Revenue Share (%), by Deployment 2024 & 2032
- Figure 38: Australia and New Zealand Vehicle Analytics Market Revenue (Million), by Application 2024 & 2032
- Figure 39: Australia and New Zealand Vehicle Analytics Market Revenue Share (%), by Application 2024 & 2032
- Figure 40: Australia and New Zealand Vehicle Analytics Market Revenue (Million), by End-user Industry 2024 & 2032
- Figure 41: Australia and New Zealand Vehicle Analytics Market Revenue Share (%), by End-user Industry 2024 & 2032
- Figure 42: Australia and New Zealand Vehicle Analytics Market Revenue (Million), by Country 2024 & 2032
- Figure 43: Australia and New Zealand Vehicle Analytics Market Revenue Share (%), by Country 2024 & 2032
- Figure 44: Latin America Vehicle Analytics Market Revenue (Million), by Deployment 2024 & 2032
- Figure 45: Latin America Vehicle Analytics Market Revenue Share (%), by Deployment 2024 & 2032
- Figure 46: Latin America Vehicle Analytics Market Revenue (Million), by Application 2024 & 2032
- Figure 47: Latin America Vehicle Analytics Market Revenue Share (%), by Application 2024 & 2032
- Figure 48: Latin America Vehicle Analytics Market Revenue (Million), by End-user Industry 2024 & 2032
- Figure 49: Latin America Vehicle Analytics Market Revenue Share (%), by End-user Industry 2024 & 2032
- Figure 50: Latin America Vehicle Analytics Market Revenue (Million), by Country 2024 & 2032
- Figure 51: Latin America Vehicle Analytics Market Revenue Share (%), by Country 2024 & 2032
- Figure 52: Middle East and Africa Vehicle Analytics Market Revenue (Million), by Deployment 2024 & 2032
- Figure 53: Middle East and Africa Vehicle Analytics Market Revenue Share (%), by Deployment 2024 & 2032
- Figure 54: Middle East and Africa Vehicle Analytics Market Revenue (Million), by Application 2024 & 2032
- Figure 55: Middle East and Africa Vehicle Analytics Market Revenue Share (%), by Application 2024 & 2032
- Figure 56: Middle East and Africa Vehicle Analytics Market Revenue (Million), by End-user Industry 2024 & 2032
- Figure 57: Middle East and Africa Vehicle Analytics Market Revenue Share (%), by End-user Industry 2024 & 2032
- Figure 58: Middle East and Africa Vehicle Analytics Market Revenue (Million), by Country 2024 & 2032
- Figure 59: Middle East and Africa Vehicle Analytics Market Revenue Share (%), by Country 2024 & 2032
List of Tables
- Table 1: Global Vehicle Analytics Market Revenue Million Forecast, by Region 2019 & 2032
- Table 2: Global Vehicle Analytics Market Revenue Million Forecast, by Deployment 2019 & 2032
- Table 3: Global Vehicle Analytics Market Revenue Million Forecast, by Application 2019 & 2032
- Table 4: Global Vehicle Analytics Market Revenue Million Forecast, by End-user Industry 2019 & 2032
- Table 5: Global Vehicle Analytics Market Revenue Million Forecast, by Region 2019 & 2032
- Table 6: Global Vehicle Analytics Market Revenue Million Forecast, by Country 2019 & 2032
- Table 7: Vehicle Analytics Market Revenue (Million) Forecast, by Application 2019 & 2032
- Table 8: Global Vehicle Analytics Market Revenue Million Forecast, by Country 2019 & 2032
- Table 9: Vehicle Analytics Market Revenue (Million) Forecast, by Application 2019 & 2032
- Table 10: Global Vehicle Analytics Market Revenue Million Forecast, by Country 2019 & 2032
- Table 11: Vehicle Analytics Market Revenue (Million) Forecast, by Application 2019 & 2032
- Table 12: Global Vehicle Analytics Market Revenue Million Forecast, by Country 2019 & 2032
- Table 13: Vehicle Analytics Market Revenue (Million) Forecast, by Application 2019 & 2032
- Table 14: Global Vehicle Analytics Market Revenue Million Forecast, by Country 2019 & 2032
- Table 15: Vehicle Analytics Market Revenue (Million) Forecast, by Application 2019 & 2032
- Table 16: Global Vehicle Analytics Market Revenue Million Forecast, by Deployment 2019 & 2032
- Table 17: Global Vehicle Analytics Market Revenue Million Forecast, by Application 2019 & 2032
- Table 18: Global Vehicle Analytics Market Revenue Million Forecast, by End-user Industry 2019 & 2032
- Table 19: Global Vehicle Analytics Market Revenue Million Forecast, by Country 2019 & 2032
- Table 20: Global Vehicle Analytics Market Revenue Million Forecast, by Deployment 2019 & 2032
- Table 21: Global Vehicle Analytics Market Revenue Million Forecast, by Application 2019 & 2032
- Table 22: Global Vehicle Analytics Market Revenue Million Forecast, by End-user Industry 2019 & 2032
- Table 23: Global Vehicle Analytics Market Revenue Million Forecast, by Country 2019 & 2032
- Table 24: Global Vehicle Analytics Market Revenue Million Forecast, by Deployment 2019 & 2032
- Table 25: Global Vehicle Analytics Market Revenue Million Forecast, by Application 2019 & 2032
- Table 26: Global Vehicle Analytics Market Revenue Million Forecast, by End-user Industry 2019 & 2032
- Table 27: Global Vehicle Analytics Market Revenue Million Forecast, by Country 2019 & 2032
- Table 28: Global Vehicle Analytics Market Revenue Million Forecast, by Deployment 2019 & 2032
- Table 29: Global Vehicle Analytics Market Revenue Million Forecast, by Application 2019 & 2032
- Table 30: Global Vehicle Analytics Market Revenue Million Forecast, by End-user Industry 2019 & 2032
- Table 31: Global Vehicle Analytics Market Revenue Million Forecast, by Country 2019 & 2032
- Table 32: Global Vehicle Analytics Market Revenue Million Forecast, by Deployment 2019 & 2032
- Table 33: Global Vehicle Analytics Market Revenue Million Forecast, by Application 2019 & 2032
- Table 34: Global Vehicle Analytics Market Revenue Million Forecast, by End-user Industry 2019 & 2032
- Table 35: Global Vehicle Analytics Market Revenue Million Forecast, by Country 2019 & 2032
- Table 36: Global Vehicle Analytics Market Revenue Million Forecast, by Deployment 2019 & 2032
- Table 37: Global Vehicle Analytics Market Revenue Million Forecast, by Application 2019 & 2032
- Table 38: Global Vehicle Analytics Market Revenue Million Forecast, by End-user Industry 2019 & 2032
- Table 39: Global Vehicle Analytics Market Revenue Million Forecast, by Country 2019 & 2032
Frequently Asked Questions
1. What is the projected Compound Annual Growth Rate (CAGR) of the Vehicle Analytics Market?
The projected CAGR is approximately 24.30%.
2. Which companies are prominent players in the Vehicle Analytics Market?
Key companies in the market include IBM Corporation, Teletrac Navman US Ltd*List Not Exhaustive, HARMAN International Industries Inc (Samsung Electronics Co Ltd), Microsoft Corporation, Intelligent Mechatronic Systems Inc, Genetec Inc, Inquiron Ltd, CloudMade, SAP SE.
3. What are the main segments of the Vehicle Analytics Market?
The market segments include Deployment, Application, End-user Industry.
4. Can you provide details about the market size?
The market size is estimated to be USD XX Million as of 2022.
5. What are some drivers contributing to market growth?
Growing Adoption Of Vehicle Telematics; Advancements in Technology. Such as Artificial Intelligence and Predictive Analytics Leading to Applications in Vehicle Management.
6. What are the notable trends driving market growth?
Predictive Maintenence is Expected to Hold Significant Market Share.
7. Are there any restraints impacting market growth?
High Cost of Solutions Limiting Adoption in High End Cars.
8. Can you provide examples of recent developments in the market?
October 2022: BMW partnered with Amazon Web Services (AWS) to develop software that would collect and analyze data generated by connected vehicles. The data collection would expedite the development of features to enhance software life cycle management.
9. What pricing options are available for accessing the report?
Pricing options include single-user, multi-user, and enterprise licenses priced at USD 4750, USD 5250, and USD 8750 respectively.
10. Is the market size provided in terms of value or volume?
The market size is provided in terms of value, measured in Million.
11. Are there any specific market keywords associated with the report?
Yes, the market keyword associated with the report is "Vehicle Analytics Market," which aids in identifying and referencing the specific market segment covered.
12. How do I determine which pricing option suits my needs best?
The pricing options vary based on user requirements and access needs. Individual users may opt for single-user licenses, while businesses requiring broader access may choose multi-user or enterprise licenses for cost-effective access to the report.
13. Are there any additional resources or data provided in the Vehicle Analytics Market report?
While the report offers comprehensive insights, it's advisable to review the specific contents or supplementary materials provided to ascertain if additional resources or data are available.
14. How can I stay updated on further developments or reports in the Vehicle Analytics Market?
To stay informed about further developments, trends, and reports in the Vehicle Analytics Market, consider subscribing to industry newsletters, following relevant companies and organizations, or regularly checking reputable industry news sources and publications.
Methodology
Step 1 - Identification of Relevant Samples Size from Population Database


Step 2 - Approaches for Defining Global Market Size (Value, Volume* & Price*)

Note*: In applicable scenarios
Step 3 - Data Sources
Primary Research
- Web Analytics
- Survey Reports
- Research Institute
- Latest Research Reports
- Opinion Leaders
Secondary Research
- Annual Reports
- White Paper
- Latest Press Release
- Industry Association
- Paid Database
- Investor Presentations

Step 4 - Data Triangulation
Involves using different sources of information in order to increase the validity of a study
These sources are likely to be stakeholders in a program - participants, other researchers, program staff, other community members, and so on.
Then we put all data in single framework & apply various statistical tools to find out the dynamic on the market.
During the analysis stage, feedback from the stakeholder groups would be compared to determine areas of agreement as well as areas of divergence


