
Key Insights
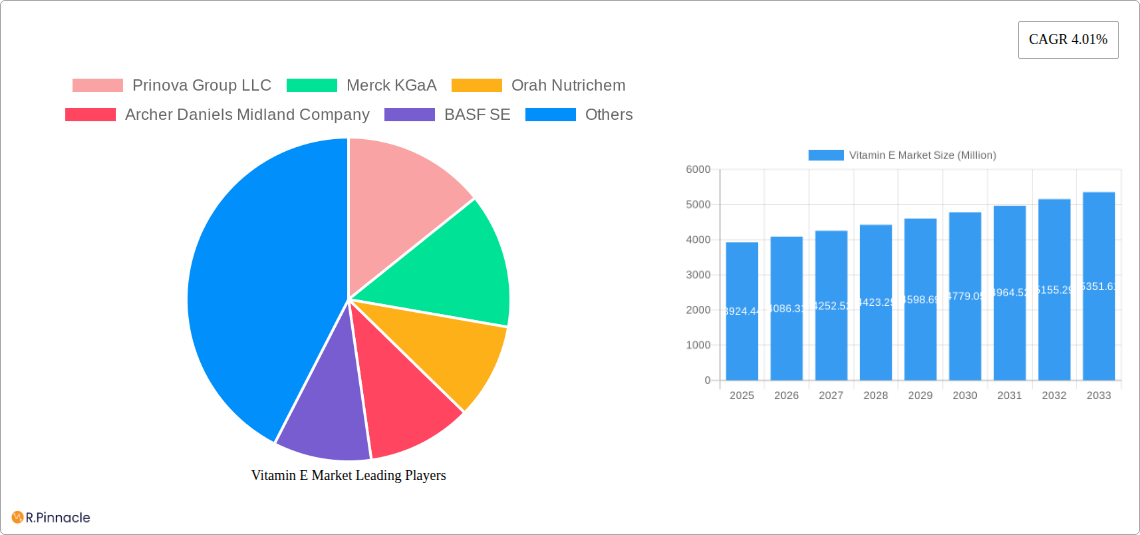
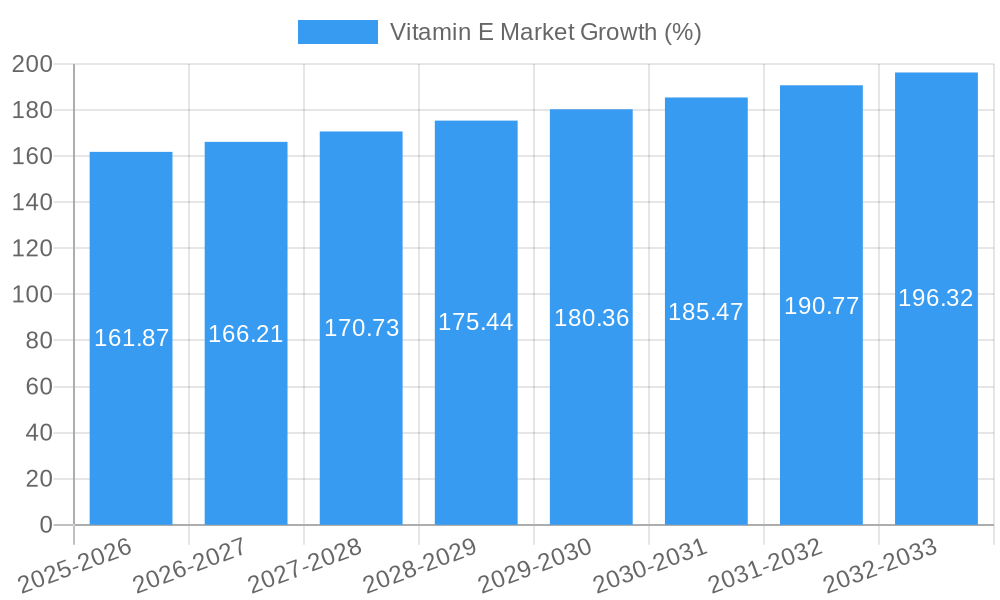
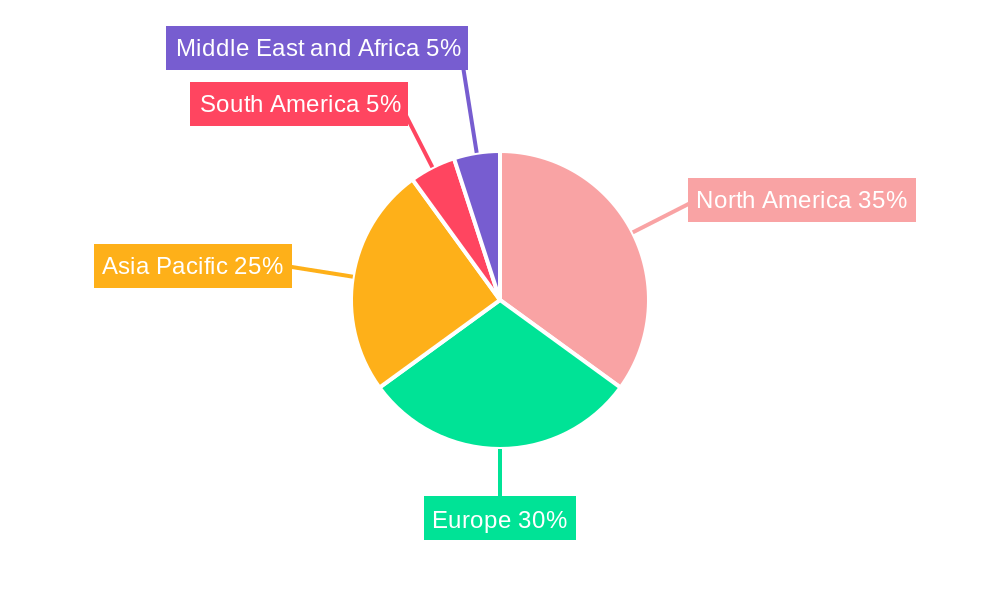
The global Vitamin E market, valued at $3924.44 million in 2025, is projected to experience robust growth, driven by increasing consumer awareness of its health benefits and its widespread applications across various sectors. The market's Compound Annual Growth Rate (CAGR) of 4.01% from 2019 to 2024 indicates a steady expansion, expected to continue throughout the forecast period (2025-2033). Key drivers include the rising prevalence of chronic diseases like cardiovascular ailments and cancer, fueling demand for supplements and functional foods enriched with Vitamin E. Growing demand for natural Vitamin E, due to increasing consumer preference for clean-label products and concerns about synthetic additives, further boosts market growth. The functional food and beverage segment is a major contributor, followed by the pharmaceuticals and dietary supplements sector. Regional variations exist, with North America and Europe currently holding significant market shares, but the Asia-Pacific region is expected to witness substantial growth due to rising disposable incomes and increasing health consciousness. The competitive landscape is characterized by a mix of large multinational corporations and specialized ingredient suppliers, each vying for market share through product innovation and strategic partnerships.
The restraints to market growth include fluctuations in raw material prices, stringent regulatory approvals for dietary supplements and pharmaceuticals, and the potential for consumer confusion regarding the various forms of Vitamin E and their efficacy. However, ongoing research into the diverse applications of Vitamin E in cosmetics and animal feed, coupled with advancements in extraction and production technologies, will likely mitigate these challenges. Companies are increasingly focusing on sustainability and transparency in their supply chains, which will become crucial factors driving consumer choice. The market segmentation by product type (natural and synthetic) and application (functional foods, pharmaceuticals, infant nutrition, pet food, and cosmetics) provides a detailed understanding of the specific market niches and growth potential within each category. Analyzing these segments can offer strategic insights for market entry and product diversification.
Vitamin E Market Report: Comprehensive Analysis & Future Outlook (2019-2033)
This in-depth report provides a comprehensive analysis of the global Vitamin E market, encompassing market size, growth drivers, challenges, and future trends from 2019 to 2033. The study covers key market segments, leading players, and significant industry developments, offering actionable insights for industry professionals and strategic decision-makers. With a base year of 2025 and a forecast period extending to 2033, this report is an essential resource for understanding the current landscape and future trajectory of the Vitamin E market. The total market size is estimated at xx Million in 2025.
Vitamin E Market Market Structure & Innovation Trends
This section analyzes the competitive landscape of the Vitamin E market, examining market concentration, innovation drivers, regulatory frameworks, product substitutes, end-user demographics, and M&A activities. The report delves into market share dynamics and provides a comprehensive overview of recent mergers and acquisitions, including deal values (where available).
Market Concentration: The Vitamin E market exhibits a moderately concentrated structure, with a few key players holding significant market share. Prinova Group LLC, Merck KGaA, and BASF SE are among the prominent players, though the exact market share distribution varies by segment.
Innovation Drivers: Innovation is driven by the rising demand for natural and sustainable vitamin E sources, coupled with the need for enhanced efficacy and bioavailability. Technological advancements in extraction and synthesis methods are also significant drivers.
Regulatory Frameworks: Stringent regulations regarding food safety and labeling impact the market, particularly in regions with strict health and wellness standards.
Product Substitutes: While Vitamin E has no direct substitutes, other antioxidants and nutrients might compete for the same market applications.
End-User Demographics: The demand for Vitamin E is driven by a growing health-conscious population, increasing awareness of its health benefits, and expanding application in various industries.
M&A Activities: Recent mergers and acquisitions, such as the One Rock Capital acquisition of BASF's specialty chemical facility in 2021, demonstrate the ongoing consolidation in the Vitamin E market. The total value of M&A deals in the recent years is estimated at xx Million. These activities signal strategic shifts and potential for market reshaping.
Vitamin E Market Market Dynamics & Trends
This section explores the key factors shaping the Vitamin E market's growth trajectory, including market growth drivers, technological disruptions, consumer preferences, and competitive dynamics.
The Vitamin E market is experiencing significant growth, driven by increasing consumer demand for health supplements, expanding applications in food and beverages, and the growing acceptance of natural vitamin E as an ingredient. Technological innovations in extraction processes and delivery systems are also contributing to market expansion. The CAGR is projected to be xx% during the forecast period (2025-2033). Market penetration varies across different regions and applications, with functional foods and dietary supplements representing a significant segment. Competitive dynamics are characterized by strategic alliances, product differentiation, and an emphasis on quality and sustainability. Consumer preferences shift toward natural, organic, and ethically sourced Vitamin E, which presents opportunities for manufacturers who meet these criteria.
Dominant Regions & Segments in Vitamin E Market
This section identifies the leading regions and segments within the Vitamin E market.
Leading Regions: [Mention the leading region and country, e.g., North America is currently the leading region, with the United States having the largest market share.]
Leading Segments:
By Product Type: The Natural Vitamin E segment is expected to witness higher growth due to increasing consumer preference for natural ingredients. The synthetic segment, while larger in volume, has been experiencing slower growth due to increasing health awareness regarding natural alternatives.
By Application: The Pharmaceuticals and Dietary Supplements segment dominates the market, driven by the growing demand for nutritional supplements and functional foods. The functional food and beverage segment is also showing strong growth as consumers look for healthier alternatives. Infant nutrition, pet food and animal feed, and cosmetics are emerging applications exhibiting promising growth.
Key Drivers: (Bullet Points)
- Strong consumer awareness regarding health and wellness
- Rising demand for fortified foods and dietary supplements
- Favorable government regulations and support for the vitamin and supplement industry
- Extensive research and development activities
Vitamin E Market Product Innovations
Recent product innovations focus on enhancing bioavailability, improving stability, and delivering Vitamin E in more convenient forms. Technological advancements are improving extraction methods and creating more sustainable and cost-effective options. Companies are increasingly focusing on product differentiation through sustainable sourcing, organic certification, and the development of innovative delivery systems. These innovations cater to a growing consumer base actively seeking natural and healthier options.
Report Scope & Segmentation Analysis
This report segments the Vitamin E market based on product type (Natural, Synthetic) and application (Functional Food and Beverages, Pharmaceuticals and Dietary Supplements, Infant Nutrition, Pet Food and Animal Feed, Cosmetics). Each segment's market size, growth projections, and competitive dynamics are analyzed.
By Product Type: Both the natural and synthetic segments hold significant market shares, with the natural segment exhibiting stronger growth due to consumer demand.
By Application: Each application segment shows varying growth rates, with Pharmaceuticals and Dietary Supplements holding the largest market share currently.
Key Drivers of Vitamin E Market Growth
The Vitamin E market is propelled by several factors including the growing health-conscious population, increased awareness of Vitamin E's benefits (antioxidant properties, skin health), and the expanding applications in various industries such as food, pharmaceuticals, and cosmetics. Government regulations promoting dietary supplements and fortified foods also contribute to market growth.
Challenges in the Vitamin E Market Sector
The Vitamin E market faces challenges such as fluctuating raw material prices, stringent regulations, and intense competition. Supply chain disruptions and quality control issues can impact market stability, while the rising cost of natural Vitamin E can affect affordability and accessibility for consumers.
Emerging Opportunities in Vitamin E Market
Emerging opportunities include the growing demand for natural and sustainable Vitamin E, the expansion into new markets (developing countries), and the development of innovative delivery systems (nanotechnology). The market is ripe for growth via new product formats and partnerships focusing on personalized nutrition.
Leading Players in the Vitamin E Market Market
- Prinova Group LLC
- Merck KGaA
- Orah Nutrichem
- Archer Daniels Midland Company
- BASF SE
- Aryan International
- Koninklijke DSM NV
- The Bountiful Company
- Jilin Beisha Pharmaceutical Co Ltd
- BTSA Biotecnologías Aplicadas SL
Key Developments in Vitamin E Market Industry
- June 2021: Prinova launched an e-commerce website, enhancing ingredient purchases and B2B vitamin distribution.
- June 2021: One Rock Capital acquired BASF's specialty chemical facility, boosting natural Vitamin E production.
- December 2021: The Kensing company partnered with Azelis for enhanced distribution of vitamin E across Europe, the Middle East, and Africa.
Future Outlook for Vitamin E Market Market
The Vitamin E market is poised for continued growth, driven by increasing health awareness, expanding applications, and the development of innovative products. Strategic partnerships, investments in R&D, and the focus on sustainability will further fuel market expansion. The market is expected to witness a substantial increase in market size over the forecast period (2025-2033).
Vitamin E Market Segmentation
-
1. Product Type
- 1.1. Natural
- 1.2. Synthetic
-
2. Application
- 2.1. Functional Food and Beverages
- 2.2. Pharmaceuticals and Dietary Supplements
- 2.3. Infant Nutrition
- 2.4. Pet Food and Animal Feed
- 2.5. Cosmetics
Vitamin E Market Segmentation By Geography
-
1. North America
- 1.1. United States
- 1.2. Canada
- 1.3. Mexico
- 1.4. Rest of North America
-
2. Europe
- 2.1. Germany
- 2.2. United Kingdom
- 2.3. France
- 2.4. Russia
- 2.5. Spain
- 2.6. Italy
- 2.7. Rest of Europe
-
3. Asia Pacific
- 3.1. India
- 3.2. China
- 3.3. Japan
- 3.4. Australia
- 3.5. Rest of Asia Pacific
-
4. South America
- 4.1. Brazil
- 4.2. Argentina
- 4.3. Rest of South America
-
5. Middle East and Africa
- 5.1. South Africa
- 5.2. Saudi Arabia
- 5.3. Rest of Middle East and Africa
Vitamin E Market REPORT HIGHLIGHTS
| Aspects | Details |
|---|---|
| Study Period | 2019-2033 |
| Base Year | 2024 |
| Estimated Year | 2025 |
| Forecast Period | 2025-2033 |
| Historical Period | 2019-2024 |
| Growth Rate | CAGR of 4.01% from 2019-2033 |
| Segmentation |
|
Table of Contents
- 1. Introduction
- 1.1. Research Scope
- 1.2. Market Segmentation
- 1.3. Research Methodology
- 1.4. Definitions and Assumptions
- 2. Executive Summary
- 2.1. Introduction
- 3. Market Dynamics
- 3.1. Introduction
- 3.2. Market Drivers
- 3.2.1. Awareness of Health Benefits Associated with Tocotrienol; Escalating Demand for Anti-Aging Products Containing Tocotrienol
- 3.3. Market Restrains
- 3.3.1. Availability of Substitutes
- 3.4. Market Trends
- 3.4.1. Increasing Demand for Vitamin E in Various Applications
- 4. Market Factor Analysis
- 4.1. Porters Five Forces
- 4.2. Supply/Value Chain
- 4.3. PESTEL analysis
- 4.4. Market Entropy
- 4.5. Patent/Trademark Analysis
- 5. Global Vitamin E Market Analysis, Insights and Forecast, 2019-2031
- 5.1. Market Analysis, Insights and Forecast - by Product Type
- 5.1.1. Natural
- 5.1.2. Synthetic
- 5.2. Market Analysis, Insights and Forecast - by Application
- 5.2.1. Functional Food and Beverages
- 5.2.2. Pharmaceuticals and Dietary Supplements
- 5.2.3. Infant Nutrition
- 5.2.4. Pet Food and Animal Feed
- 5.2.5. Cosmetics
- 5.3. Market Analysis, Insights and Forecast - by Region
- 5.3.1. North America
- 5.3.2. Europe
- 5.3.3. Asia Pacific
- 5.3.4. South America
- 5.3.5. Middle East and Africa
- 5.1. Market Analysis, Insights and Forecast - by Product Type
- 6. North America Vitamin E Market Analysis, Insights and Forecast, 2019-2031
- 6.1. Market Analysis, Insights and Forecast - by Product Type
- 6.1.1. Natural
- 6.1.2. Synthetic
- 6.2. Market Analysis, Insights and Forecast - by Application
- 6.2.1. Functional Food and Beverages
- 6.2.2. Pharmaceuticals and Dietary Supplements
- 6.2.3. Infant Nutrition
- 6.2.4. Pet Food and Animal Feed
- 6.2.5. Cosmetics
- 6.1. Market Analysis, Insights and Forecast - by Product Type
- 7. Europe Vitamin E Market Analysis, Insights and Forecast, 2019-2031
- 7.1. Market Analysis, Insights and Forecast - by Product Type
- 7.1.1. Natural
- 7.1.2. Synthetic
- 7.2. Market Analysis, Insights and Forecast - by Application
- 7.2.1. Functional Food and Beverages
- 7.2.2. Pharmaceuticals and Dietary Supplements
- 7.2.3. Infant Nutrition
- 7.2.4. Pet Food and Animal Feed
- 7.2.5. Cosmetics
- 7.1. Market Analysis, Insights and Forecast - by Product Type
- 8. Asia Pacific Vitamin E Market Analysis, Insights and Forecast, 2019-2031
- 8.1. Market Analysis, Insights and Forecast - by Product Type
- 8.1.1. Natural
- 8.1.2. Synthetic
- 8.2. Market Analysis, Insights and Forecast - by Application
- 8.2.1. Functional Food and Beverages
- 8.2.2. Pharmaceuticals and Dietary Supplements
- 8.2.3. Infant Nutrition
- 8.2.4. Pet Food and Animal Feed
- 8.2.5. Cosmetics
- 8.1. Market Analysis, Insights and Forecast - by Product Type
- 9. South America Vitamin E Market Analysis, Insights and Forecast, 2019-2031
- 9.1. Market Analysis, Insights and Forecast - by Product Type
- 9.1.1. Natural
- 9.1.2. Synthetic
- 9.2. Market Analysis, Insights and Forecast - by Application
- 9.2.1. Functional Food and Beverages
- 9.2.2. Pharmaceuticals and Dietary Supplements
- 9.2.3. Infant Nutrition
- 9.2.4. Pet Food and Animal Feed
- 9.2.5. Cosmetics
- 9.1. Market Analysis, Insights and Forecast - by Product Type
- 10. Middle East and Africa Vitamin E Market Analysis, Insights and Forecast, 2019-2031
- 10.1. Market Analysis, Insights and Forecast - by Product Type
- 10.1.1. Natural
- 10.1.2. Synthetic
- 10.2. Market Analysis, Insights and Forecast - by Application
- 10.2.1. Functional Food and Beverages
- 10.2.2. Pharmaceuticals and Dietary Supplements
- 10.2.3. Infant Nutrition
- 10.2.4. Pet Food and Animal Feed
- 10.2.5. Cosmetics
- 10.1. Market Analysis, Insights and Forecast - by Product Type
- 11. North America Vitamin E Market Analysis, Insights and Forecast, 2019-2031
- 11.1. Market Analysis, Insights and Forecast - By Country/Sub-region
- 11.1.1 United States
- 11.1.2 Canada
- 11.1.3 Mexico
- 11.1.4 Rest of North America
- 12. Europe Vitamin E Market Analysis, Insights and Forecast, 2019-2031
- 12.1. Market Analysis, Insights and Forecast - By Country/Sub-region
- 12.1.1 Germany
- 12.1.2 United Kingdom
- 12.1.3 France
- 12.1.4 Russia
- 12.1.5 Spain
- 12.1.6 Italy
- 12.1.7 Rest of Europe
- 13. Asia Pacific Vitamin E Market Analysis, Insights and Forecast, 2019-2031
- 13.1. Market Analysis, Insights and Forecast - By Country/Sub-region
- 13.1.1 India
- 13.1.2 China
- 13.1.3 Japan
- 13.1.4 Australia
- 13.1.5 Rest of Asia Pacific
- 14. South America Vitamin E Market Analysis, Insights and Forecast, 2019-2031
- 14.1. Market Analysis, Insights and Forecast - By Country/Sub-region
- 14.1.1 Brazil
- 14.1.2 Argentina
- 14.1.3 Rest of South America
- 15. Middle East and Africa Vitamin E Market Analysis, Insights and Forecast, 2019-2031
- 15.1. Market Analysis, Insights and Forecast - By Country/Sub-region
- 15.1.1 South Africa
- 15.1.2 Saudi Arabia
- 15.1.3 Rest of Middle East and Africa
- 16. Competitive Analysis
- 16.1. Global Market Share Analysis 2024
- 16.2. Company Profiles
- 16.2.1 Prinova Group LLC
- 16.2.1.1. Overview
- 16.2.1.2. Products
- 16.2.1.3. SWOT Analysis
- 16.2.1.4. Recent Developments
- 16.2.1.5. Financials (Based on Availability)
- 16.2.2 Merck KGaA
- 16.2.2.1. Overview
- 16.2.2.2. Products
- 16.2.2.3. SWOT Analysis
- 16.2.2.4. Recent Developments
- 16.2.2.5. Financials (Based on Availability)
- 16.2.3 Orah Nutrichem
- 16.2.3.1. Overview
- 16.2.3.2. Products
- 16.2.3.3. SWOT Analysis
- 16.2.3.4. Recent Developments
- 16.2.3.5. Financials (Based on Availability)
- 16.2.4 Archer Daniels Midland Company
- 16.2.4.1. Overview
- 16.2.4.2. Products
- 16.2.4.3. SWOT Analysis
- 16.2.4.4. Recent Developments
- 16.2.4.5. Financials (Based on Availability)
- 16.2.5 BASF SE
- 16.2.5.1. Overview
- 16.2.5.2. Products
- 16.2.5.3. SWOT Analysis
- 16.2.5.4. Recent Developments
- 16.2.5.5. Financials (Based on Availability)
- 16.2.6 Aryan International
- 16.2.6.1. Overview
- 16.2.6.2. Products
- 16.2.6.3. SWOT Analysis
- 16.2.6.4. Recent Developments
- 16.2.6.5. Financials (Based on Availability)
- 16.2.7 Koninklijke DSM NV
- 16.2.7.1. Overview
- 16.2.7.2. Products
- 16.2.7.3. SWOT Analysis
- 16.2.7.4. Recent Developments
- 16.2.7.5. Financials (Based on Availability)
- 16.2.8 The Bountiful Company*List Not Exhaustive
- 16.2.8.1. Overview
- 16.2.8.2. Products
- 16.2.8.3. SWOT Analysis
- 16.2.8.4. Recent Developments
- 16.2.8.5. Financials (Based on Availability)
- 16.2.9 Jilin Beisha Pharmaceutical Co Ltd
- 16.2.9.1. Overview
- 16.2.9.2. Products
- 16.2.9.3. SWOT Analysis
- 16.2.9.4. Recent Developments
- 16.2.9.5. Financials (Based on Availability)
- 16.2.10 BTSA Biotecnologías Aplicadas SL
- 16.2.10.1. Overview
- 16.2.10.2. Products
- 16.2.10.3. SWOT Analysis
- 16.2.10.4. Recent Developments
- 16.2.10.5. Financials (Based on Availability)
- 16.2.1 Prinova Group LLC
List of Figures
- Figure 1: Global Vitamin E Market Revenue Breakdown (Million, %) by Region 2024 & 2032
- Figure 2: Global Vitamin E Market Volume Breakdown (K Tons, %) by Region 2024 & 2032
- Figure 3: North America Vitamin E Market Revenue (Million), by Country 2024 & 2032
- Figure 4: North America Vitamin E Market Volume (K Tons), by Country 2024 & 2032
- Figure 5: North America Vitamin E Market Revenue Share (%), by Country 2024 & 2032
- Figure 6: North America Vitamin E Market Volume Share (%), by Country 2024 & 2032
- Figure 7: Europe Vitamin E Market Revenue (Million), by Country 2024 & 2032
- Figure 8: Europe Vitamin E Market Volume (K Tons), by Country 2024 & 2032
- Figure 9: Europe Vitamin E Market Revenue Share (%), by Country 2024 & 2032
- Figure 10: Europe Vitamin E Market Volume Share (%), by Country 2024 & 2032
- Figure 11: Asia Pacific Vitamin E Market Revenue (Million), by Country 2024 & 2032
- Figure 12: Asia Pacific Vitamin E Market Volume (K Tons), by Country 2024 & 2032
- Figure 13: Asia Pacific Vitamin E Market Revenue Share (%), by Country 2024 & 2032
- Figure 14: Asia Pacific Vitamin E Market Volume Share (%), by Country 2024 & 2032
- Figure 15: South America Vitamin E Market Revenue (Million), by Country 2024 & 2032
- Figure 16: South America Vitamin E Market Volume (K Tons), by Country 2024 & 2032
- Figure 17: South America Vitamin E Market Revenue Share (%), by Country 2024 & 2032
- Figure 18: South America Vitamin E Market Volume Share (%), by Country 2024 & 2032
- Figure 19: Middle East and Africa Vitamin E Market Revenue (Million), by Country 2024 & 2032
- Figure 20: Middle East and Africa Vitamin E Market Volume (K Tons), by Country 2024 & 2032
- Figure 21: Middle East and Africa Vitamin E Market Revenue Share (%), by Country 2024 & 2032
- Figure 22: Middle East and Africa Vitamin E Market Volume Share (%), by Country 2024 & 2032
- Figure 23: North America Vitamin E Market Revenue (Million), by Product Type 2024 & 2032
- Figure 24: North America Vitamin E Market Volume (K Tons), by Product Type 2024 & 2032
- Figure 25: North America Vitamin E Market Revenue Share (%), by Product Type 2024 & 2032
- Figure 26: North America Vitamin E Market Volume Share (%), by Product Type 2024 & 2032
- Figure 27: North America Vitamin E Market Revenue (Million), by Application 2024 & 2032
- Figure 28: North America Vitamin E Market Volume (K Tons), by Application 2024 & 2032
- Figure 29: North America Vitamin E Market Revenue Share (%), by Application 2024 & 2032
- Figure 30: North America Vitamin E Market Volume Share (%), by Application 2024 & 2032
- Figure 31: North America Vitamin E Market Revenue (Million), by Country 2024 & 2032
- Figure 32: North America Vitamin E Market Volume (K Tons), by Country 2024 & 2032
- Figure 33: North America Vitamin E Market Revenue Share (%), by Country 2024 & 2032
- Figure 34: North America Vitamin E Market Volume Share (%), by Country 2024 & 2032
- Figure 35: Europe Vitamin E Market Revenue (Million), by Product Type 2024 & 2032
- Figure 36: Europe Vitamin E Market Volume (K Tons), by Product Type 2024 & 2032
- Figure 37: Europe Vitamin E Market Revenue Share (%), by Product Type 2024 & 2032
- Figure 38: Europe Vitamin E Market Volume Share (%), by Product Type 2024 & 2032
- Figure 39: Europe Vitamin E Market Revenue (Million), by Application 2024 & 2032
- Figure 40: Europe Vitamin E Market Volume (K Tons), by Application 2024 & 2032
- Figure 41: Europe Vitamin E Market Revenue Share (%), by Application 2024 & 2032
- Figure 42: Europe Vitamin E Market Volume Share (%), by Application 2024 & 2032
- Figure 43: Europe Vitamin E Market Revenue (Million), by Country 2024 & 2032
- Figure 44: Europe Vitamin E Market Volume (K Tons), by Country 2024 & 2032
- Figure 45: Europe Vitamin E Market Revenue Share (%), by Country 2024 & 2032
- Figure 46: Europe Vitamin E Market Volume Share (%), by Country 2024 & 2032
- Figure 47: Asia Pacific Vitamin E Market Revenue (Million), by Product Type 2024 & 2032
- Figure 48: Asia Pacific Vitamin E Market Volume (K Tons), by Product Type 2024 & 2032
- Figure 49: Asia Pacific Vitamin E Market Revenue Share (%), by Product Type 2024 & 2032
- Figure 50: Asia Pacific Vitamin E Market Volume Share (%), by Product Type 2024 & 2032
- Figure 51: Asia Pacific Vitamin E Market Revenue (Million), by Application 2024 & 2032
- Figure 52: Asia Pacific Vitamin E Market Volume (K Tons), by Application 2024 & 2032
- Figure 53: Asia Pacific Vitamin E Market Revenue Share (%), by Application 2024 & 2032
- Figure 54: Asia Pacific Vitamin E Market Volume Share (%), by Application 2024 & 2032
- Figure 55: Asia Pacific Vitamin E Market Revenue (Million), by Country 2024 & 2032
- Figure 56: Asia Pacific Vitamin E Market Volume (K Tons), by Country 2024 & 2032
- Figure 57: Asia Pacific Vitamin E Market Revenue Share (%), by Country 2024 & 2032
- Figure 58: Asia Pacific Vitamin E Market Volume Share (%), by Country 2024 & 2032
- Figure 59: South America Vitamin E Market Revenue (Million), by Product Type 2024 & 2032
- Figure 60: South America Vitamin E Market Volume (K Tons), by Product Type 2024 & 2032
- Figure 61: South America Vitamin E Market Revenue Share (%), by Product Type 2024 & 2032
- Figure 62: South America Vitamin E Market Volume Share (%), by Product Type 2024 & 2032
- Figure 63: South America Vitamin E Market Revenue (Million), by Application 2024 & 2032
- Figure 64: South America Vitamin E Market Volume (K Tons), by Application 2024 & 2032
- Figure 65: South America Vitamin E Market Revenue Share (%), by Application 2024 & 2032
- Figure 66: South America Vitamin E Market Volume Share (%), by Application 2024 & 2032
- Figure 67: South America Vitamin E Market Revenue (Million), by Country 2024 & 2032
- Figure 68: South America Vitamin E Market Volume (K Tons), by Country 2024 & 2032
- Figure 69: South America Vitamin E Market Revenue Share (%), by Country 2024 & 2032
- Figure 70: South America Vitamin E Market Volume Share (%), by Country 2024 & 2032
- Figure 71: Middle East and Africa Vitamin E Market Revenue (Million), by Product Type 2024 & 2032
- Figure 72: Middle East and Africa Vitamin E Market Volume (K Tons), by Product Type 2024 & 2032
- Figure 73: Middle East and Africa Vitamin E Market Revenue Share (%), by Product Type 2024 & 2032
- Figure 74: Middle East and Africa Vitamin E Market Volume Share (%), by Product Type 2024 & 2032
- Figure 75: Middle East and Africa Vitamin E Market Revenue (Million), by Application 2024 & 2032
- Figure 76: Middle East and Africa Vitamin E Market Volume (K Tons), by Application 2024 & 2032
- Figure 77: Middle East and Africa Vitamin E Market Revenue Share (%), by Application 2024 & 2032
- Figure 78: Middle East and Africa Vitamin E Market Volume Share (%), by Application 2024 & 2032
- Figure 79: Middle East and Africa Vitamin E Market Revenue (Million), by Country 2024 & 2032
- Figure 80: Middle East and Africa Vitamin E Market Volume (K Tons), by Country 2024 & 2032
- Figure 81: Middle East and Africa Vitamin E Market Revenue Share (%), by Country 2024 & 2032
- Figure 82: Middle East and Africa Vitamin E Market Volume Share (%), by Country 2024 & 2032
List of Tables
- Table 1: Global Vitamin E Market Revenue Million Forecast, by Region 2019 & 2032
- Table 2: Global Vitamin E Market Volume K Tons Forecast, by Region 2019 & 2032
- Table 3: Global Vitamin E Market Revenue Million Forecast, by Product Type 2019 & 2032
- Table 4: Global Vitamin E Market Volume K Tons Forecast, by Product Type 2019 & 2032
- Table 5: Global Vitamin E Market Revenue Million Forecast, by Application 2019 & 2032
- Table 6: Global Vitamin E Market Volume K Tons Forecast, by Application 2019 & 2032
- Table 7: Global Vitamin E Market Revenue Million Forecast, by Region 2019 & 2032
- Table 8: Global Vitamin E Market Volume K Tons Forecast, by Region 2019 & 2032
- Table 9: Global Vitamin E Market Revenue Million Forecast, by Country 2019 & 2032
- Table 10: Global Vitamin E Market Volume K Tons Forecast, by Country 2019 & 2032
- Table 11: United States Vitamin E Market Revenue (Million) Forecast, by Application 2019 & 2032
- Table 12: United States Vitamin E Market Volume (K Tons) Forecast, by Application 2019 & 2032
- Table 13: Canada Vitamin E Market Revenue (Million) Forecast, by Application 2019 & 2032
- Table 14: Canada Vitamin E Market Volume (K Tons) Forecast, by Application 2019 & 2032
- Table 15: Mexico Vitamin E Market Revenue (Million) Forecast, by Application 2019 & 2032
- Table 16: Mexico Vitamin E Market Volume (K Tons) Forecast, by Application 2019 & 2032
- Table 17: Rest of North America Vitamin E Market Revenue (Million) Forecast, by Application 2019 & 2032
- Table 18: Rest of North America Vitamin E Market Volume (K Tons) Forecast, by Application 2019 & 2032
- Table 19: Global Vitamin E Market Revenue Million Forecast, by Country 2019 & 2032
- Table 20: Global Vitamin E Market Volume K Tons Forecast, by Country 2019 & 2032
- Table 21: Germany Vitamin E Market Revenue (Million) Forecast, by Application 2019 & 2032
- Table 22: Germany Vitamin E Market Volume (K Tons) Forecast, by Application 2019 & 2032
- Table 23: United Kingdom Vitamin E Market Revenue (Million) Forecast, by Application 2019 & 2032
- Table 24: United Kingdom Vitamin E Market Volume (K Tons) Forecast, by Application 2019 & 2032
- Table 25: France Vitamin E Market Revenue (Million) Forecast, by Application 2019 & 2032
- Table 26: France Vitamin E Market Volume (K Tons) Forecast, by Application 2019 & 2032
- Table 27: Russia Vitamin E Market Revenue (Million) Forecast, by Application 2019 & 2032
- Table 28: Russia Vitamin E Market Volume (K Tons) Forecast, by Application 2019 & 2032
- Table 29: Spain Vitamin E Market Revenue (Million) Forecast, by Application 2019 & 2032
- Table 30: Spain Vitamin E Market Volume (K Tons) Forecast, by Application 2019 & 2032
- Table 31: Italy Vitamin E Market Revenue (Million) Forecast, by Application 2019 & 2032
- Table 32: Italy Vitamin E Market Volume (K Tons) Forecast, by Application 2019 & 2032
- Table 33: Rest of Europe Vitamin E Market Revenue (Million) Forecast, by Application 2019 & 2032
- Table 34: Rest of Europe Vitamin E Market Volume (K Tons) Forecast, by Application 2019 & 2032
- Table 35: Global Vitamin E Market Revenue Million Forecast, by Country 2019 & 2032
- Table 36: Global Vitamin E Market Volume K Tons Forecast, by Country 2019 & 2032
- Table 37: India Vitamin E Market Revenue (Million) Forecast, by Application 2019 & 2032
- Table 38: India Vitamin E Market Volume (K Tons) Forecast, by Application 2019 & 2032
- Table 39: China Vitamin E Market Revenue (Million) Forecast, by Application 2019 & 2032
- Table 40: China Vitamin E Market Volume (K Tons) Forecast, by Application 2019 & 2032
- Table 41: Japan Vitamin E Market Revenue (Million) Forecast, by Application 2019 & 2032
- Table 42: Japan Vitamin E Market Volume (K Tons) Forecast, by Application 2019 & 2032
- Table 43: Australia Vitamin E Market Revenue (Million) Forecast, by Application 2019 & 2032
- Table 44: Australia Vitamin E Market Volume (K Tons) Forecast, by Application 2019 & 2032
- Table 45: Rest of Asia Pacific Vitamin E Market Revenue (Million) Forecast, by Application 2019 & 2032
- Table 46: Rest of Asia Pacific Vitamin E Market Volume (K Tons) Forecast, by Application 2019 & 2032
- Table 47: Global Vitamin E Market Revenue Million Forecast, by Country 2019 & 2032
- Table 48: Global Vitamin E Market Volume K Tons Forecast, by Country 2019 & 2032
- Table 49: Brazil Vitamin E Market Revenue (Million) Forecast, by Application 2019 & 2032
- Table 50: Brazil Vitamin E Market Volume (K Tons) Forecast, by Application 2019 & 2032
- Table 51: Argentina Vitamin E Market Revenue (Million) Forecast, by Application 2019 & 2032
- Table 52: Argentina Vitamin E Market Volume (K Tons) Forecast, by Application 2019 & 2032
- Table 53: Rest of South America Vitamin E Market Revenue (Million) Forecast, by Application 2019 & 2032
- Table 54: Rest of South America Vitamin E Market Volume (K Tons) Forecast, by Application 2019 & 2032
- Table 55: Global Vitamin E Market Revenue Million Forecast, by Country 2019 & 2032
- Table 56: Global Vitamin E Market Volume K Tons Forecast, by Country 2019 & 2032
- Table 57: South Africa Vitamin E Market Revenue (Million) Forecast, by Application 2019 & 2032
- Table 58: South Africa Vitamin E Market Volume (K Tons) Forecast, by Application 2019 & 2032
- Table 59: Saudi Arabia Vitamin E Market Revenue (Million) Forecast, by Application 2019 & 2032
- Table 60: Saudi Arabia Vitamin E Market Volume (K Tons) Forecast, by Application 2019 & 2032
- Table 61: Rest of Middle East and Africa Vitamin E Market Revenue (Million) Forecast, by Application 2019 & 2032
- Table 62: Rest of Middle East and Africa Vitamin E Market Volume (K Tons) Forecast, by Application 2019 & 2032
- Table 63: Global Vitamin E Market Revenue Million Forecast, by Product Type 2019 & 2032
- Table 64: Global Vitamin E Market Volume K Tons Forecast, by Product Type 2019 & 2032
- Table 65: Global Vitamin E Market Revenue Million Forecast, by Application 2019 & 2032
- Table 66: Global Vitamin E Market Volume K Tons Forecast, by Application 2019 & 2032
- Table 67: Global Vitamin E Market Revenue Million Forecast, by Country 2019 & 2032
- Table 68: Global Vitamin E Market Volume K Tons Forecast, by Country 2019 & 2032
- Table 69: United States Vitamin E Market Revenue (Million) Forecast, by Application 2019 & 2032
- Table 70: United States Vitamin E Market Volume (K Tons) Forecast, by Application 2019 & 2032
- Table 71: Canada Vitamin E Market Revenue (Million) Forecast, by Application 2019 & 2032
- Table 72: Canada Vitamin E Market Volume (K Tons) Forecast, by Application 2019 & 2032
- Table 73: Mexico Vitamin E Market Revenue (Million) Forecast, by Application 2019 & 2032
- Table 74: Mexico Vitamin E Market Volume (K Tons) Forecast, by Application 2019 & 2032
- Table 75: Rest of North America Vitamin E Market Revenue (Million) Forecast, by Application 2019 & 2032
- Table 76: Rest of North America Vitamin E Market Volume (K Tons) Forecast, by Application 2019 & 2032
- Table 77: Global Vitamin E Market Revenue Million Forecast, by Product Type 2019 & 2032
- Table 78: Global Vitamin E Market Volume K Tons Forecast, by Product Type 2019 & 2032
- Table 79: Global Vitamin E Market Revenue Million Forecast, by Application 2019 & 2032
- Table 80: Global Vitamin E Market Volume K Tons Forecast, by Application 2019 & 2032
- Table 81: Global Vitamin E Market Revenue Million Forecast, by Country 2019 & 2032
- Table 82: Global Vitamin E Market Volume K Tons Forecast, by Country 2019 & 2032
- Table 83: Germany Vitamin E Market Revenue (Million) Forecast, by Application 2019 & 2032
- Table 84: Germany Vitamin E Market Volume (K Tons) Forecast, by Application 2019 & 2032
- Table 85: United Kingdom Vitamin E Market Revenue (Million) Forecast, by Application 2019 & 2032
- Table 86: United Kingdom Vitamin E Market Volume (K Tons) Forecast, by Application 2019 & 2032
- Table 87: France Vitamin E Market Revenue (Million) Forecast, by Application 2019 & 2032
- Table 88: France Vitamin E Market Volume (K Tons) Forecast, by Application 2019 & 2032
- Table 89: Russia Vitamin E Market Revenue (Million) Forecast, by Application 2019 & 2032
- Table 90: Russia Vitamin E Market Volume (K Tons) Forecast, by Application 2019 & 2032
- Table 91: Spain Vitamin E Market Revenue (Million) Forecast, by Application 2019 & 2032
- Table 92: Spain Vitamin E Market Volume (K Tons) Forecast, by Application 2019 & 2032
- Table 93: Italy Vitamin E Market Revenue (Million) Forecast, by Application 2019 & 2032
- Table 94: Italy Vitamin E Market Volume (K Tons) Forecast, by Application 2019 & 2032
- Table 95: Rest of Europe Vitamin E Market Revenue (Million) Forecast, by Application 2019 & 2032
- Table 96: Rest of Europe Vitamin E Market Volume (K Tons) Forecast, by Application 2019 & 2032
- Table 97: Global Vitamin E Market Revenue Million Forecast, by Product Type 2019 & 2032
- Table 98: Global Vitamin E Market Volume K Tons Forecast, by Product Type 2019 & 2032
- Table 99: Global Vitamin E Market Revenue Million Forecast, by Application 2019 & 2032
- Table 100: Global Vitamin E Market Volume K Tons Forecast, by Application 2019 & 2032
- Table 101: Global Vitamin E Market Revenue Million Forecast, by Country 2019 & 2032
- Table 102: Global Vitamin E Market Volume K Tons Forecast, by Country 2019 & 2032
- Table 103: India Vitamin E Market Revenue (Million) Forecast, by Application 2019 & 2032
- Table 104: India Vitamin E Market Volume (K Tons) Forecast, by Application 2019 & 2032
- Table 105: China Vitamin E Market Revenue (Million) Forecast, by Application 2019 & 2032
- Table 106: China Vitamin E Market Volume (K Tons) Forecast, by Application 2019 & 2032
- Table 107: Japan Vitamin E Market Revenue (Million) Forecast, by Application 2019 & 2032
- Table 108: Japan Vitamin E Market Volume (K Tons) Forecast, by Application 2019 & 2032
- Table 109: Australia Vitamin E Market Revenue (Million) Forecast, by Application 2019 & 2032
- Table 110: Australia Vitamin E Market Volume (K Tons) Forecast, by Application 2019 & 2032
- Table 111: Rest of Asia Pacific Vitamin E Market Revenue (Million) Forecast, by Application 2019 & 2032
- Table 112: Rest of Asia Pacific Vitamin E Market Volume (K Tons) Forecast, by Application 2019 & 2032
- Table 113: Global Vitamin E Market Revenue Million Forecast, by Product Type 2019 & 2032
- Table 114: Global Vitamin E Market Volume K Tons Forecast, by Product Type 2019 & 2032
- Table 115: Global Vitamin E Market Revenue Million Forecast, by Application 2019 & 2032
- Table 116: Global Vitamin E Market Volume K Tons Forecast, by Application 2019 & 2032
- Table 117: Global Vitamin E Market Revenue Million Forecast, by Country 2019 & 2032
- Table 118: Global Vitamin E Market Volume K Tons Forecast, by Country 2019 & 2032
- Table 119: Brazil Vitamin E Market Revenue (Million) Forecast, by Application 2019 & 2032
- Table 120: Brazil Vitamin E Market Volume (K Tons) Forecast, by Application 2019 & 2032
- Table 121: Argentina Vitamin E Market Revenue (Million) Forecast, by Application 2019 & 2032
- Table 122: Argentina Vitamin E Market Volume (K Tons) Forecast, by Application 2019 & 2032
- Table 123: Rest of South America Vitamin E Market Revenue (Million) Forecast, by Application 2019 & 2032
- Table 124: Rest of South America Vitamin E Market Volume (K Tons) Forecast, by Application 2019 & 2032
- Table 125: Global Vitamin E Market Revenue Million Forecast, by Product Type 2019 & 2032
- Table 126: Global Vitamin E Market Volume K Tons Forecast, by Product Type 2019 & 2032
- Table 127: Global Vitamin E Market Revenue Million Forecast, by Application 2019 & 2032
- Table 128: Global Vitamin E Market Volume K Tons Forecast, by Application 2019 & 2032
- Table 129: Global Vitamin E Market Revenue Million Forecast, by Country 2019 & 2032
- Table 130: Global Vitamin E Market Volume K Tons Forecast, by Country 2019 & 2032
- Table 131: South Africa Vitamin E Market Revenue (Million) Forecast, by Application 2019 & 2032
- Table 132: South Africa Vitamin E Market Volume (K Tons) Forecast, by Application 2019 & 2032
- Table 133: Saudi Arabia Vitamin E Market Revenue (Million) Forecast, by Application 2019 & 2032
- Table 134: Saudi Arabia Vitamin E Market Volume (K Tons) Forecast, by Application 2019 & 2032
- Table 135: Rest of Middle East and Africa Vitamin E Market Revenue (Million) Forecast, by Application 2019 & 2032
- Table 136: Rest of Middle East and Africa Vitamin E Market Volume (K Tons) Forecast, by Application 2019 & 2032
Frequently Asked Questions
1. What is the projected Compound Annual Growth Rate (CAGR) of the Vitamin E Market?
The projected CAGR is approximately 4.01%.
2. Which companies are prominent players in the Vitamin E Market?
Key companies in the market include Prinova Group LLC, Merck KGaA, Orah Nutrichem, Archer Daniels Midland Company, BASF SE, Aryan International, Koninklijke DSM NV, The Bountiful Company*List Not Exhaustive, Jilin Beisha Pharmaceutical Co Ltd, BTSA Biotecnologías Aplicadas SL.
3. What are the main segments of the Vitamin E Market?
The market segments include Product Type, Application.
4. Can you provide details about the market size?
The market size is estimated to be USD 3924.44 Million as of 2022.
5. What are some drivers contributing to market growth?
Awareness of Health Benefits Associated with Tocotrienol; Escalating Demand for Anti-Aging Products Containing Tocotrienol.
6. What are the notable trends driving market growth?
Increasing Demand for Vitamin E in Various Applications.
7. Are there any restraints impacting market growth?
Availability of Substitutes.
8. Can you provide examples of recent developments in the market?
December 2021: The Kensing company announced its partnership with Azelis for a better and more feasible distribution of vegetable oils, vitamins, and personal care products in Europe and the Middle East and Africa. Azelis has a strong distribution network across these regions in the B2B segment. The company mainly aims to distribute its mainstream products Covi-ox, Covitol, Copherol, and Generol.
9. What pricing options are available for accessing the report?
Pricing options include single-user, multi-user, and enterprise licenses priced at USD 4750, USD 5250, and USD 8750 respectively.
10. Is the market size provided in terms of value or volume?
The market size is provided in terms of value, measured in Million and volume, measured in K Tons.
11. Are there any specific market keywords associated with the report?
Yes, the market keyword associated with the report is "Vitamin E Market," which aids in identifying and referencing the specific market segment covered.
12. How do I determine which pricing option suits my needs best?
The pricing options vary based on user requirements and access needs. Individual users may opt for single-user licenses, while businesses requiring broader access may choose multi-user or enterprise licenses for cost-effective access to the report.
13. Are there any additional resources or data provided in the Vitamin E Market report?
While the report offers comprehensive insights, it's advisable to review the specific contents or supplementary materials provided to ascertain if additional resources or data are available.
14. How can I stay updated on further developments or reports in the Vitamin E Market?
To stay informed about further developments, trends, and reports in the Vitamin E Market, consider subscribing to industry newsletters, following relevant companies and organizations, or regularly checking reputable industry news sources and publications.
Methodology
Step 1 - Identification of Relevant Samples Size from Population Database


Step 2 - Approaches for Defining Global Market Size (Value, Volume* & Price*)

Note*: In applicable scenarios
Step 3 - Data Sources
Primary Research
- Web Analytics
- Survey Reports
- Research Institute
- Latest Research Reports
- Opinion Leaders
Secondary Research
- Annual Reports
- White Paper
- Latest Press Release
- Industry Association
- Paid Database
- Investor Presentations

Step 4 - Data Triangulation
Involves using different sources of information in order to increase the validity of a study
These sources are likely to be stakeholders in a program - participants, other researchers, program staff, other community members, and so on.
Then we put all data in single framework & apply various statistical tools to find out the dynamic on the market.
During the analysis stage, feedback from the stakeholder groups would be compared to determine areas of agreement as well as areas of divergence


