
Key Insights
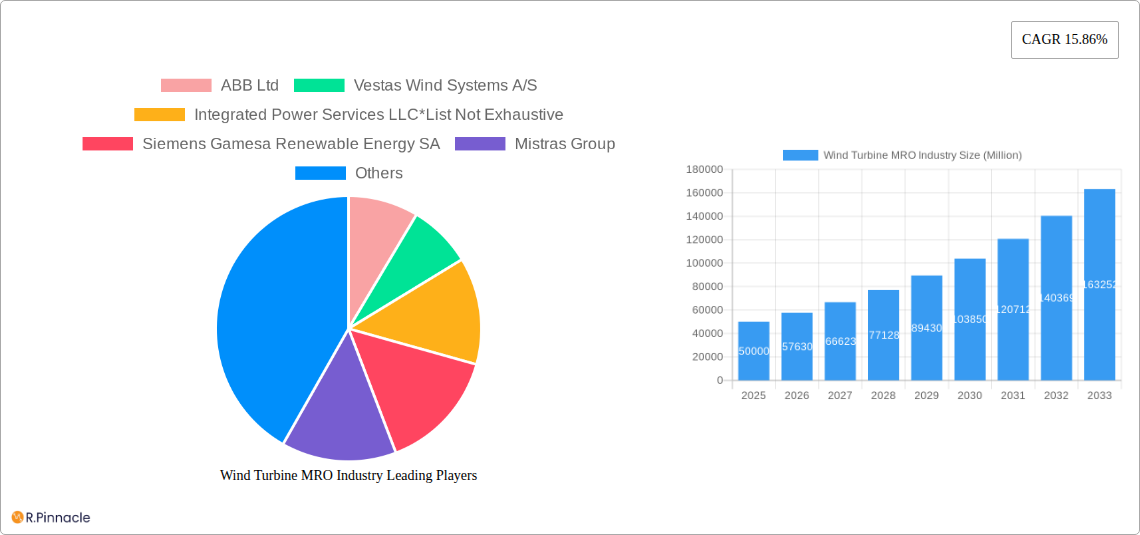
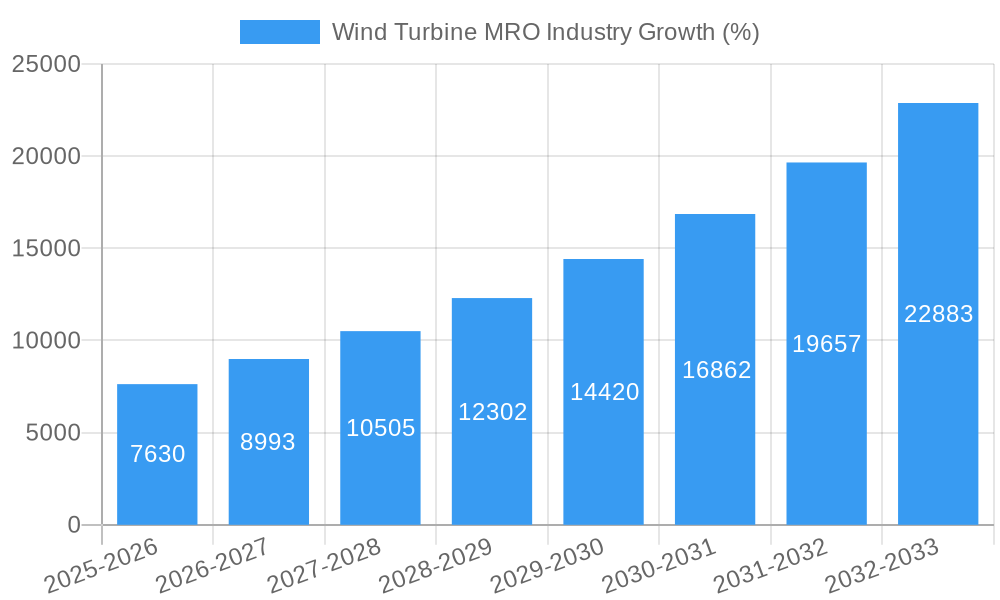
The global wind turbine maintenance, repair, and overhaul (MRO) market is experiencing robust growth, projected to reach a substantial size and maintain a Compound Annual Growth Rate (CAGR) of 15.86% from 2025 to 2033. This expansion is driven by several key factors. Firstly, the increasing global reliance on renewable energy sources is fueling a significant rise in wind turbine installations, consequently escalating the demand for MRO services to ensure optimal performance and longevity. Secondly, the aging wind turbine fleet necessitates more frequent and extensive maintenance, contributing significantly to market growth. Technological advancements in MRO techniques, such as predictive maintenance utilizing advanced analytics and remote diagnostics, are further enhancing efficiency and reducing downtime, making MRO services more attractive and cost-effective. Finally, stricter regulatory compliance requirements for wind turbine safety and operational reliability necessitate consistent and high-quality MRO services. The market is segmented by service type (maintenance, repair, overhaul), component (gearboxes, generators, rotor blades, and other components), and location of deployment (onshore and offshore), each offering unique growth trajectories. Onshore wind farms currently dominate the market, however, the offshore segment shows significant potential for future expansion, driven by increasing offshore wind energy projects globally.
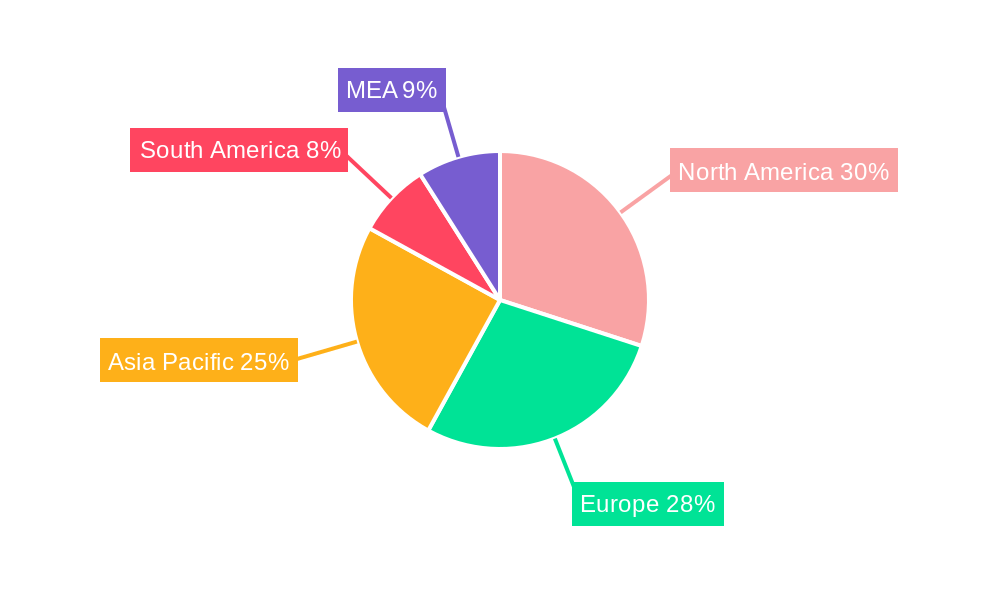
Major players like ABB Ltd, Vestas Wind Systems A/S, Siemens Gamesa Renewable Energy SA, and General Electric Company are significantly shaping market dynamics through technological innovations and strategic partnerships. Competition is expected to intensify as new players enter the market, further driving innovation and potentially impacting pricing. The geographical distribution of the market reflects the global adoption of wind energy, with North America, Europe, and Asia-Pacific representing major revenue contributors. However, emerging markets in regions like South America and the Middle East and Africa are also showing promising growth potential, presenting opportunities for market expansion and diversification for MRO providers. The forecast period indicates sustained high growth, influenced by the factors mentioned above, promising significant opportunities for businesses operating within the wind turbine MRO sector.
Wind Turbine MRO Industry Report: 2019-2033 Forecast
This comprehensive report provides an in-depth analysis of the Wind Turbine MRO (Maintenance, Repair, and Overhaul) industry, offering invaluable insights for industry professionals, investors, and strategic decision-makers. With a focus on market trends, key players, and future growth opportunities, this report covers the period from 2019 to 2033, with a base year of 2025 and a forecast period spanning 2025-2033. The total market size in 2025 is estimated at $XX Million.
Wind Turbine MRO Industry Market Structure & Innovation Trends
This section analyzes the competitive landscape, innovation drivers, and regulatory environment of the Wind Turbine MRO market. The market is characterized by a moderate level of concentration, with key players such as ABB Ltd, Vestas Wind Systems A/S, Siemens Gamesa Renewable Energy SA, and General Electric Company holding significant market share. However, numerous smaller specialized firms also contribute to the market. The industry is witnessing substantial innovation driven by advancements in digital technologies, predictive maintenance, and the development of more efficient and durable components. Regulatory frameworks, particularly those related to safety and environmental compliance, play a significant role in shaping market dynamics. Mergers and acquisitions (M&A) activity is notable; recent deal values have ranged from $XX Million to $XXX Million, reflecting consolidation within the sector and a focus on expanding service capabilities. The ongoing shift towards larger, offshore wind farms is also a key influence, demanding specialized MRO services.
- Market Concentration: Moderate, with several major players and numerous smaller firms.
- Innovation Drivers: Digitalization, predictive maintenance, advanced materials.
- Regulatory Frameworks: Safety standards, environmental regulations.
- M&A Activity: Significant, with deal values ranging from $XX Million to $XXX Million.
- Market Share (2025 Estimate): ABB Ltd (XX%), Vestas Wind Systems A/S (XX%), Siemens Gamesa Renewable Energy SA (XX%), General Electric Company (XX%), Others (XX%).
Wind Turbine MRO Industry Market Dynamics & Trends
The global Wind Turbine MRO market is experiencing robust growth, driven by the increasing global installed capacity of wind turbines, the aging fleet requiring increased maintenance, and the rising adoption of offshore wind energy. The market's Compound Annual Growth Rate (CAGR) is projected to be XX% during the forecast period (2025-2033). Technological advancements, such as remote diagnostics and AI-powered predictive maintenance, are improving operational efficiency and reducing downtime. Consumer preferences are increasingly shifting towards more sustainable energy sources, further bolstering market demand. Competitive dynamics are shaped by factors such as technological innovation, service quality, geographic reach, and pricing strategies. Market penetration of advanced MRO services, such as remote monitoring and predictive maintenance, is growing steadily, increasing from XX% in 2025 to XX% by 2033.
Dominant Regions & Segments in Wind Turbine MRO Industry
The Wind Turbine MRO market shows significant regional variations. Europe currently holds a dominant position, driven by strong government support for renewable energy, well-established wind energy infrastructure, and a large existing wind turbine fleet. Within Europe, countries like Germany, Denmark, and the UK are leading markets. North America and Asia are also exhibiting substantial growth, fueled by increased investments in wind energy projects and expanding energy demands.
Key Drivers:
- Europe: Strong government policies, established infrastructure, large installed base.
- North America: Growing renewable energy targets, significant offshore wind potential.
- Asia: Rapid economic growth, rising energy consumption, supportive government initiatives.
Segment Dominance:
- Service Type: Maintenance accounts for the largest share, followed by Repair and Overhaul.
- Component: Gearboxes and generators represent significant segments due to their complexity and high failure rates. Rotor blades are also a growing segment.
- Location of Deployment: Onshore installations currently dominate, although offshore is rapidly gaining traction.
Detailed analysis of each segment’s dominance is provided within the complete report.
Wind Turbine MRO Industry Product Innovations
Significant innovations are transforming the Wind Turbine MRO landscape. These include advanced diagnostic tools leveraging AI and machine learning for predictive maintenance, drone-based inspections for enhanced safety and efficiency, and the development of more robust and durable components with extended lifespans. These innovations are improving operational efficiency, reducing maintenance costs, and minimizing downtime, increasing the overall competitiveness of service providers. The market is witnessing a shift towards integrated service solutions offering comprehensive MRO packages to wind farm operators.
Report Scope & Segmentation Analysis
This report segments the Wind Turbine MRO market by Service Type (Maintenance, Repair, Overhaul), Component (Gearbox, Generators, Rotor Blades, Other Components), and Location of Deployment (Onshore, Offshore). Each segment provides comprehensive analysis of market size, growth projections, and competitive dynamics. Growth projections for each segment vary depending on the factors such as technological advancements, government policies, and market demand.
Key Drivers of Wind Turbine MRO Industry Growth
Several key factors are driving the expansion of the Wind Turbine MRO market. The escalating global adoption of wind energy to meet renewable energy targets is a primary driver. The increasing age of existing wind turbine fleets necessitates more frequent and extensive maintenance. Technological advancements, such as digitalization and predictive maintenance, are enhancing operational efficiency and reducing downtime, further fueling market demand. Government policies promoting renewable energy and providing financial incentives also contribute significantly to market growth. Moreover, the shift towards larger, offshore wind farms presents substantial growth opportunities for specialized MRO services.
Challenges in the Wind Turbine MRO Industry Sector
Despite the positive outlook, several challenges hinder market growth. These include the high cost of specialized equipment and skilled labor, the logistical complexities associated with offshore wind farm maintenance, and the potential for supply chain disruptions. Regulatory hurdles and stringent safety requirements can also pose significant challenges to service providers. The variability in weather conditions and remote location of some installations impact efficiency and costs. These challenges create pressure on profitability margins.
Emerging Opportunities in Wind Turbine MRO Industry
The Wind Turbine MRO market presents several promising opportunities. The expanding offshore wind energy sector creates significant growth potential for specialized MRO services. The increasing adoption of digital technologies and predictive maintenance offers opportunities for innovation and improved operational efficiency. The growth of the circular economy and the increasing demand for component refurbishment also present market opportunities. New markets in developing economies present significant expansion prospects.
Leading Players in the Wind Turbine MRO Industry Market
- ABB Ltd
- Vestas Wind Systems A/S
- Integrated Power Services LLC
- Siemens Gamesa Renewable Energy SA
- Mistras Group
- Moventas Gears Oy
- Suzlon Energy Ltd
- Dana SAC UK Ltd
- General Electric Company
- Nordex SE
- Stork (a Fluor Company)
- ZF Friedrichshafen AG
Key Developments in Wind Turbine MRO Industry
- February 2021: Siemens Gamesa Renewable Energy secured a long-term O&M contract extension for the 600 MW Gemini offshore wind farm, highlighting the growing importance of long-term service agreements.
- May 2021: GE Renewable Energy secured a 15-year O&M contract for an 88 MW wind farm in Vietnam, demonstrating the increasing demand for comprehensive service packages.
Future Outlook for Wind Turbine MRO Industry Market
The Wind Turbine MRO market is poised for continued growth, driven by the expanding global wind energy capacity, the aging wind turbine fleet, and the increasing adoption of offshore wind energy. Strategic investments in technological innovation, expansion into new markets, and the development of comprehensive service offerings will be crucial for success. The increasing focus on sustainability and the circular economy will further shape market dynamics. The market is expected to witness a significant increase in the demand for advanced MRO services, such as predictive maintenance and remote diagnostics.
Wind Turbine MRO Industry Segmentation
-
1. Location of Deployment
- 1.1. Onshore
- 1.2. Offshore
-
2. Service Type
- 2.1. Maintenance
- 2.2. Repair
- 2.3. Overhaul
-
3. Component
- 3.1. Gearbox
- 3.2. Generators
- 3.3. Rotor Blades
- 3.4. Other Components
Wind Turbine MRO Industry Segmentation By Geography
- 1. North America
- 2. Europe
- 3. Asia Pacific
- 4. South America
- 5. Middle East and Africa
Wind Turbine MRO Industry REPORT HIGHLIGHTS
| Aspects | Details |
|---|---|
| Study Period | 2019-2033 |
| Base Year | 2024 |
| Estimated Year | 2025 |
| Forecast Period | 2025-2033 |
| Historical Period | 2019-2024 |
| Growth Rate | CAGR of 15.86% from 2019-2033 |
| Segmentation |
|
Table of Contents
- 1. Introduction
- 1.1. Research Scope
- 1.2. Market Segmentation
- 1.3. Research Methodology
- 1.4. Definitions and Assumptions
- 2. Executive Summary
- 2.1. Introduction
- 3. Market Dynamics
- 3.1. Introduction
- 3.2. Market Drivers
- 3.2.1. 4.; Growing Environmental Concerns4.; Supportive Government Policies
- 3.3. Market Restrains
- 3.3.1. 4.; High Initial Capital Investment
- 3.4. Market Trends
- 3.4.1. Offshore Wind Installations Expected to Witness Signifcant Growth
- 4. Market Factor Analysis
- 4.1. Porters Five Forces
- 4.2. Supply/Value Chain
- 4.3. PESTEL analysis
- 4.4. Market Entropy
- 4.5. Patent/Trademark Analysis
- 5. Global Wind Turbine MRO Industry Analysis, Insights and Forecast, 2019-2031
- 5.1. Market Analysis, Insights and Forecast - by Location of Deployment
- 5.1.1. Onshore
- 5.1.2. Offshore
- 5.2. Market Analysis, Insights and Forecast - by Service Type
- 5.2.1. Maintenance
- 5.2.2. Repair
- 5.2.3. Overhaul
- 5.3. Market Analysis, Insights and Forecast - by Component
- 5.3.1. Gearbox
- 5.3.2. Generators
- 5.3.3. Rotor Blades
- 5.3.4. Other Components
- 5.4. Market Analysis, Insights and Forecast - by Region
- 5.4.1. North America
- 5.4.2. Europe
- 5.4.3. Asia Pacific
- 5.4.4. South America
- 5.4.5. Middle East and Africa
- 5.1. Market Analysis, Insights and Forecast - by Location of Deployment
- 6. North America Wind Turbine MRO Industry Analysis, Insights and Forecast, 2019-2031
- 6.1. Market Analysis, Insights and Forecast - by Location of Deployment
- 6.1.1. Onshore
- 6.1.2. Offshore
- 6.2. Market Analysis, Insights and Forecast - by Service Type
- 6.2.1. Maintenance
- 6.2.2. Repair
- 6.2.3. Overhaul
- 6.3. Market Analysis, Insights and Forecast - by Component
- 6.3.1. Gearbox
- 6.3.2. Generators
- 6.3.3. Rotor Blades
- 6.3.4. Other Components
- 6.1. Market Analysis, Insights and Forecast - by Location of Deployment
- 7. Europe Wind Turbine MRO Industry Analysis, Insights and Forecast, 2019-2031
- 7.1. Market Analysis, Insights and Forecast - by Location of Deployment
- 7.1.1. Onshore
- 7.1.2. Offshore
- 7.2. Market Analysis, Insights and Forecast - by Service Type
- 7.2.1. Maintenance
- 7.2.2. Repair
- 7.2.3. Overhaul
- 7.3. Market Analysis, Insights and Forecast - by Component
- 7.3.1. Gearbox
- 7.3.2. Generators
- 7.3.3. Rotor Blades
- 7.3.4. Other Components
- 7.1. Market Analysis, Insights and Forecast - by Location of Deployment
- 8. Asia Pacific Wind Turbine MRO Industry Analysis, Insights and Forecast, 2019-2031
- 8.1. Market Analysis, Insights and Forecast - by Location of Deployment
- 8.1.1. Onshore
- 8.1.2. Offshore
- 8.2. Market Analysis, Insights and Forecast - by Service Type
- 8.2.1. Maintenance
- 8.2.2. Repair
- 8.2.3. Overhaul
- 8.3. Market Analysis, Insights and Forecast - by Component
- 8.3.1. Gearbox
- 8.3.2. Generators
- 8.3.3. Rotor Blades
- 8.3.4. Other Components
- 8.1. Market Analysis, Insights and Forecast - by Location of Deployment
- 9. South America Wind Turbine MRO Industry Analysis, Insights and Forecast, 2019-2031
- 9.1. Market Analysis, Insights and Forecast - by Location of Deployment
- 9.1.1. Onshore
- 9.1.2. Offshore
- 9.2. Market Analysis, Insights and Forecast - by Service Type
- 9.2.1. Maintenance
- 9.2.2. Repair
- 9.2.3. Overhaul
- 9.3. Market Analysis, Insights and Forecast - by Component
- 9.3.1. Gearbox
- 9.3.2. Generators
- 9.3.3. Rotor Blades
- 9.3.4. Other Components
- 9.1. Market Analysis, Insights and Forecast - by Location of Deployment
- 10. Middle East and Africa Wind Turbine MRO Industry Analysis, Insights and Forecast, 2019-2031
- 10.1. Market Analysis, Insights and Forecast - by Location of Deployment
- 10.1.1. Onshore
- 10.1.2. Offshore
- 10.2. Market Analysis, Insights and Forecast - by Service Type
- 10.2.1. Maintenance
- 10.2.2. Repair
- 10.2.3. Overhaul
- 10.3. Market Analysis, Insights and Forecast - by Component
- 10.3.1. Gearbox
- 10.3.2. Generators
- 10.3.3. Rotor Blades
- 10.3.4. Other Components
- 10.1. Market Analysis, Insights and Forecast - by Location of Deployment
- 11. North America Wind Turbine MRO Industry Analysis, Insights and Forecast, 2019-2031
- 11.1. Market Analysis, Insights and Forecast - By Country/Sub-region
- 11.1.1 United States
- 11.1.2 Canada
- 11.1.3 Mexico
- 12. Europe Wind Turbine MRO Industry Analysis, Insights and Forecast, 2019-2031
- 12.1. Market Analysis, Insights and Forecast - By Country/Sub-region
- 12.1.1 Germany
- 12.1.2 United Kingdom
- 12.1.3 France
- 12.1.4 Spain
- 12.1.5 Italy
- 12.1.6 Spain
- 12.1.7 Belgium
- 12.1.8 Netherland
- 12.1.9 Nordics
- 12.1.10 Rest of Europe
- 13. Asia Pacific Wind Turbine MRO Industry Analysis, Insights and Forecast, 2019-2031
- 13.1. Market Analysis, Insights and Forecast - By Country/Sub-region
- 13.1.1 China
- 13.1.2 Japan
- 13.1.3 India
- 13.1.4 South Korea
- 13.1.5 Southeast Asia
- 13.1.6 Australia
- 13.1.7 Indonesia
- 13.1.8 Phillipes
- 13.1.9 Singapore
- 13.1.10 Thailandc
- 13.1.11 Rest of Asia Pacific
- 14. South America Wind Turbine MRO Industry Analysis, Insights and Forecast, 2019-2031
- 14.1. Market Analysis, Insights and Forecast - By Country/Sub-region
- 14.1.1 Brazil
- 14.1.2 Argentina
- 14.1.3 Peru
- 14.1.4 Chile
- 14.1.5 Colombia
- 14.1.6 Ecuador
- 14.1.7 Venezuela
- 14.1.8 Rest of South America
- 15. North America Wind Turbine MRO Industry Analysis, Insights and Forecast, 2019-2031
- 15.1. Market Analysis, Insights and Forecast - By Country/Sub-region
- 15.1.1 United States
- 15.1.2 Canada
- 15.1.3 Mexico
- 16. MEA Wind Turbine MRO Industry Analysis, Insights and Forecast, 2019-2031
- 16.1. Market Analysis, Insights and Forecast - By Country/Sub-region
- 16.1.1 United Arab Emirates
- 16.1.2 Saudi Arabia
- 16.1.3 South Africa
- 16.1.4 Rest of Middle East and Africa
- 17. Competitive Analysis
- 17.1. Global Market Share Analysis 2024
- 17.2. Company Profiles
- 17.2.1 ABB Ltd
- 17.2.1.1. Overview
- 17.2.1.2. Products
- 17.2.1.3. SWOT Analysis
- 17.2.1.4. Recent Developments
- 17.2.1.5. Financials (Based on Availability)
- 17.2.2 Vestas Wind Systems A/S
- 17.2.2.1. Overview
- 17.2.2.2. Products
- 17.2.2.3. SWOT Analysis
- 17.2.2.4. Recent Developments
- 17.2.2.5. Financials (Based on Availability)
- 17.2.3 Integrated Power Services LLC*List Not Exhaustive
- 17.2.3.1. Overview
- 17.2.3.2. Products
- 17.2.3.3. SWOT Analysis
- 17.2.3.4. Recent Developments
- 17.2.3.5. Financials (Based on Availability)
- 17.2.4 Siemens Gamesa Renewable Energy SA
- 17.2.4.1. Overview
- 17.2.4.2. Products
- 17.2.4.3. SWOT Analysis
- 17.2.4.4. Recent Developments
- 17.2.4.5. Financials (Based on Availability)
- 17.2.5 Mistras Group
- 17.2.5.1. Overview
- 17.2.5.2. Products
- 17.2.5.3. SWOT Analysis
- 17.2.5.4. Recent Developments
- 17.2.5.5. Financials (Based on Availability)
- 17.2.6 Moventas Gears Oy
- 17.2.6.1. Overview
- 17.2.6.2. Products
- 17.2.6.3. SWOT Analysis
- 17.2.6.4. Recent Developments
- 17.2.6.5. Financials (Based on Availability)
- 17.2.7 Suzlon Energy Ltd
- 17.2.7.1. Overview
- 17.2.7.2. Products
- 17.2.7.3. SWOT Analysis
- 17.2.7.4. Recent Developments
- 17.2.7.5. Financials (Based on Availability)
- 17.2.8 Dana SAC UK Ltd
- 17.2.8.1. Overview
- 17.2.8.2. Products
- 17.2.8.3. SWOT Analysis
- 17.2.8.4. Recent Developments
- 17.2.8.5. Financials (Based on Availability)
- 17.2.9 General Electric Company
- 17.2.9.1. Overview
- 17.2.9.2. Products
- 17.2.9.3. SWOT Analysis
- 17.2.9.4. Recent Developments
- 17.2.9.5. Financials (Based on Availability)
- 17.2.10 Nordex SE
- 17.2.10.1. Overview
- 17.2.10.2. Products
- 17.2.10.3. SWOT Analysis
- 17.2.10.4. Recent Developments
- 17.2.10.5. Financials (Based on Availability)
- 17.2.11 Stork (a Fluor Company)
- 17.2.11.1. Overview
- 17.2.11.2. Products
- 17.2.11.3. SWOT Analysis
- 17.2.11.4. Recent Developments
- 17.2.11.5. Financials (Based on Availability)
- 17.2.12 ZF Friedrichshafen AG
- 17.2.12.1. Overview
- 17.2.12.2. Products
- 17.2.12.3. SWOT Analysis
- 17.2.12.4. Recent Developments
- 17.2.12.5. Financials (Based on Availability)
- 17.2.1 ABB Ltd
List of Figures
- Figure 1: Global Wind Turbine MRO Industry Revenue Breakdown (Million, %) by Region 2024 & 2032
- Figure 2: North America Wind Turbine MRO Industry Revenue (Million), by Country 2024 & 2032
- Figure 3: North America Wind Turbine MRO Industry Revenue Share (%), by Country 2024 & 2032
- Figure 4: Europe Wind Turbine MRO Industry Revenue (Million), by Country 2024 & 2032
- Figure 5: Europe Wind Turbine MRO Industry Revenue Share (%), by Country 2024 & 2032
- Figure 6: Asia Pacific Wind Turbine MRO Industry Revenue (Million), by Country 2024 & 2032
- Figure 7: Asia Pacific Wind Turbine MRO Industry Revenue Share (%), by Country 2024 & 2032
- Figure 8: South America Wind Turbine MRO Industry Revenue (Million), by Country 2024 & 2032
- Figure 9: South America Wind Turbine MRO Industry Revenue Share (%), by Country 2024 & 2032
- Figure 10: North America Wind Turbine MRO Industry Revenue (Million), by Country 2024 & 2032
- Figure 11: North America Wind Turbine MRO Industry Revenue Share (%), by Country 2024 & 2032
- Figure 12: MEA Wind Turbine MRO Industry Revenue (Million), by Country 2024 & 2032
- Figure 13: MEA Wind Turbine MRO Industry Revenue Share (%), by Country 2024 & 2032
- Figure 14: North America Wind Turbine MRO Industry Revenue (Million), by Location of Deployment 2024 & 2032
- Figure 15: North America Wind Turbine MRO Industry Revenue Share (%), by Location of Deployment 2024 & 2032
- Figure 16: North America Wind Turbine MRO Industry Revenue (Million), by Service Type 2024 & 2032
- Figure 17: North America Wind Turbine MRO Industry Revenue Share (%), by Service Type 2024 & 2032
- Figure 18: North America Wind Turbine MRO Industry Revenue (Million), by Component 2024 & 2032
- Figure 19: North America Wind Turbine MRO Industry Revenue Share (%), by Component 2024 & 2032
- Figure 20: North America Wind Turbine MRO Industry Revenue (Million), by Country 2024 & 2032
- Figure 21: North America Wind Turbine MRO Industry Revenue Share (%), by Country 2024 & 2032
- Figure 22: Europe Wind Turbine MRO Industry Revenue (Million), by Location of Deployment 2024 & 2032
- Figure 23: Europe Wind Turbine MRO Industry Revenue Share (%), by Location of Deployment 2024 & 2032
- Figure 24: Europe Wind Turbine MRO Industry Revenue (Million), by Service Type 2024 & 2032
- Figure 25: Europe Wind Turbine MRO Industry Revenue Share (%), by Service Type 2024 & 2032
- Figure 26: Europe Wind Turbine MRO Industry Revenue (Million), by Component 2024 & 2032
- Figure 27: Europe Wind Turbine MRO Industry Revenue Share (%), by Component 2024 & 2032
- Figure 28: Europe Wind Turbine MRO Industry Revenue (Million), by Country 2024 & 2032
- Figure 29: Europe Wind Turbine MRO Industry Revenue Share (%), by Country 2024 & 2032
- Figure 30: Asia Pacific Wind Turbine MRO Industry Revenue (Million), by Location of Deployment 2024 & 2032
- Figure 31: Asia Pacific Wind Turbine MRO Industry Revenue Share (%), by Location of Deployment 2024 & 2032
- Figure 32: Asia Pacific Wind Turbine MRO Industry Revenue (Million), by Service Type 2024 & 2032
- Figure 33: Asia Pacific Wind Turbine MRO Industry Revenue Share (%), by Service Type 2024 & 2032
- Figure 34: Asia Pacific Wind Turbine MRO Industry Revenue (Million), by Component 2024 & 2032
- Figure 35: Asia Pacific Wind Turbine MRO Industry Revenue Share (%), by Component 2024 & 2032
- Figure 36: Asia Pacific Wind Turbine MRO Industry Revenue (Million), by Country 2024 & 2032
- Figure 37: Asia Pacific Wind Turbine MRO Industry Revenue Share (%), by Country 2024 & 2032
- Figure 38: South America Wind Turbine MRO Industry Revenue (Million), by Location of Deployment 2024 & 2032
- Figure 39: South America Wind Turbine MRO Industry Revenue Share (%), by Location of Deployment 2024 & 2032
- Figure 40: South America Wind Turbine MRO Industry Revenue (Million), by Service Type 2024 & 2032
- Figure 41: South America Wind Turbine MRO Industry Revenue Share (%), by Service Type 2024 & 2032
- Figure 42: South America Wind Turbine MRO Industry Revenue (Million), by Component 2024 & 2032
- Figure 43: South America Wind Turbine MRO Industry Revenue Share (%), by Component 2024 & 2032
- Figure 44: South America Wind Turbine MRO Industry Revenue (Million), by Country 2024 & 2032
- Figure 45: South America Wind Turbine MRO Industry Revenue Share (%), by Country 2024 & 2032
- Figure 46: Middle East and Africa Wind Turbine MRO Industry Revenue (Million), by Location of Deployment 2024 & 2032
- Figure 47: Middle East and Africa Wind Turbine MRO Industry Revenue Share (%), by Location of Deployment 2024 & 2032
- Figure 48: Middle East and Africa Wind Turbine MRO Industry Revenue (Million), by Service Type 2024 & 2032
- Figure 49: Middle East and Africa Wind Turbine MRO Industry Revenue Share (%), by Service Type 2024 & 2032
- Figure 50: Middle East and Africa Wind Turbine MRO Industry Revenue (Million), by Component 2024 & 2032
- Figure 51: Middle East and Africa Wind Turbine MRO Industry Revenue Share (%), by Component 2024 & 2032
- Figure 52: Middle East and Africa Wind Turbine MRO Industry Revenue (Million), by Country 2024 & 2032
- Figure 53: Middle East and Africa Wind Turbine MRO Industry Revenue Share (%), by Country 2024 & 2032
List of Tables
- Table 1: Global Wind Turbine MRO Industry Revenue Million Forecast, by Region 2019 & 2032
- Table 2: Global Wind Turbine MRO Industry Revenue Million Forecast, by Location of Deployment 2019 & 2032
- Table 3: Global Wind Turbine MRO Industry Revenue Million Forecast, by Service Type 2019 & 2032
- Table 4: Global Wind Turbine MRO Industry Revenue Million Forecast, by Component 2019 & 2032
- Table 5: Global Wind Turbine MRO Industry Revenue Million Forecast, by Region 2019 & 2032
- Table 6: Global Wind Turbine MRO Industry Revenue Million Forecast, by Country 2019 & 2032
- Table 7: United States Wind Turbine MRO Industry Revenue (Million) Forecast, by Application 2019 & 2032
- Table 8: Canada Wind Turbine MRO Industry Revenue (Million) Forecast, by Application 2019 & 2032
- Table 9: Mexico Wind Turbine MRO Industry Revenue (Million) Forecast, by Application 2019 & 2032
- Table 10: Global Wind Turbine MRO Industry Revenue Million Forecast, by Country 2019 & 2032
- Table 11: Germany Wind Turbine MRO Industry Revenue (Million) Forecast, by Application 2019 & 2032
- Table 12: United Kingdom Wind Turbine MRO Industry Revenue (Million) Forecast, by Application 2019 & 2032
- Table 13: France Wind Turbine MRO Industry Revenue (Million) Forecast, by Application 2019 & 2032
- Table 14: Spain Wind Turbine MRO Industry Revenue (Million) Forecast, by Application 2019 & 2032
- Table 15: Italy Wind Turbine MRO Industry Revenue (Million) Forecast, by Application 2019 & 2032
- Table 16: Spain Wind Turbine MRO Industry Revenue (Million) Forecast, by Application 2019 & 2032
- Table 17: Belgium Wind Turbine MRO Industry Revenue (Million) Forecast, by Application 2019 & 2032
- Table 18: Netherland Wind Turbine MRO Industry Revenue (Million) Forecast, by Application 2019 & 2032
- Table 19: Nordics Wind Turbine MRO Industry Revenue (Million) Forecast, by Application 2019 & 2032
- Table 20: Rest of Europe Wind Turbine MRO Industry Revenue (Million) Forecast, by Application 2019 & 2032
- Table 21: Global Wind Turbine MRO Industry Revenue Million Forecast, by Country 2019 & 2032
- Table 22: China Wind Turbine MRO Industry Revenue (Million) Forecast, by Application 2019 & 2032
- Table 23: Japan Wind Turbine MRO Industry Revenue (Million) Forecast, by Application 2019 & 2032
- Table 24: India Wind Turbine MRO Industry Revenue (Million) Forecast, by Application 2019 & 2032
- Table 25: South Korea Wind Turbine MRO Industry Revenue (Million) Forecast, by Application 2019 & 2032
- Table 26: Southeast Asia Wind Turbine MRO Industry Revenue (Million) Forecast, by Application 2019 & 2032
- Table 27: Australia Wind Turbine MRO Industry Revenue (Million) Forecast, by Application 2019 & 2032
- Table 28: Indonesia Wind Turbine MRO Industry Revenue (Million) Forecast, by Application 2019 & 2032
- Table 29: Phillipes Wind Turbine MRO Industry Revenue (Million) Forecast, by Application 2019 & 2032
- Table 30: Singapore Wind Turbine MRO Industry Revenue (Million) Forecast, by Application 2019 & 2032
- Table 31: Thailandc Wind Turbine MRO Industry Revenue (Million) Forecast, by Application 2019 & 2032
- Table 32: Rest of Asia Pacific Wind Turbine MRO Industry Revenue (Million) Forecast, by Application 2019 & 2032
- Table 33: Global Wind Turbine MRO Industry Revenue Million Forecast, by Country 2019 & 2032
- Table 34: Brazil Wind Turbine MRO Industry Revenue (Million) Forecast, by Application 2019 & 2032
- Table 35: Argentina Wind Turbine MRO Industry Revenue (Million) Forecast, by Application 2019 & 2032
- Table 36: Peru Wind Turbine MRO Industry Revenue (Million) Forecast, by Application 2019 & 2032
- Table 37: Chile Wind Turbine MRO Industry Revenue (Million) Forecast, by Application 2019 & 2032
- Table 38: Colombia Wind Turbine MRO Industry Revenue (Million) Forecast, by Application 2019 & 2032
- Table 39: Ecuador Wind Turbine MRO Industry Revenue (Million) Forecast, by Application 2019 & 2032
- Table 40: Venezuela Wind Turbine MRO Industry Revenue (Million) Forecast, by Application 2019 & 2032
- Table 41: Rest of South America Wind Turbine MRO Industry Revenue (Million) Forecast, by Application 2019 & 2032
- Table 42: Global Wind Turbine MRO Industry Revenue Million Forecast, by Country 2019 & 2032
- Table 43: United States Wind Turbine MRO Industry Revenue (Million) Forecast, by Application 2019 & 2032
- Table 44: Canada Wind Turbine MRO Industry Revenue (Million) Forecast, by Application 2019 & 2032
- Table 45: Mexico Wind Turbine MRO Industry Revenue (Million) Forecast, by Application 2019 & 2032
- Table 46: Global Wind Turbine MRO Industry Revenue Million Forecast, by Country 2019 & 2032
- Table 47: United Arab Emirates Wind Turbine MRO Industry Revenue (Million) Forecast, by Application 2019 & 2032
- Table 48: Saudi Arabia Wind Turbine MRO Industry Revenue (Million) Forecast, by Application 2019 & 2032
- Table 49: South Africa Wind Turbine MRO Industry Revenue (Million) Forecast, by Application 2019 & 2032
- Table 50: Rest of Middle East and Africa Wind Turbine MRO Industry Revenue (Million) Forecast, by Application 2019 & 2032
- Table 51: Global Wind Turbine MRO Industry Revenue Million Forecast, by Location of Deployment 2019 & 2032
- Table 52: Global Wind Turbine MRO Industry Revenue Million Forecast, by Service Type 2019 & 2032
- Table 53: Global Wind Turbine MRO Industry Revenue Million Forecast, by Component 2019 & 2032
- Table 54: Global Wind Turbine MRO Industry Revenue Million Forecast, by Country 2019 & 2032
- Table 55: Global Wind Turbine MRO Industry Revenue Million Forecast, by Location of Deployment 2019 & 2032
- Table 56: Global Wind Turbine MRO Industry Revenue Million Forecast, by Service Type 2019 & 2032
- Table 57: Global Wind Turbine MRO Industry Revenue Million Forecast, by Component 2019 & 2032
- Table 58: Global Wind Turbine MRO Industry Revenue Million Forecast, by Country 2019 & 2032
- Table 59: Global Wind Turbine MRO Industry Revenue Million Forecast, by Location of Deployment 2019 & 2032
- Table 60: Global Wind Turbine MRO Industry Revenue Million Forecast, by Service Type 2019 & 2032
- Table 61: Global Wind Turbine MRO Industry Revenue Million Forecast, by Component 2019 & 2032
- Table 62: Global Wind Turbine MRO Industry Revenue Million Forecast, by Country 2019 & 2032
- Table 63: Global Wind Turbine MRO Industry Revenue Million Forecast, by Location of Deployment 2019 & 2032
- Table 64: Global Wind Turbine MRO Industry Revenue Million Forecast, by Service Type 2019 & 2032
- Table 65: Global Wind Turbine MRO Industry Revenue Million Forecast, by Component 2019 & 2032
- Table 66: Global Wind Turbine MRO Industry Revenue Million Forecast, by Country 2019 & 2032
- Table 67: Global Wind Turbine MRO Industry Revenue Million Forecast, by Location of Deployment 2019 & 2032
- Table 68: Global Wind Turbine MRO Industry Revenue Million Forecast, by Service Type 2019 & 2032
- Table 69: Global Wind Turbine MRO Industry Revenue Million Forecast, by Component 2019 & 2032
- Table 70: Global Wind Turbine MRO Industry Revenue Million Forecast, by Country 2019 & 2032
Frequently Asked Questions
1. What is the projected Compound Annual Growth Rate (CAGR) of the Wind Turbine MRO Industry?
The projected CAGR is approximately 15.86%.
2. Which companies are prominent players in the Wind Turbine MRO Industry?
Key companies in the market include ABB Ltd, Vestas Wind Systems A/S, Integrated Power Services LLC*List Not Exhaustive, Siemens Gamesa Renewable Energy SA, Mistras Group, Moventas Gears Oy, Suzlon Energy Ltd, Dana SAC UK Ltd, General Electric Company, Nordex SE, Stork (a Fluor Company), ZF Friedrichshafen AG.
3. What are the main segments of the Wind Turbine MRO Industry?
The market segments include Location of Deployment, Service Type, Component.
4. Can you provide details about the market size?
The market size is estimated to be USD XX Million as of 2022.
5. What are some drivers contributing to market growth?
4.; Growing Environmental Concerns4.; Supportive Government Policies.
6. What are the notable trends driving market growth?
Offshore Wind Installations Expected to Witness Signifcant Growth.
7. Are there any restraints impacting market growth?
4.; High Initial Capital Investment.
8. Can you provide examples of recent developments in the market?
In February 2021, Siemens Gamesa Renewable Energy signed an agreement with Gemini Consortium to extend the operation and maintenance service agreement for 600 MW Gemini's offshore wind energy farm in the Dutch North Sea until 2036. Furthermore, the original 15-year long-term plan (LTP) has been extended by five years and covers different upgrades and new services, providing more control over O&M.
9. What pricing options are available for accessing the report?
Pricing options include single-user, multi-user, and enterprise licenses priced at USD 4750, USD 5250, and USD 8750 respectively.
10. Is the market size provided in terms of value or volume?
The market size is provided in terms of value, measured in Million.
11. Are there any specific market keywords associated with the report?
Yes, the market keyword associated with the report is "Wind Turbine MRO Industry," which aids in identifying and referencing the specific market segment covered.
12. How do I determine which pricing option suits my needs best?
The pricing options vary based on user requirements and access needs. Individual users may opt for single-user licenses, while businesses requiring broader access may choose multi-user or enterprise licenses for cost-effective access to the report.
13. Are there any additional resources or data provided in the Wind Turbine MRO Industry report?
While the report offers comprehensive insights, it's advisable to review the specific contents or supplementary materials provided to ascertain if additional resources or data are available.
14. How can I stay updated on further developments or reports in the Wind Turbine MRO Industry?
To stay informed about further developments, trends, and reports in the Wind Turbine MRO Industry, consider subscribing to industry newsletters, following relevant companies and organizations, or regularly checking reputable industry news sources and publications.
Methodology
Step 1 - Identification of Relevant Samples Size from Population Database


Step 2 - Approaches for Defining Global Market Size (Value, Volume* & Price*)

Note*: In applicable scenarios
Step 3 - Data Sources
Primary Research
- Web Analytics
- Survey Reports
- Research Institute
- Latest Research Reports
- Opinion Leaders
Secondary Research
- Annual Reports
- White Paper
- Latest Press Release
- Industry Association
- Paid Database
- Investor Presentations

Step 4 - Data Triangulation
Involves using different sources of information in order to increase the validity of a study
These sources are likely to be stakeholders in a program - participants, other researchers, program staff, other community members, and so on.
Then we put all data in single framework & apply various statistical tools to find out the dynamic on the market.
During the analysis stage, feedback from the stakeholder groups would be compared to determine areas of agreement as well as areas of divergence


