
Key Insights
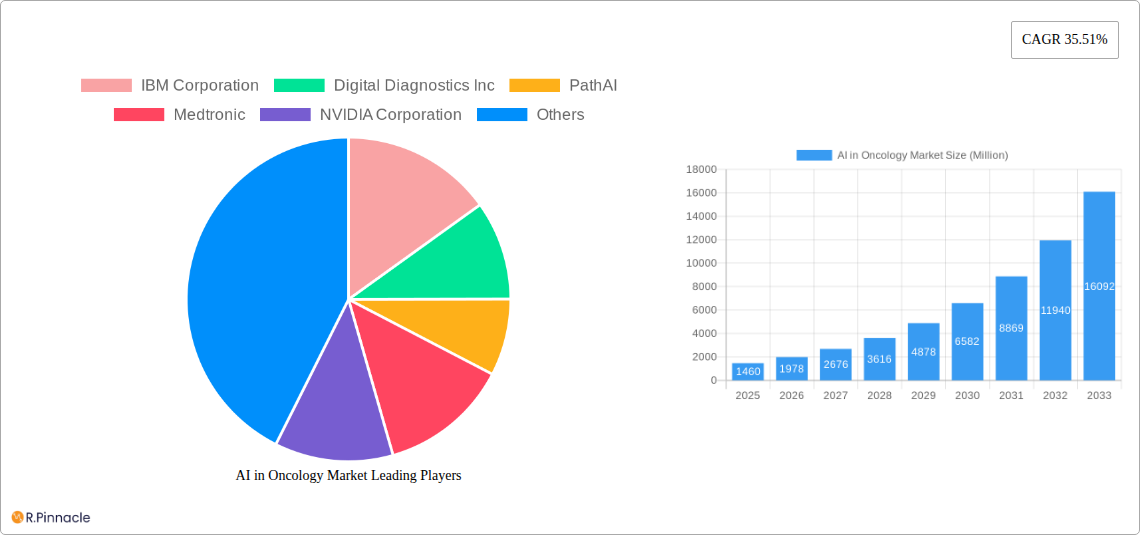
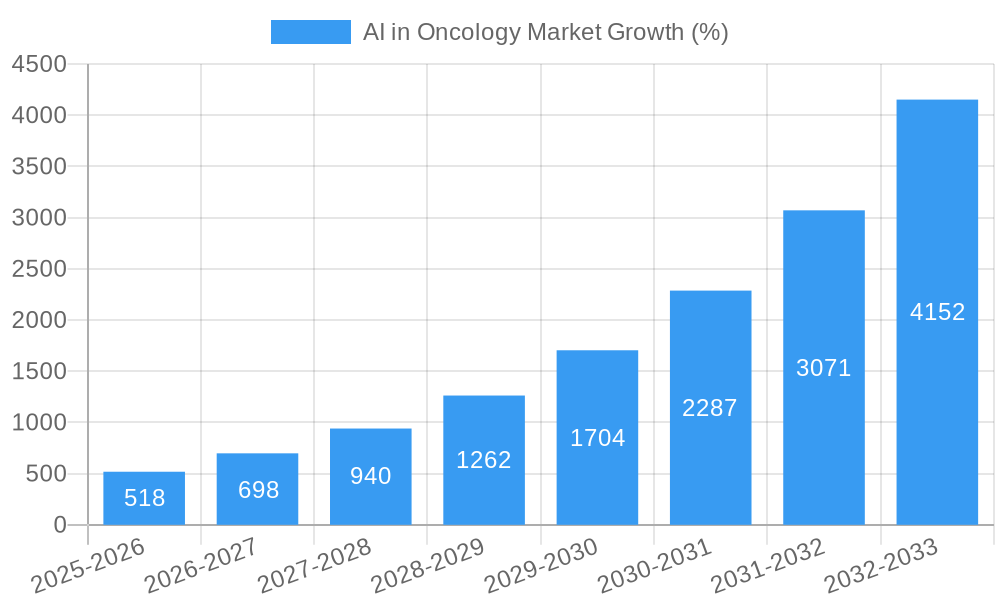
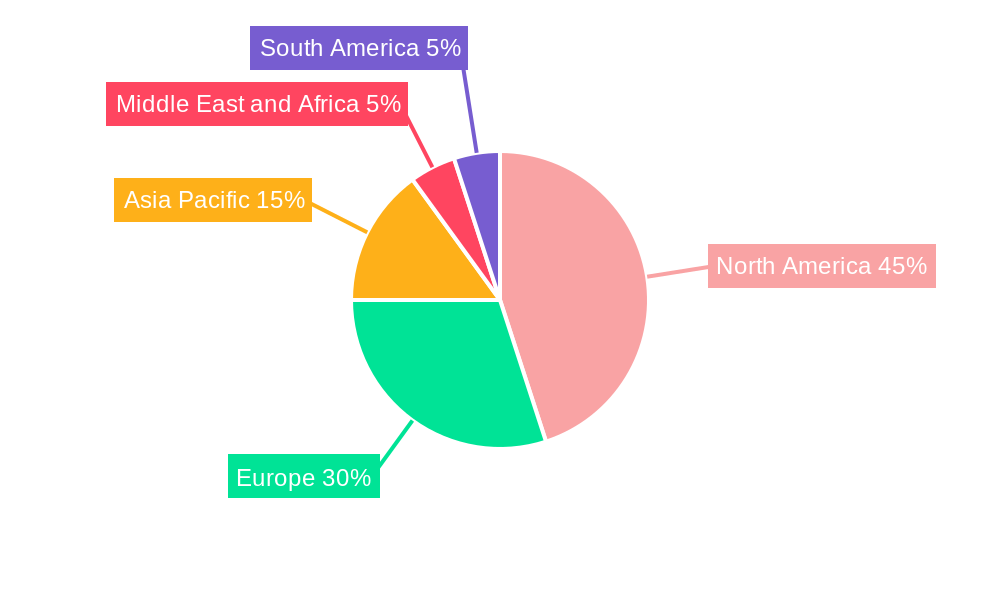
The AI in Oncology market is experiencing explosive growth, projected to reach $1.46 billion in 2025 and exhibiting a remarkable Compound Annual Growth Rate (CAGR) of 35.51% from 2025 to 2033. This surge is driven by several key factors. Firstly, the increasing prevalence of cancer globally fuels the demand for more accurate, efficient, and personalized treatment strategies. AI offers precisely this, enabling faster and more precise diagnostics through image analysis and genomic sequencing. Secondly, advancements in AI algorithms and computing power are continuously improving the accuracy and speed of AI-powered tools for cancer detection, drug discovery, and treatment optimization. Thirdly, the growing adoption of cloud-based solutions is facilitating wider accessibility and collaboration within the healthcare ecosystem, fostering innovation and accelerating the integration of AI in oncology workflows. The market is segmented across various components (software, hardware, services), cancer types (breast, lung, prostate, colorectal, brain, and others), treatment types (chemotherapy, radiotherapy, immunotherapy, and others), and applications (detection, drug discovery, development). Leading companies such as IBM, PathAI, Medtronic, NVIDIA, and GE Healthcare are actively shaping this market through continuous innovation and strategic partnerships. The North American market currently holds a significant share, driven by robust healthcare infrastructure and early adoption of advanced technologies. However, rapid growth is anticipated in the Asia-Pacific region, fueled by increasing healthcare expenditure and rising technological advancements.
The restraints on market growth include the high cost of AI-powered solutions, regulatory hurdles related to AI adoption in healthcare, and concerns regarding data privacy and security. Nevertheless, the potential benefits of AI in oncology – improved patient outcomes, reduced healthcare costs, and accelerated drug development – far outweigh these challenges. Ongoing research and development, coupled with increasing collaborations between technology companies and healthcare providers, will likely mitigate these restraints, paving the way for sustained, robust growth in the coming years. The focus is shifting towards personalized medicine, where AI plays a crucial role in tailoring treatment plans based on an individual's unique genetic profile and tumor characteristics. This personalized approach promises to significantly improve cancer treatment efficacy and survival rates. The market's future trajectory is strongly positive, indicating a transformative role for AI in revolutionizing cancer care.
This comprehensive report provides an in-depth analysis of the AI in Oncology market, covering market size, growth drivers, challenges, opportunities, and key players. The study period spans from 2019 to 2033, with 2025 as the base and estimated year, and a forecast period of 2025-2033. This report is essential for industry professionals, investors, and researchers seeking to understand and navigate this rapidly evolving market.
AI in Oncology Market Market Structure & Innovation Trends
The AI in Oncology market is characterized by a dynamic interplay of established players and emerging innovators. Market concentration is moderate, with several key players holding significant market share, but a considerable number of smaller companies contributing to innovation. The market share of the top 5 companies is estimated at xx%, while the remaining xx% is distributed among numerous smaller players. Innovation is primarily driven by advancements in deep learning, computer vision, and natural language processing, enabling more accurate and efficient cancer diagnosis, treatment planning, and drug discovery. Regulatory frameworks vary across geographies, influencing adoption rates and market access. Product substitutes are limited, though traditional diagnostic and treatment methods remain prevalent. The end-user demographic comprises oncologists, radiologists, pathologists, and other healthcare professionals. M&A activity has been significant, with deal values exceeding xx Million in the last 5 years. For example, the acquisition of [Company Name] by [Company Name] for xx Million in [Year] significantly impacted market dynamics. Several key strategic partnerships between technology companies and healthcare providers have also accelerated the pace of development.
AI in Oncology Market Market Dynamics & Trends
The AI in Oncology market is experiencing robust growth, driven by rising cancer prevalence, increasing demand for personalized medicine, and technological advancements. The market is projected to witness a CAGR of xx% during the forecast period (2025-2033), reaching a market value of xx Million by 2033. Market penetration is highest in developed nations, where access to advanced healthcare infrastructure and technological capabilities is higher. However, developing nations are also showing increased adoption, spurred by government initiatives and rising healthcare spending. Technological disruptions, particularly in the areas of genomics and imaging analysis, are continuously transforming the market landscape. Consumer preferences are shifting towards non-invasive diagnostic tools and personalized treatment plans, boosting demand for AI-powered solutions. The competitive dynamics are characterized by both intense competition among established players and the emergence of innovative start-ups. This dynamic environment fosters continuous innovation and ensures the development of more efficient and effective AI-driven solutions for oncology.
Dominant Regions & Segments in AI in Oncology Market
The North American region currently dominates the AI in Oncology market, driven by high healthcare spending, a strong regulatory framework, and the presence of leading technology and healthcare companies. However, the Asia-Pacific region is expected to exhibit significant growth in the coming years due to rising cancer incidence rates and increasing investments in healthcare infrastructure.
Key Drivers:
- High Healthcare Expenditure: The US, for example, has substantial investments in healthcare research and technology adoption.
- Favorable Regulatory Environment: Clear guidelines and regulatory pathways facilitate faster product approval and market entry.
- Technological Advancement: Continued innovation in AI and related fields keeps the market dynamic.
- Rising Cancer Prevalence: The global increase in cancer cases fuels the need for better diagnostics and treatment.
Dominant Segments:
- Component: Software solutions currently hold the largest market share, driven by the flexibility and scalability offered by AI software.
- Cancer Type: Breast cancer and lung cancer represent major segments due to their high incidence rates.
- Treatment Type: Immunotherapy is a rapidly growing segment due to its promise in personalized cancer treatment.
- Application: Cancer detection is the dominant application, owing to AI’s potential to improve early detection rates and precision diagnostics.
AI in Oncology Market Product Innovations
Recent product innovations in AI oncology include advanced imaging analysis tools that enhance the accuracy of cancer detection and treatment planning, and AI-powered drug discovery platforms that accelerate the development of novel cancer therapies. These innovations offer significant competitive advantages, such as improved diagnostic accuracy, personalized treatment approaches, and accelerated drug development timelines. The market is witnessing a shift towards cloud-based solutions, enhancing accessibility and scalability.
Report Scope & Segmentation Analysis
This report segments the AI in Oncology market based on Component (Software Solutions, Hardware, Services), Cancer Type (Breast Cancer, Lung Cancer, Prostate Cancer, Colorectal Cancer, Brain Tumor, Other Cancer Types), Treatment Type (Chemotherapy, Radiotherapy, Immunotherapy, Other Treatment Types), and Application (Cancer Detection, Drug Discovery, Drug Development, Other Applications). Each segment’s growth projections, market size, and competitive dynamics are thoroughly analyzed. For example, the Software Solutions segment is expected to experience significant growth, driven by the increasing adoption of AI-powered diagnostic and treatment planning tools. Similarly, the Breast Cancer segment is expected to remain a dominant market segment due to the high incidence rates of this cancer type.
Key Drivers of AI in Oncology Market Growth
The growth of the AI in Oncology market is primarily driven by technological advancements in AI and machine learning, coupled with increased healthcare spending and rising cancer prevalence. Government initiatives supporting AI research and development further fuel market expansion. The growing demand for personalized medicine, which relies heavily on AI for tailoring treatment plans, also contributes significantly to market growth. The development of improved algorithms and data analytics further enhances market traction.
Challenges in the AI in Oncology Market Sector
Challenges in the AI in Oncology market include the high cost of AI development and implementation, regulatory hurdles in obtaining approvals for new AI-based medical devices, and the need for large, high-quality datasets to train AI models effectively. Data privacy concerns and ethical considerations regarding the use of AI in healthcare also pose significant challenges. Furthermore, the competition among various established companies and start-ups creates a challenging market for new entrants.
Emerging Opportunities in AI in Oncology Market
Emerging opportunities include the expansion of AI applications into new areas of oncology, such as preventative care and survivorship, and the development of novel AI-based tools for personalized treatment selection. The increasing availability of large-scale genomic and imaging data will further stimulate innovation and development. Expansion into underserved markets globally will also present significant opportunities for market growth.
Leading Players in the AI in Oncology Market Market
- IBM Corporation
- Digital Diagnostics Inc
- PathAI
- Medtronic
- NVIDIA Corporation
- GE Healthcare
- Siemens Healthineers AG
- Azra AI
- Median Technologies Inc
- Intel Corporation
- ConcertAI LLC
Key Developments in AI in Oncology Market Industry
- September 2021: Owkin, Inc. and Cleveland Clinic researchers announced a deep-learning model predicting survival outcomes for hepatocellular carcinoma.
- August 2022: Medtronic launched the AI-powered GI Genius intelligent endoscopy module in India for colorectal cancer detection.
Future Outlook for AI in Oncology Market Market
The future outlook for the AI in Oncology market is exceptionally promising, with continued growth driven by technological advancements, increasing demand for personalized medicine, and rising investments in healthcare research. Strategic partnerships between technology companies and healthcare providers will play a crucial role in accelerating market expansion. The development of more sophisticated AI algorithms and the availability of larger datasets will further enhance the capabilities of AI-driven oncology solutions. The market is poised for significant growth, driven by advancements in data analytics, cloud computing, and deep learning.
AI in Oncology Market Segmentation
-
1. Component
- 1.1. Software Solutions
- 1.2. Hardware
- 1.3. Services
-
2. Cancer Type
- 2.1. Breast Cancer
- 2.2. Lung Cancer
- 2.3. Prostate Cancer
- 2.4. Colorectal Cancer
- 2.5. Brain Tumor
- 2.6. Other Cancer Types
-
3. Treatment Type
- 3.1. Chemotherapy
- 3.2. Radiotherapy
- 3.3. Immunotherapy
- 3.4. Other Treatment Types
-
4. Application
- 4.1. Cancer Detection
- 4.2. Drug Discovery
- 4.3. Drug Development
- 4.4. Other Applications
AI in Oncology Market Segmentation By Geography
-
1. North America
- 1.1. United States
- 1.2. Canada
- 1.3. Mexico
-
2. Europe
- 2.1. Germany
- 2.2. United Kingdom
- 2.3. France
- 2.4. Italy
- 2.5. Spain
- 2.6. Rest of Europe
-
3. Asia Pacific
- 3.1. China
- 3.2. Japan
- 3.3. India
- 3.4. Australia
- 3.5. South Korea
- 3.6. Rest of Asia Pacific
-
4. Middle East and Africa
- 4.1. GCC
- 4.2. South Africa
- 4.3. Rest of Middle East and Africa
-
5. South America
- 5.1. Brazil
- 5.2. Argentina
- 5.3. Rest of South America
AI in Oncology Market REPORT HIGHLIGHTS
| Aspects | Details |
|---|---|
| Study Period | 2019-2033 |
| Base Year | 2024 |
| Estimated Year | 2025 |
| Forecast Period | 2025-2033 |
| Historical Period | 2019-2024 |
| Growth Rate | CAGR of 35.51% from 2019-2033 |
| Segmentation |
|
Table of Contents
- 1. Introduction
- 1.1. Research Scope
- 1.2. Market Segmentation
- 1.3. Research Methodology
- 1.4. Definitions and Assumptions
- 2. Executive Summary
- 2.1. Introduction
- 3. Market Dynamics
- 3.1. Introduction
- 3.2. Market Drivers
- 3.2.1. Surging Advancements in Healthcare Infrastructure; Increasing Prevalence of Cancer; Rising Demand for Early and Accurate Diagnosis of Cancer
- 3.3. Market Restrains
- 3.3.1. High Initial Costs and Concerns over the Replacement of Human Workforce
- 3.4. Market Trends
- 3.4.1. Chemotherapy Segment is Expected to Have a Highest Growth Rate in the Forecast Period
- 4. Market Factor Analysis
- 4.1. Porters Five Forces
- 4.2. Supply/Value Chain
- 4.3. PESTEL analysis
- 4.4. Market Entropy
- 4.5. Patent/Trademark Analysis
- 5. Global AI in Oncology Market Analysis, Insights and Forecast, 2019-2031
- 5.1. Market Analysis, Insights and Forecast - by Component
- 5.1.1. Software Solutions
- 5.1.2. Hardware
- 5.1.3. Services
- 5.2. Market Analysis, Insights and Forecast - by Cancer Type
- 5.2.1. Breast Cancer
- 5.2.2. Lung Cancer
- 5.2.3. Prostate Cancer
- 5.2.4. Colorectal Cancer
- 5.2.5. Brain Tumor
- 5.2.6. Other Cancer Types
- 5.3. Market Analysis, Insights and Forecast - by Treatment Type
- 5.3.1. Chemotherapy
- 5.3.2. Radiotherapy
- 5.3.3. Immunotherapy
- 5.3.4. Other Treatment Types
- 5.4. Market Analysis, Insights and Forecast - by Application
- 5.4.1. Cancer Detection
- 5.4.2. Drug Discovery
- 5.4.3. Drug Development
- 5.4.4. Other Applications
- 5.5. Market Analysis, Insights and Forecast - by Region
- 5.5.1. North America
- 5.5.2. Europe
- 5.5.3. Asia Pacific
- 5.5.4. Middle East and Africa
- 5.5.5. South America
- 5.1. Market Analysis, Insights and Forecast - by Component
- 6. North America AI in Oncology Market Analysis, Insights and Forecast, 2019-2031
- 6.1. Market Analysis, Insights and Forecast - by Component
- 6.1.1. Software Solutions
- 6.1.2. Hardware
- 6.1.3. Services
- 6.2. Market Analysis, Insights and Forecast - by Cancer Type
- 6.2.1. Breast Cancer
- 6.2.2. Lung Cancer
- 6.2.3. Prostate Cancer
- 6.2.4. Colorectal Cancer
- 6.2.5. Brain Tumor
- 6.2.6. Other Cancer Types
- 6.3. Market Analysis, Insights and Forecast - by Treatment Type
- 6.3.1. Chemotherapy
- 6.3.2. Radiotherapy
- 6.3.3. Immunotherapy
- 6.3.4. Other Treatment Types
- 6.4. Market Analysis, Insights and Forecast - by Application
- 6.4.1. Cancer Detection
- 6.4.2. Drug Discovery
- 6.4.3. Drug Development
- 6.4.4. Other Applications
- 6.1. Market Analysis, Insights and Forecast - by Component
- 7. Europe AI in Oncology Market Analysis, Insights and Forecast, 2019-2031
- 7.1. Market Analysis, Insights and Forecast - by Component
- 7.1.1. Software Solutions
- 7.1.2. Hardware
- 7.1.3. Services
- 7.2. Market Analysis, Insights and Forecast - by Cancer Type
- 7.2.1. Breast Cancer
- 7.2.2. Lung Cancer
- 7.2.3. Prostate Cancer
- 7.2.4. Colorectal Cancer
- 7.2.5. Brain Tumor
- 7.2.6. Other Cancer Types
- 7.3. Market Analysis, Insights and Forecast - by Treatment Type
- 7.3.1. Chemotherapy
- 7.3.2. Radiotherapy
- 7.3.3. Immunotherapy
- 7.3.4. Other Treatment Types
- 7.4. Market Analysis, Insights and Forecast - by Application
- 7.4.1. Cancer Detection
- 7.4.2. Drug Discovery
- 7.4.3. Drug Development
- 7.4.4. Other Applications
- 7.1. Market Analysis, Insights and Forecast - by Component
- 8. Asia Pacific AI in Oncology Market Analysis, Insights and Forecast, 2019-2031
- 8.1. Market Analysis, Insights and Forecast - by Component
- 8.1.1. Software Solutions
- 8.1.2. Hardware
- 8.1.3. Services
- 8.2. Market Analysis, Insights and Forecast - by Cancer Type
- 8.2.1. Breast Cancer
- 8.2.2. Lung Cancer
- 8.2.3. Prostate Cancer
- 8.2.4. Colorectal Cancer
- 8.2.5. Brain Tumor
- 8.2.6. Other Cancer Types
- 8.3. Market Analysis, Insights and Forecast - by Treatment Type
- 8.3.1. Chemotherapy
- 8.3.2. Radiotherapy
- 8.3.3. Immunotherapy
- 8.3.4. Other Treatment Types
- 8.4. Market Analysis, Insights and Forecast - by Application
- 8.4.1. Cancer Detection
- 8.4.2. Drug Discovery
- 8.4.3. Drug Development
- 8.4.4. Other Applications
- 8.1. Market Analysis, Insights and Forecast - by Component
- 9. Middle East and Africa AI in Oncology Market Analysis, Insights and Forecast, 2019-2031
- 9.1. Market Analysis, Insights and Forecast - by Component
- 9.1.1. Software Solutions
- 9.1.2. Hardware
- 9.1.3. Services
- 9.2. Market Analysis, Insights and Forecast - by Cancer Type
- 9.2.1. Breast Cancer
- 9.2.2. Lung Cancer
- 9.2.3. Prostate Cancer
- 9.2.4. Colorectal Cancer
- 9.2.5. Brain Tumor
- 9.2.6. Other Cancer Types
- 9.3. Market Analysis, Insights and Forecast - by Treatment Type
- 9.3.1. Chemotherapy
- 9.3.2. Radiotherapy
- 9.3.3. Immunotherapy
- 9.3.4. Other Treatment Types
- 9.4. Market Analysis, Insights and Forecast - by Application
- 9.4.1. Cancer Detection
- 9.4.2. Drug Discovery
- 9.4.3. Drug Development
- 9.4.4. Other Applications
- 9.1. Market Analysis, Insights and Forecast - by Component
- 10. South America AI in Oncology Market Analysis, Insights and Forecast, 2019-2031
- 10.1. Market Analysis, Insights and Forecast - by Component
- 10.1.1. Software Solutions
- 10.1.2. Hardware
- 10.1.3. Services
- 10.2. Market Analysis, Insights and Forecast - by Cancer Type
- 10.2.1. Breast Cancer
- 10.2.2. Lung Cancer
- 10.2.3. Prostate Cancer
- 10.2.4. Colorectal Cancer
- 10.2.5. Brain Tumor
- 10.2.6. Other Cancer Types
- 10.3. Market Analysis, Insights and Forecast - by Treatment Type
- 10.3.1. Chemotherapy
- 10.3.2. Radiotherapy
- 10.3.3. Immunotherapy
- 10.3.4. Other Treatment Types
- 10.4. Market Analysis, Insights and Forecast - by Application
- 10.4.1. Cancer Detection
- 10.4.2. Drug Discovery
- 10.4.3. Drug Development
- 10.4.4. Other Applications
- 10.1. Market Analysis, Insights and Forecast - by Component
- 11. North America AI in Oncology Market Analysis, Insights and Forecast, 2019-2031
- 11.1. Market Analysis, Insights and Forecast - By Country/Sub-region
- 11.1.1. undefined
- 12. Europe AI in Oncology Market Analysis, Insights and Forecast, 2019-2031
- 12.1. Market Analysis, Insights and Forecast - By Country/Sub-region
- 12.1.1. undefined
- 13. Asia Pacific AI in Oncology Market Analysis, Insights and Forecast, 2019-2031
- 13.1. Market Analysis, Insights and Forecast - By Country/Sub-region
- 13.1.1. undefined
- 14. Middle East and Africa AI in Oncology Market Analysis, Insights and Forecast, 2019-2031
- 14.1. Market Analysis, Insights and Forecast - By Country/Sub-region
- 14.1.1. undefined
- 15. South America AI in Oncology Market Analysis, Insights and Forecast, 2019-2031
- 15.1. Market Analysis, Insights and Forecast - By Country/Sub-region
- 15.1.1. undefined
- 16. Competitive Analysis
- 16.1. Global Market Share Analysis 2024
- 16.2. Company Profiles
- 16.2.1 IBM Corporation
- 16.2.1.1. Overview
- 16.2.1.2. Products
- 16.2.1.3. SWOT Analysis
- 16.2.1.4. Recent Developments
- 16.2.1.5. Financials (Based on Availability)
- 16.2.2 Digital Diagnostics Inc
- 16.2.2.1. Overview
- 16.2.2.2. Products
- 16.2.2.3. SWOT Analysis
- 16.2.2.4. Recent Developments
- 16.2.2.5. Financials (Based on Availability)
- 16.2.3 PathAI
- 16.2.3.1. Overview
- 16.2.3.2. Products
- 16.2.3.3. SWOT Analysis
- 16.2.3.4. Recent Developments
- 16.2.3.5. Financials (Based on Availability)
- 16.2.4 Medtronic
- 16.2.4.1. Overview
- 16.2.4.2. Products
- 16.2.4.3. SWOT Analysis
- 16.2.4.4. Recent Developments
- 16.2.4.5. Financials (Based on Availability)
- 16.2.5 NVIDIA Corporation
- 16.2.5.1. Overview
- 16.2.5.2. Products
- 16.2.5.3. SWOT Analysis
- 16.2.5.4. Recent Developments
- 16.2.5.5. Financials (Based on Availability)
- 16.2.6 GE Healthcare
- 16.2.6.1. Overview
- 16.2.6.2. Products
- 16.2.6.3. SWOT Analysis
- 16.2.6.4. Recent Developments
- 16.2.6.5. Financials (Based on Availability)
- 16.2.7 Siemens Healthineers AG
- 16.2.7.1. Overview
- 16.2.7.2. Products
- 16.2.7.3. SWOT Analysis
- 16.2.7.4. Recent Developments
- 16.2.7.5. Financials (Based on Availability)
- 16.2.8 Azra AI
- 16.2.8.1. Overview
- 16.2.8.2. Products
- 16.2.8.3. SWOT Analysis
- 16.2.8.4. Recent Developments
- 16.2.8.5. Financials (Based on Availability)
- 16.2.9 Median Technologies Inc
- 16.2.9.1. Overview
- 16.2.9.2. Products
- 16.2.9.3. SWOT Analysis
- 16.2.9.4. Recent Developments
- 16.2.9.5. Financials (Based on Availability)
- 16.2.10 Intel Corporation
- 16.2.10.1. Overview
- 16.2.10.2. Products
- 16.2.10.3. SWOT Analysis
- 16.2.10.4. Recent Developments
- 16.2.10.5. Financials (Based on Availability)
- 16.2.11 ConcertAI LLC
- 16.2.11.1. Overview
- 16.2.11.2. Products
- 16.2.11.3. SWOT Analysis
- 16.2.11.4. Recent Developments
- 16.2.11.5. Financials (Based on Availability)
- 16.2.1 IBM Corporation
List of Figures
- Figure 1: Global AI in Oncology Market Revenue Breakdown (Million, %) by Region 2024 & 2032
- Figure 2: Global AI in Oncology Market Volume Breakdown (K Unit, %) by Region 2024 & 2032
- Figure 3: North America AI in Oncology Market Revenue (Million), by Country 2024 & 2032
- Figure 4: North America AI in Oncology Market Volume (K Unit), by Country 2024 & 2032
- Figure 5: North America AI in Oncology Market Revenue Share (%), by Country 2024 & 2032
- Figure 6: North America AI in Oncology Market Volume Share (%), by Country 2024 & 2032
- Figure 7: Europe AI in Oncology Market Revenue (Million), by Country 2024 & 2032
- Figure 8: Europe AI in Oncology Market Volume (K Unit), by Country 2024 & 2032
- Figure 9: Europe AI in Oncology Market Revenue Share (%), by Country 2024 & 2032
- Figure 10: Europe AI in Oncology Market Volume Share (%), by Country 2024 & 2032
- Figure 11: Asia Pacific AI in Oncology Market Revenue (Million), by Country 2024 & 2032
- Figure 12: Asia Pacific AI in Oncology Market Volume (K Unit), by Country 2024 & 2032
- Figure 13: Asia Pacific AI in Oncology Market Revenue Share (%), by Country 2024 & 2032
- Figure 14: Asia Pacific AI in Oncology Market Volume Share (%), by Country 2024 & 2032
- Figure 15: Middle East and Africa AI in Oncology Market Revenue (Million), by Country 2024 & 2032
- Figure 16: Middle East and Africa AI in Oncology Market Volume (K Unit), by Country 2024 & 2032
- Figure 17: Middle East and Africa AI in Oncology Market Revenue Share (%), by Country 2024 & 2032
- Figure 18: Middle East and Africa AI in Oncology Market Volume Share (%), by Country 2024 & 2032
- Figure 19: South America AI in Oncology Market Revenue (Million), by Country 2024 & 2032
- Figure 20: South America AI in Oncology Market Volume (K Unit), by Country 2024 & 2032
- Figure 21: South America AI in Oncology Market Revenue Share (%), by Country 2024 & 2032
- Figure 22: South America AI in Oncology Market Volume Share (%), by Country 2024 & 2032
- Figure 23: North America AI in Oncology Market Revenue (Million), by Component 2024 & 2032
- Figure 24: North America AI in Oncology Market Volume (K Unit), by Component 2024 & 2032
- Figure 25: North America AI in Oncology Market Revenue Share (%), by Component 2024 & 2032
- Figure 26: North America AI in Oncology Market Volume Share (%), by Component 2024 & 2032
- Figure 27: North America AI in Oncology Market Revenue (Million), by Cancer Type 2024 & 2032
- Figure 28: North America AI in Oncology Market Volume (K Unit), by Cancer Type 2024 & 2032
- Figure 29: North America AI in Oncology Market Revenue Share (%), by Cancer Type 2024 & 2032
- Figure 30: North America AI in Oncology Market Volume Share (%), by Cancer Type 2024 & 2032
- Figure 31: North America AI in Oncology Market Revenue (Million), by Treatment Type 2024 & 2032
- Figure 32: North America AI in Oncology Market Volume (K Unit), by Treatment Type 2024 & 2032
- Figure 33: North America AI in Oncology Market Revenue Share (%), by Treatment Type 2024 & 2032
- Figure 34: North America AI in Oncology Market Volume Share (%), by Treatment Type 2024 & 2032
- Figure 35: North America AI in Oncology Market Revenue (Million), by Application 2024 & 2032
- Figure 36: North America AI in Oncology Market Volume (K Unit), by Application 2024 & 2032
- Figure 37: North America AI in Oncology Market Revenue Share (%), by Application 2024 & 2032
- Figure 38: North America AI in Oncology Market Volume Share (%), by Application 2024 & 2032
- Figure 39: North America AI in Oncology Market Revenue (Million), by Country 2024 & 2032
- Figure 40: North America AI in Oncology Market Volume (K Unit), by Country 2024 & 2032
- Figure 41: North America AI in Oncology Market Revenue Share (%), by Country 2024 & 2032
- Figure 42: North America AI in Oncology Market Volume Share (%), by Country 2024 & 2032
- Figure 43: Europe AI in Oncology Market Revenue (Million), by Component 2024 & 2032
- Figure 44: Europe AI in Oncology Market Volume (K Unit), by Component 2024 & 2032
- Figure 45: Europe AI in Oncology Market Revenue Share (%), by Component 2024 & 2032
- Figure 46: Europe AI in Oncology Market Volume Share (%), by Component 2024 & 2032
- Figure 47: Europe AI in Oncology Market Revenue (Million), by Cancer Type 2024 & 2032
- Figure 48: Europe AI in Oncology Market Volume (K Unit), by Cancer Type 2024 & 2032
- Figure 49: Europe AI in Oncology Market Revenue Share (%), by Cancer Type 2024 & 2032
- Figure 50: Europe AI in Oncology Market Volume Share (%), by Cancer Type 2024 & 2032
- Figure 51: Europe AI in Oncology Market Revenue (Million), by Treatment Type 2024 & 2032
- Figure 52: Europe AI in Oncology Market Volume (K Unit), by Treatment Type 2024 & 2032
- Figure 53: Europe AI in Oncology Market Revenue Share (%), by Treatment Type 2024 & 2032
- Figure 54: Europe AI in Oncology Market Volume Share (%), by Treatment Type 2024 & 2032
- Figure 55: Europe AI in Oncology Market Revenue (Million), by Application 2024 & 2032
- Figure 56: Europe AI in Oncology Market Volume (K Unit), by Application 2024 & 2032
- Figure 57: Europe AI in Oncology Market Revenue Share (%), by Application 2024 & 2032
- Figure 58: Europe AI in Oncology Market Volume Share (%), by Application 2024 & 2032
- Figure 59: Europe AI in Oncology Market Revenue (Million), by Country 2024 & 2032
- Figure 60: Europe AI in Oncology Market Volume (K Unit), by Country 2024 & 2032
- Figure 61: Europe AI in Oncology Market Revenue Share (%), by Country 2024 & 2032
- Figure 62: Europe AI in Oncology Market Volume Share (%), by Country 2024 & 2032
- Figure 63: Asia Pacific AI in Oncology Market Revenue (Million), by Component 2024 & 2032
- Figure 64: Asia Pacific AI in Oncology Market Volume (K Unit), by Component 2024 & 2032
- Figure 65: Asia Pacific AI in Oncology Market Revenue Share (%), by Component 2024 & 2032
- Figure 66: Asia Pacific AI in Oncology Market Volume Share (%), by Component 2024 & 2032
- Figure 67: Asia Pacific AI in Oncology Market Revenue (Million), by Cancer Type 2024 & 2032
- Figure 68: Asia Pacific AI in Oncology Market Volume (K Unit), by Cancer Type 2024 & 2032
- Figure 69: Asia Pacific AI in Oncology Market Revenue Share (%), by Cancer Type 2024 & 2032
- Figure 70: Asia Pacific AI in Oncology Market Volume Share (%), by Cancer Type 2024 & 2032
- Figure 71: Asia Pacific AI in Oncology Market Revenue (Million), by Treatment Type 2024 & 2032
- Figure 72: Asia Pacific AI in Oncology Market Volume (K Unit), by Treatment Type 2024 & 2032
- Figure 73: Asia Pacific AI in Oncology Market Revenue Share (%), by Treatment Type 2024 & 2032
- Figure 74: Asia Pacific AI in Oncology Market Volume Share (%), by Treatment Type 2024 & 2032
- Figure 75: Asia Pacific AI in Oncology Market Revenue (Million), by Application 2024 & 2032
- Figure 76: Asia Pacific AI in Oncology Market Volume (K Unit), by Application 2024 & 2032
- Figure 77: Asia Pacific AI in Oncology Market Revenue Share (%), by Application 2024 & 2032
- Figure 78: Asia Pacific AI in Oncology Market Volume Share (%), by Application 2024 & 2032
- Figure 79: Asia Pacific AI in Oncology Market Revenue (Million), by Country 2024 & 2032
- Figure 80: Asia Pacific AI in Oncology Market Volume (K Unit), by Country 2024 & 2032
- Figure 81: Asia Pacific AI in Oncology Market Revenue Share (%), by Country 2024 & 2032
- Figure 82: Asia Pacific AI in Oncology Market Volume Share (%), by Country 2024 & 2032
- Figure 83: Middle East and Africa AI in Oncology Market Revenue (Million), by Component 2024 & 2032
- Figure 84: Middle East and Africa AI in Oncology Market Volume (K Unit), by Component 2024 & 2032
- Figure 85: Middle East and Africa AI in Oncology Market Revenue Share (%), by Component 2024 & 2032
- Figure 86: Middle East and Africa AI in Oncology Market Volume Share (%), by Component 2024 & 2032
- Figure 87: Middle East and Africa AI in Oncology Market Revenue (Million), by Cancer Type 2024 & 2032
- Figure 88: Middle East and Africa AI in Oncology Market Volume (K Unit), by Cancer Type 2024 & 2032
- Figure 89: Middle East and Africa AI in Oncology Market Revenue Share (%), by Cancer Type 2024 & 2032
- Figure 90: Middle East and Africa AI in Oncology Market Volume Share (%), by Cancer Type 2024 & 2032
- Figure 91: Middle East and Africa AI in Oncology Market Revenue (Million), by Treatment Type 2024 & 2032
- Figure 92: Middle East and Africa AI in Oncology Market Volume (K Unit), by Treatment Type 2024 & 2032
- Figure 93: Middle East and Africa AI in Oncology Market Revenue Share (%), by Treatment Type 2024 & 2032
- Figure 94: Middle East and Africa AI in Oncology Market Volume Share (%), by Treatment Type 2024 & 2032
- Figure 95: Middle East and Africa AI in Oncology Market Revenue (Million), by Application 2024 & 2032
- Figure 96: Middle East and Africa AI in Oncology Market Volume (K Unit), by Application 2024 & 2032
- Figure 97: Middle East and Africa AI in Oncology Market Revenue Share (%), by Application 2024 & 2032
- Figure 98: Middle East and Africa AI in Oncology Market Volume Share (%), by Application 2024 & 2032
- Figure 99: Middle East and Africa AI in Oncology Market Revenue (Million), by Country 2024 & 2032
- Figure 100: Middle East and Africa AI in Oncology Market Volume (K Unit), by Country 2024 & 2032
- Figure 101: Middle East and Africa AI in Oncology Market Revenue Share (%), by Country 2024 & 2032
- Figure 102: Middle East and Africa AI in Oncology Market Volume Share (%), by Country 2024 & 2032
- Figure 103: South America AI in Oncology Market Revenue (Million), by Component 2024 & 2032
- Figure 104: South America AI in Oncology Market Volume (K Unit), by Component 2024 & 2032
- Figure 105: South America AI in Oncology Market Revenue Share (%), by Component 2024 & 2032
- Figure 106: South America AI in Oncology Market Volume Share (%), by Component 2024 & 2032
- Figure 107: South America AI in Oncology Market Revenue (Million), by Cancer Type 2024 & 2032
- Figure 108: South America AI in Oncology Market Volume (K Unit), by Cancer Type 2024 & 2032
- Figure 109: South America AI in Oncology Market Revenue Share (%), by Cancer Type 2024 & 2032
- Figure 110: South America AI in Oncology Market Volume Share (%), by Cancer Type 2024 & 2032
- Figure 111: South America AI in Oncology Market Revenue (Million), by Treatment Type 2024 & 2032
- Figure 112: South America AI in Oncology Market Volume (K Unit), by Treatment Type 2024 & 2032
- Figure 113: South America AI in Oncology Market Revenue Share (%), by Treatment Type 2024 & 2032
- Figure 114: South America AI in Oncology Market Volume Share (%), by Treatment Type 2024 & 2032
- Figure 115: South America AI in Oncology Market Revenue (Million), by Application 2024 & 2032
- Figure 116: South America AI in Oncology Market Volume (K Unit), by Application 2024 & 2032
- Figure 117: South America AI in Oncology Market Revenue Share (%), by Application 2024 & 2032
- Figure 118: South America AI in Oncology Market Volume Share (%), by Application 2024 & 2032
- Figure 119: South America AI in Oncology Market Revenue (Million), by Country 2024 & 2032
- Figure 120: South America AI in Oncology Market Volume (K Unit), by Country 2024 & 2032
- Figure 121: South America AI in Oncology Market Revenue Share (%), by Country 2024 & 2032
- Figure 122: South America AI in Oncology Market Volume Share (%), by Country 2024 & 2032
List of Tables
- Table 1: Global AI in Oncology Market Revenue Million Forecast, by Region 2019 & 2032
- Table 2: Global AI in Oncology Market Volume K Unit Forecast, by Region 2019 & 2032
- Table 3: Global AI in Oncology Market Revenue Million Forecast, by Component 2019 & 2032
- Table 4: Global AI in Oncology Market Volume K Unit Forecast, by Component 2019 & 2032
- Table 5: Global AI in Oncology Market Revenue Million Forecast, by Cancer Type 2019 & 2032
- Table 6: Global AI in Oncology Market Volume K Unit Forecast, by Cancer Type 2019 & 2032
- Table 7: Global AI in Oncology Market Revenue Million Forecast, by Treatment Type 2019 & 2032
- Table 8: Global AI in Oncology Market Volume K Unit Forecast, by Treatment Type 2019 & 2032
- Table 9: Global AI in Oncology Market Revenue Million Forecast, by Application 2019 & 2032
- Table 10: Global AI in Oncology Market Volume K Unit Forecast, by Application 2019 & 2032
- Table 11: Global AI in Oncology Market Revenue Million Forecast, by Region 2019 & 2032
- Table 12: Global AI in Oncology Market Volume K Unit Forecast, by Region 2019 & 2032
- Table 13: Global AI in Oncology Market Revenue Million Forecast, by Country 2019 & 2032
- Table 14: Global AI in Oncology Market Volume K Unit Forecast, by Country 2019 & 2032
- Table 15: Global AI in Oncology Market Revenue Million Forecast, by Country 2019 & 2032
- Table 16: Global AI in Oncology Market Volume K Unit Forecast, by Country 2019 & 2032
- Table 17: Global AI in Oncology Market Revenue Million Forecast, by Country 2019 & 2032
- Table 18: Global AI in Oncology Market Volume K Unit Forecast, by Country 2019 & 2032
- Table 19: Global AI in Oncology Market Revenue Million Forecast, by Country 2019 & 2032
- Table 20: Global AI in Oncology Market Volume K Unit Forecast, by Country 2019 & 2032
- Table 21: Global AI in Oncology Market Revenue Million Forecast, by Country 2019 & 2032
- Table 22: Global AI in Oncology Market Volume K Unit Forecast, by Country 2019 & 2032
- Table 23: Global AI in Oncology Market Revenue Million Forecast, by Component 2019 & 2032
- Table 24: Global AI in Oncology Market Volume K Unit Forecast, by Component 2019 & 2032
- Table 25: Global AI in Oncology Market Revenue Million Forecast, by Cancer Type 2019 & 2032
- Table 26: Global AI in Oncology Market Volume K Unit Forecast, by Cancer Type 2019 & 2032
- Table 27: Global AI in Oncology Market Revenue Million Forecast, by Treatment Type 2019 & 2032
- Table 28: Global AI in Oncology Market Volume K Unit Forecast, by Treatment Type 2019 & 2032
- Table 29: Global AI in Oncology Market Revenue Million Forecast, by Application 2019 & 2032
- Table 30: Global AI in Oncology Market Volume K Unit Forecast, by Application 2019 & 2032
- Table 31: Global AI in Oncology Market Revenue Million Forecast, by Country 2019 & 2032
- Table 32: Global AI in Oncology Market Volume K Unit Forecast, by Country 2019 & 2032
- Table 33: United States AI in Oncology Market Revenue (Million) Forecast, by Application 2019 & 2032
- Table 34: United States AI in Oncology Market Volume (K Unit) Forecast, by Application 2019 & 2032
- Table 35: Canada AI in Oncology Market Revenue (Million) Forecast, by Application 2019 & 2032
- Table 36: Canada AI in Oncology Market Volume (K Unit) Forecast, by Application 2019 & 2032
- Table 37: Mexico AI in Oncology Market Revenue (Million) Forecast, by Application 2019 & 2032
- Table 38: Mexico AI in Oncology Market Volume (K Unit) Forecast, by Application 2019 & 2032
- Table 39: Global AI in Oncology Market Revenue Million Forecast, by Component 2019 & 2032
- Table 40: Global AI in Oncology Market Volume K Unit Forecast, by Component 2019 & 2032
- Table 41: Global AI in Oncology Market Revenue Million Forecast, by Cancer Type 2019 & 2032
- Table 42: Global AI in Oncology Market Volume K Unit Forecast, by Cancer Type 2019 & 2032
- Table 43: Global AI in Oncology Market Revenue Million Forecast, by Treatment Type 2019 & 2032
- Table 44: Global AI in Oncology Market Volume K Unit Forecast, by Treatment Type 2019 & 2032
- Table 45: Global AI in Oncology Market Revenue Million Forecast, by Application 2019 & 2032
- Table 46: Global AI in Oncology Market Volume K Unit Forecast, by Application 2019 & 2032
- Table 47: Global AI in Oncology Market Revenue Million Forecast, by Country 2019 & 2032
- Table 48: Global AI in Oncology Market Volume K Unit Forecast, by Country 2019 & 2032
- Table 49: Germany AI in Oncology Market Revenue (Million) Forecast, by Application 2019 & 2032
- Table 50: Germany AI in Oncology Market Volume (K Unit) Forecast, by Application 2019 & 2032
- Table 51: United Kingdom AI in Oncology Market Revenue (Million) Forecast, by Application 2019 & 2032
- Table 52: United Kingdom AI in Oncology Market Volume (K Unit) Forecast, by Application 2019 & 2032
- Table 53: France AI in Oncology Market Revenue (Million) Forecast, by Application 2019 & 2032
- Table 54: France AI in Oncology Market Volume (K Unit) Forecast, by Application 2019 & 2032
- Table 55: Italy AI in Oncology Market Revenue (Million) Forecast, by Application 2019 & 2032
- Table 56: Italy AI in Oncology Market Volume (K Unit) Forecast, by Application 2019 & 2032
- Table 57: Spain AI in Oncology Market Revenue (Million) Forecast, by Application 2019 & 2032
- Table 58: Spain AI in Oncology Market Volume (K Unit) Forecast, by Application 2019 & 2032
- Table 59: Rest of Europe AI in Oncology Market Revenue (Million) Forecast, by Application 2019 & 2032
- Table 60: Rest of Europe AI in Oncology Market Volume (K Unit) Forecast, by Application 2019 & 2032
- Table 61: Global AI in Oncology Market Revenue Million Forecast, by Component 2019 & 2032
- Table 62: Global AI in Oncology Market Volume K Unit Forecast, by Component 2019 & 2032
- Table 63: Global AI in Oncology Market Revenue Million Forecast, by Cancer Type 2019 & 2032
- Table 64: Global AI in Oncology Market Volume K Unit Forecast, by Cancer Type 2019 & 2032
- Table 65: Global AI in Oncology Market Revenue Million Forecast, by Treatment Type 2019 & 2032
- Table 66: Global AI in Oncology Market Volume K Unit Forecast, by Treatment Type 2019 & 2032
- Table 67: Global AI in Oncology Market Revenue Million Forecast, by Application 2019 & 2032
- Table 68: Global AI in Oncology Market Volume K Unit Forecast, by Application 2019 & 2032
- Table 69: Global AI in Oncology Market Revenue Million Forecast, by Country 2019 & 2032
- Table 70: Global AI in Oncology Market Volume K Unit Forecast, by Country 2019 & 2032
- Table 71: China AI in Oncology Market Revenue (Million) Forecast, by Application 2019 & 2032
- Table 72: China AI in Oncology Market Volume (K Unit) Forecast, by Application 2019 & 2032
- Table 73: Japan AI in Oncology Market Revenue (Million) Forecast, by Application 2019 & 2032
- Table 74: Japan AI in Oncology Market Volume (K Unit) Forecast, by Application 2019 & 2032
- Table 75: India AI in Oncology Market Revenue (Million) Forecast, by Application 2019 & 2032
- Table 76: India AI in Oncology Market Volume (K Unit) Forecast, by Application 2019 & 2032
- Table 77: Australia AI in Oncology Market Revenue (Million) Forecast, by Application 2019 & 2032
- Table 78: Australia AI in Oncology Market Volume (K Unit) Forecast, by Application 2019 & 2032
- Table 79: South Korea AI in Oncology Market Revenue (Million) Forecast, by Application 2019 & 2032
- Table 80: South Korea AI in Oncology Market Volume (K Unit) Forecast, by Application 2019 & 2032
- Table 81: Rest of Asia Pacific AI in Oncology Market Revenue (Million) Forecast, by Application 2019 & 2032
- Table 82: Rest of Asia Pacific AI in Oncology Market Volume (K Unit) Forecast, by Application 2019 & 2032
- Table 83: Global AI in Oncology Market Revenue Million Forecast, by Component 2019 & 2032
- Table 84: Global AI in Oncology Market Volume K Unit Forecast, by Component 2019 & 2032
- Table 85: Global AI in Oncology Market Revenue Million Forecast, by Cancer Type 2019 & 2032
- Table 86: Global AI in Oncology Market Volume K Unit Forecast, by Cancer Type 2019 & 2032
- Table 87: Global AI in Oncology Market Revenue Million Forecast, by Treatment Type 2019 & 2032
- Table 88: Global AI in Oncology Market Volume K Unit Forecast, by Treatment Type 2019 & 2032
- Table 89: Global AI in Oncology Market Revenue Million Forecast, by Application 2019 & 2032
- Table 90: Global AI in Oncology Market Volume K Unit Forecast, by Application 2019 & 2032
- Table 91: Global AI in Oncology Market Revenue Million Forecast, by Country 2019 & 2032
- Table 92: Global AI in Oncology Market Volume K Unit Forecast, by Country 2019 & 2032
- Table 93: GCC AI in Oncology Market Revenue (Million) Forecast, by Application 2019 & 2032
- Table 94: GCC AI in Oncology Market Volume (K Unit) Forecast, by Application 2019 & 2032
- Table 95: South Africa AI in Oncology Market Revenue (Million) Forecast, by Application 2019 & 2032
- Table 96: South Africa AI in Oncology Market Volume (K Unit) Forecast, by Application 2019 & 2032
- Table 97: Rest of Middle East and Africa AI in Oncology Market Revenue (Million) Forecast, by Application 2019 & 2032
- Table 98: Rest of Middle East and Africa AI in Oncology Market Volume (K Unit) Forecast, by Application 2019 & 2032
- Table 99: Global AI in Oncology Market Revenue Million Forecast, by Component 2019 & 2032
- Table 100: Global AI in Oncology Market Volume K Unit Forecast, by Component 2019 & 2032
- Table 101: Global AI in Oncology Market Revenue Million Forecast, by Cancer Type 2019 & 2032
- Table 102: Global AI in Oncology Market Volume K Unit Forecast, by Cancer Type 2019 & 2032
- Table 103: Global AI in Oncology Market Revenue Million Forecast, by Treatment Type 2019 & 2032
- Table 104: Global AI in Oncology Market Volume K Unit Forecast, by Treatment Type 2019 & 2032
- Table 105: Global AI in Oncology Market Revenue Million Forecast, by Application 2019 & 2032
- Table 106: Global AI in Oncology Market Volume K Unit Forecast, by Application 2019 & 2032
- Table 107: Global AI in Oncology Market Revenue Million Forecast, by Country 2019 & 2032
- Table 108: Global AI in Oncology Market Volume K Unit Forecast, by Country 2019 & 2032
- Table 109: Brazil AI in Oncology Market Revenue (Million) Forecast, by Application 2019 & 2032
- Table 110: Brazil AI in Oncology Market Volume (K Unit) Forecast, by Application 2019 & 2032
- Table 111: Argentina AI in Oncology Market Revenue (Million) Forecast, by Application 2019 & 2032
- Table 112: Argentina AI in Oncology Market Volume (K Unit) Forecast, by Application 2019 & 2032
- Table 113: Rest of South America AI in Oncology Market Revenue (Million) Forecast, by Application 2019 & 2032
- Table 114: Rest of South America AI in Oncology Market Volume (K Unit) Forecast, by Application 2019 & 2032
Frequently Asked Questions
1. What is the projected Compound Annual Growth Rate (CAGR) of the AI in Oncology Market?
The projected CAGR is approximately 35.51%.
2. Which companies are prominent players in the AI in Oncology Market?
Key companies in the market include IBM Corporation, Digital Diagnostics Inc, PathAI, Medtronic, NVIDIA Corporation, GE Healthcare, Siemens Healthineers AG, Azra AI, Median Technologies Inc, Intel Corporation, ConcertAI LLC.
3. What are the main segments of the AI in Oncology Market?
The market segments include Component, Cancer Type, Treatment Type, Application.
4. Can you provide details about the market size?
The market size is estimated to be USD 1.46 Million as of 2022.
5. What are some drivers contributing to market growth?
Surging Advancements in Healthcare Infrastructure; Increasing Prevalence of Cancer; Rising Demand for Early and Accurate Diagnosis of Cancer.
6. What are the notable trends driving market growth?
Chemotherapy Segment is Expected to Have a Highest Growth Rate in the Forecast Period.
7. Are there any restraints impacting market growth?
High Initial Costs and Concerns over the Replacement of Human Workforce.
8. Can you provide examples of recent developments in the market?
In September 2021, Owkin, Inc., in collaboration with Cleveland Clinic researchers, announced the development of a deep-learning model that predicts survival and health outcomes for hepatocellular carcinoma.
9. What pricing options are available for accessing the report?
Pricing options include single-user, multi-user, and enterprise licenses priced at USD 4750, USD 5250, and USD 8750 respectively.
10. Is the market size provided in terms of value or volume?
The market size is provided in terms of value, measured in Million and volume, measured in K Unit.
11. Are there any specific market keywords associated with the report?
Yes, the market keyword associated with the report is "AI in Oncology Market," which aids in identifying and referencing the specific market segment covered.
12. How do I determine which pricing option suits my needs best?
The pricing options vary based on user requirements and access needs. Individual users may opt for single-user licenses, while businesses requiring broader access may choose multi-user or enterprise licenses for cost-effective access to the report.
13. Are there any additional resources or data provided in the AI in Oncology Market report?
While the report offers comprehensive insights, it's advisable to review the specific contents or supplementary materials provided to ascertain if additional resources or data are available.
14. How can I stay updated on further developments or reports in the AI in Oncology Market?
To stay informed about further developments, trends, and reports in the AI in Oncology Market, consider subscribing to industry newsletters, following relevant companies and organizations, or regularly checking reputable industry news sources and publications.
Methodology
Step 1 - Identification of Relevant Samples Size from Population Database


Step 2 - Approaches for Defining Global Market Size (Value, Volume* & Price*)

Note*: In applicable scenarios
Step 3 - Data Sources
Primary Research
- Web Analytics
- Survey Reports
- Research Institute
- Latest Research Reports
- Opinion Leaders
Secondary Research
- Annual Reports
- White Paper
- Latest Press Release
- Industry Association
- Paid Database
- Investor Presentations

Step 4 - Data Triangulation
Involves using different sources of information in order to increase the validity of a study
These sources are likely to be stakeholders in a program - participants, other researchers, program staff, other community members, and so on.
Then we put all data in single framework & apply various statistical tools to find out the dynamic on the market.
During the analysis stage, feedback from the stakeholder groups would be compared to determine areas of agreement as well as areas of divergence


