
Key Insights
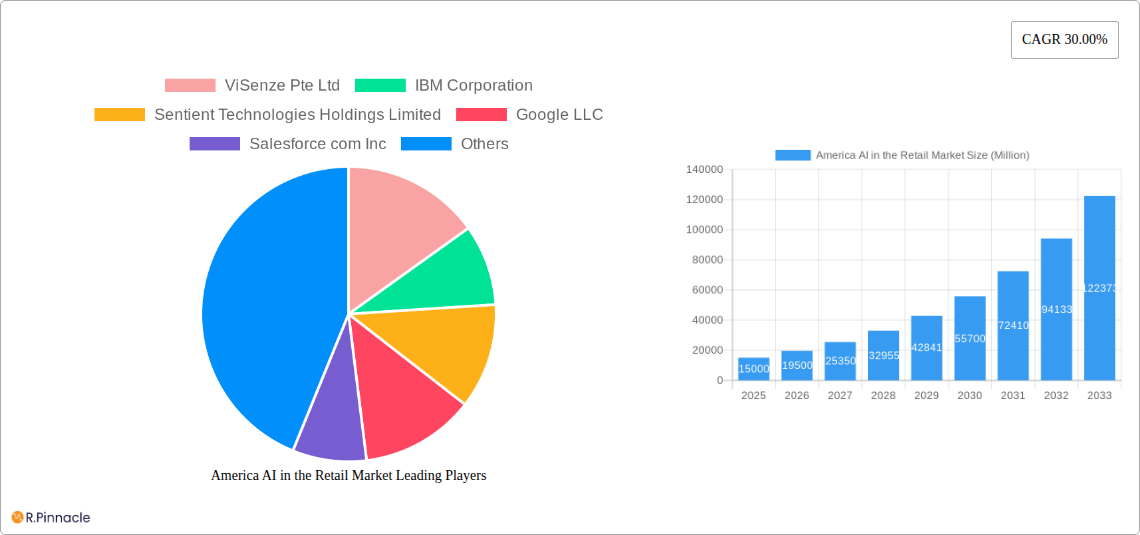
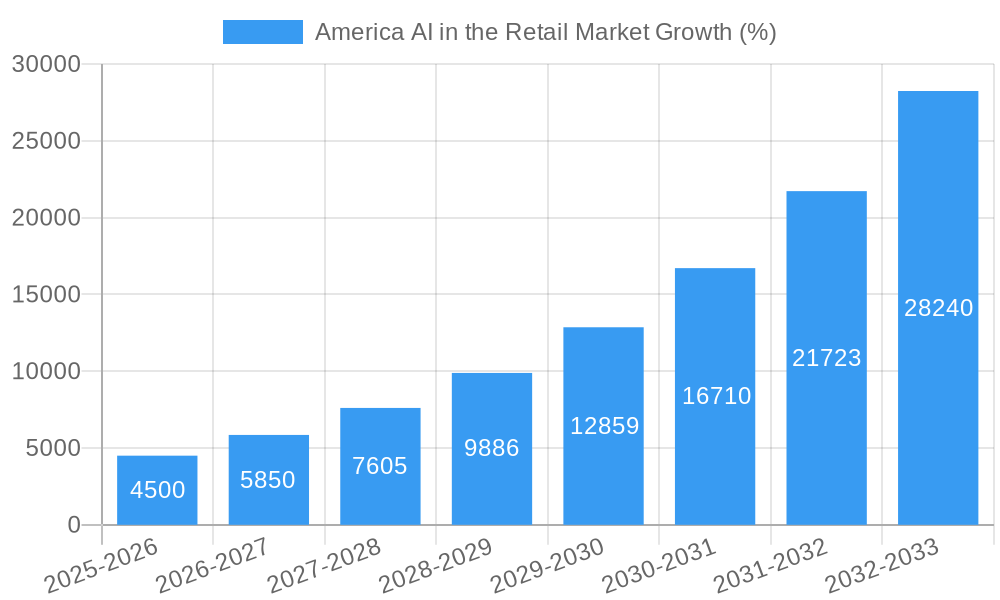
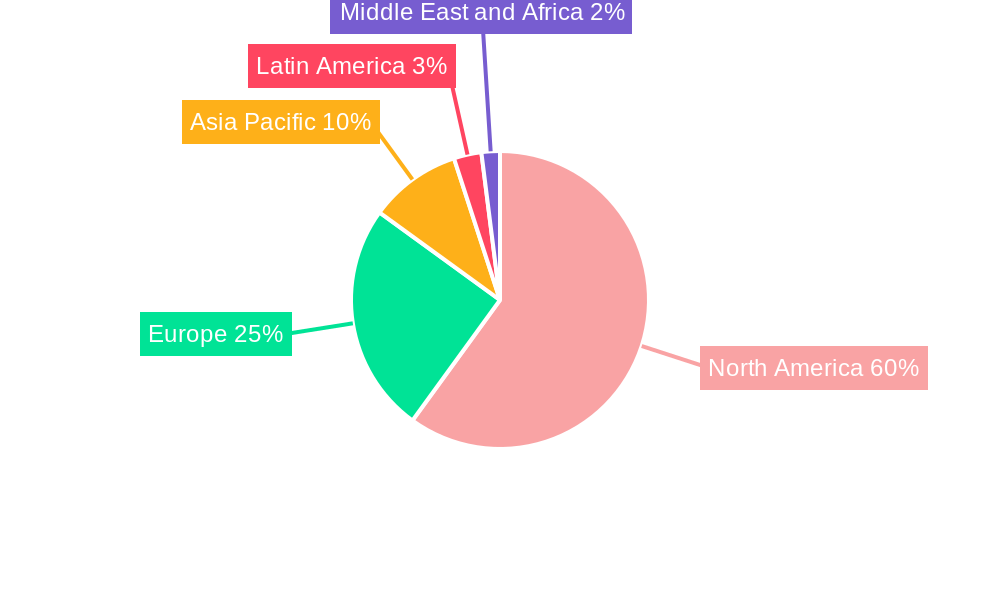
The North American AI in Retail market is experiencing robust growth, fueled by a 30% Compound Annual Growth Rate (CAGR) from 2019-2024, indicating a significant expansion in the adoption of artificial intelligence across various retail segments. This growth is driven by the increasing need for enhanced customer experience, optimized supply chain management, and data-driven decision-making. Omnichannel strategies are becoming increasingly prevalent, demanding sophisticated AI solutions for personalized marketing, inventory management, and fraud detection. The software segment, particularly cloud-based services leveraging machine learning and natural language processing, is leading the charge, with applications in apparel & footwear, food & grocery, and electronics & home appliances showing strong adoption rates. Key players like IBM, Google, Amazon, and Salesforce are heavily investing in this space, creating a competitive landscape marked by continuous innovation in areas like chatbot development and image/video analytics. This creates a dynamic environment where companies must adapt quickly to stay competitive.
The forecast period of 2025-2033 projects continued expansion, albeit potentially with a slightly moderated CAGR as the market matures. However, the underlying drivers remain strong. The increasing availability of high-quality data, advancements in AI algorithms, and the rising adoption of cloud computing are all contributing to this sustained growth. While challenges such as data security and privacy concerns, as well as the need for skilled AI professionals, exist, the benefits of AI in optimizing retail operations and enhancing customer engagement far outweigh these hurdles, ensuring the continued expansion of this vital market segment. The robust growth in specific retail sectors such as e-commerce and the expansion of smart retail technologies further contribute to the market's dynamism. The ongoing development of new AI capabilities and applications within the retail sector suggests further market expansion beyond 2033.
America AI in the Retail Market: A Comprehensive Report (2019-2033)
This in-depth report provides a comprehensive analysis of the burgeoning American AI in the retail market, offering actionable insights for industry professionals. Leveraging a robust dataset spanning 2019-2033 (Base Year: 2025, Forecast Period: 2025-2033), this report examines market structure, innovation trends, dominant segments, and key players, providing crucial data-driven projections to navigate this rapidly evolving landscape. The study period covers the historical period (2019-2024) and offers critical forecasts for the future. The total market size in 2025 is estimated at $XX Million.
America AI in the Retail Market Market Structure & Innovation Trends
This section analyzes the competitive landscape of the American AI in retail market, exploring market concentration, innovation drivers, regulatory influences, and industry dynamics. The report examines the market share of key players like ViSenze Pte Ltd, IBM Corporation, Sentient Technologies Holdings Limited, Google LLC, Salesforce com Inc, Microsoft Corporation, Amazon Web Services Inc, Sophos Inc (Thoma Bravo), Oracle Corporation, and SAP SE, assessing their strategies and contributions to market growth. The report quantifies market concentration using the Herfindahl-Hirschman Index (HHI) and analyzes M&A activities, detailing deal values (e.g., a $XX Million acquisition of Company X by Company Y in 2023). The influence of regulatory frameworks like data privacy legislation (e.g., CCPA) on market structure is also examined, along with the impact of product substitutes and evolving end-user demographics.
America AI in the Retail Market Market Dynamics & Trends
This section delves into the dynamic forces shaping the American AI in retail market, examining market growth drivers, technological advancements, consumer behavior shifts, and competitive pressures. The report projects a Compound Annual Growth Rate (CAGR) of XX% during the forecast period (2025-2033), detailing the factors contributing to this growth. Specific drivers include rising consumer adoption of online shopping, increased investment in AI technologies by retailers, and growing demand for personalized customer experiences. The report further analyzes the market penetration of AI solutions across various retail segments, noting significant shifts in consumer preferences toward personalized recommendations, AI-powered chatbots, and seamless omnichannel experiences. Competitive dynamics are explored, highlighting strategic alliances, competitive pricing strategies, and the emergence of new market entrants.
Dominant Regions & Segments in America AI in the Retail Market
This section identifies the leading regions, countries, and market segments within the American AI in retail market. The analysis focuses on key performance indicators (KPIs) for each segment:
- Channel: Omnichannel, Brick and Mortar, Pure-play Online Retailers. The omnichannel segment is projected to dominate due to its ability to provide a seamless and integrated shopping experience across different platforms.
- Solution: Software, Cloud Service. Cloud-based solutions are expected to be the major driver, offering flexibility and scalability.
- Application: Apparel and Footwear, Food and Grocery, Electronics and Home Appliances, Home Improvement, Other Applications. Apparel and footwear are predicted to hold a large market share initially, driven by the demand for personalized recommendations and visual search.
- Technology: Machine Learning, Natural Language Processing, Chatbots, Image and Video Analytics, Swarm Intelligence. Machine learning and image analytics are foreseen as dominant technologies due to their ability to improve various facets of the retail experience.
The report analyzes the factors driving the dominance of these segments, including economic policies favoring technological innovation, investment in digital infrastructure, and consumer preferences for convenience and personalization. Detailed geographic analysis includes a breakdown by state or region, identifying leading states based on specific market dynamics such as technological maturity, consumer spending patterns, and regulatory environment.
America AI in the Retail Market Product Innovations
This section highlights recent product innovations and their impact on the market. Key advancements include the development of sophisticated recommendation engines, AI-powered chatbots with enhanced natural language processing capabilities, and advanced image recognition technologies for visual search and inventory management. These innovations enhance customer experience, optimize operational efficiency, and create new revenue streams for retailers. The competitive advantage lies in the ability to deliver highly accurate, personalized, and seamless customer interactions across multiple channels.
Report Scope & Segmentation Analysis
This report offers a granular segmentation analysis of the American AI in retail market, covering the following key aspects:
- Channel: Omnichannel (XX Million), Brick and Mortar (XX Million), Pure-play Online Retailers (XX Million) – growth projections are included for each channel.
- Solution: Software (XX Million), Cloud Service (XX Million) – market sizes and competitive dynamics for each solution type are analyzed.
- Application: Apparel and Footwear (XX Million), Food and Grocery (XX Million), Electronics and Home Appliances (XX Million), Home Improvement (XX Million), Other Applications (XX Million) – each application's growth trajectory and competitive landscape are examined.
- Technology: Machine Learning (XX Million), Natural Language Processing (XX Million), Chatbots (XX Million), Image and Video Analytics (XX Million), Swarm Intelligence (XX Million) – the report details market size and growth for each technology.
The competitive dynamics within each segment are also evaluated.
Key Drivers of America AI in the Retail Market Growth
The growth of the American AI in retail market is driven by several factors. Technological advancements, specifically in machine learning, natural language processing, and computer vision, are enabling more sophisticated and personalized customer experiences. The increasing adoption of e-commerce and omnichannel strategies necessitates AI solutions for enhanced efficiency and customer engagement. Government initiatives supporting digital transformation and the availability of vast amounts of customer data further accelerate market growth. Favorable economic conditions also contribute positively to the market's expansion.
Challenges in the America AI in the Retail Market Sector
Several challenges impede the growth of the American AI in retail market. Data security and privacy concerns are paramount, demanding robust security protocols and adherence to regulations like CCPA. The high cost of implementing and maintaining AI solutions can be a barrier for smaller retailers. Integrating AI systems with existing infrastructure can also prove complex and time-consuming, potentially hindering wider adoption. Furthermore, the need for skilled AI professionals creates a talent gap that needs to be addressed. Finally, competitive pressure and the rapid pace of technological change necessitate continuous innovation and adaptation.
Emerging Opportunities in America AI in the Retail Market
The American AI in retail market presents significant opportunities. The growing adoption of augmented and virtual reality (AR/VR) technologies in retail offers new avenues for engaging customers and enhancing product discovery. The rise of voice commerce and personalized recommendations driven by AI creates opportunities for increased sales and customer loyalty. Expansion into emerging market segments, such as personalized healthcare products and AI-powered supply chain optimization, presents promising growth prospects. Furthermore, the use of AI for fraud detection and risk management creates a large market opportunity.
Leading Players in the America AI in the Retail Market Market
- ViSenze Pte Ltd
- IBM Corporation
- Sentient Technologies Holdings Limited
- Google LLC
- Salesforce com Inc
- Microsoft Corporation
- Amazon Web Services Inc
- Sophos Inc (Thoma Bravo)
- Oracle Corporation
- SAP SE
Key Developments in America AI in the Retail Market Industry
- January 2023: Company X launches a new AI-powered recommendation engine, significantly boosting customer engagement.
- March 2023: Company Y acquires Company Z, expanding its AI capabilities in the retail sector.
- June 2024: A new regulation on data privacy is introduced, impacting the market's competitive landscape.
- September 2024: A major retailer integrates AI-powered chatbots into its customer service platform.
Future Outlook for America AI in the Retail Market Market
The future of the American AI in retail market looks bright. Continued advancements in AI technologies and rising consumer adoption of digital channels will fuel market growth. Strategic partnerships between retailers and AI technology providers will drive innovation. Focus on enhancing customer experience through personalized recommendations, seamless omnichannel experiences, and improved supply chain efficiency will shape the future of the market. The ongoing development of ethical and responsible AI practices will be critical for sustained growth and consumer trust.
America AI in the Retail Market Segmentation
-
1. Channel
- 1.1. Omnichannel
- 1.2. Brick and Mortar
- 1.3. Pure-play Online Retailers
-
2. Solution
-
2.1. Software
- 2.1.1. On Premise
- 2.1.2. Cloud
- 2.2. Service
-
2.1. Software
-
3. Application
- 3.1. Apparel and Footwear
- 3.2. Food and Grocery
- 3.3. Electronics and Home Appliances
- 3.4. Home Improvement
- 3.5. Other Applications
-
4. Technology
- 4.1. Machine Learning
- 4.2. Natural Language Processing
- 4.3. Chatbots
- 4.4. Image and Video Analytics
- 4.5. Swarm Intelligence
America AI in the Retail Market Segmentation By Geography
-
1. North America
- 1.1. United States
- 1.2. Canada
- 1.3. Mexico
-
2. South America
- 2.1. Brazil
- 2.2. Argentina
- 2.3. Rest of South America
-
3. Europe
- 3.1. United Kingdom
- 3.2. Germany
- 3.3. France
- 3.4. Italy
- 3.5. Spain
- 3.6. Russia
- 3.7. Benelux
- 3.8. Nordics
- 3.9. Rest of Europe
-
4. Middle East & Africa
- 4.1. Turkey
- 4.2. Israel
- 4.3. GCC
- 4.4. North Africa
- 4.5. South Africa
- 4.6. Rest of Middle East & Africa
-
5. Asia Pacific
- 5.1. China
- 5.2. India
- 5.3. Japan
- 5.4. South Korea
- 5.5. ASEAN
- 5.6. Oceania
- 5.7. Rest of Asia Pacific
America AI in the Retail Market REPORT HIGHLIGHTS
| Aspects | Details |
|---|---|
| Study Period | 2019-2033 |
| Base Year | 2024 |
| Estimated Year | 2025 |
| Forecast Period | 2025-2033 |
| Historical Period | 2019-2024 |
| Growth Rate | CAGR of 30.00% from 2019-2033 |
| Segmentation |
|
Table of Contents
- 1. Introduction
- 1.1. Research Scope
- 1.2. Market Segmentation
- 1.3. Research Methodology
- 1.4. Definitions and Assumptions
- 2. Executive Summary
- 2.1. Introduction
- 3. Market Dynamics
- 3.1. Introduction
- 3.2. Market Drivers
- 3.2.1 ; Hardware Advancement Acting as a Key Enabler for AI in Retail; Disruptive Developments in Retail
- 3.2.2 including AR
- 3.2.3 VR
- 3.2.4 IOT
- 3.2.5 and New Metrics; Rise of AI First Organizations; Need for Efficiency in Supply Chain Optimization
- 3.3. Market Restrains
- 3.3.1 ; Lack of Professionals
- 3.3.2 as well as In-house Knowledge for Cultural Readiness
- 3.4. Market Trends
- 3.4.1. Machine Learning Technology is Expected to Grow Siginificantly
- 4. Market Factor Analysis
- 4.1. Porters Five Forces
- 4.2. Supply/Value Chain
- 4.3. PESTEL analysis
- 4.4. Market Entropy
- 4.5. Patent/Trademark Analysis
- 5. Global America AI in the Retail Market Analysis, Insights and Forecast, 2019-2031
- 5.1. Market Analysis, Insights and Forecast - by Channel
- 5.1.1. Omnichannel
- 5.1.2. Brick and Mortar
- 5.1.3. Pure-play Online Retailers
- 5.2. Market Analysis, Insights and Forecast - by Solution
- 5.2.1. Software
- 5.2.1.1. On Premise
- 5.2.1.2. Cloud
- 5.2.2. Service
- 5.2.1. Software
- 5.3. Market Analysis, Insights and Forecast - by Application
- 5.3.1. Apparel and Footwear
- 5.3.2. Food and Grocery
- 5.3.3. Electronics and Home Appliances
- 5.3.4. Home Improvement
- 5.3.5. Other Applications
- 5.4. Market Analysis, Insights and Forecast - by Technology
- 5.4.1. Machine Learning
- 5.4.2. Natural Language Processing
- 5.4.3. Chatbots
- 5.4.4. Image and Video Analytics
- 5.4.5. Swarm Intelligence
- 5.5. Market Analysis, Insights and Forecast - by Region
- 5.5.1. North America
- 5.5.2. South America
- 5.5.3. Europe
- 5.5.4. Middle East & Africa
- 5.5.5. Asia Pacific
- 5.1. Market Analysis, Insights and Forecast - by Channel
- 6. North America America AI in the Retail Market Analysis, Insights and Forecast, 2019-2031
- 6.1. Market Analysis, Insights and Forecast - by Channel
- 6.1.1. Omnichannel
- 6.1.2. Brick and Mortar
- 6.1.3. Pure-play Online Retailers
- 6.2. Market Analysis, Insights and Forecast - by Solution
- 6.2.1. Software
- 6.2.1.1. On Premise
- 6.2.1.2. Cloud
- 6.2.2. Service
- 6.2.1. Software
- 6.3. Market Analysis, Insights and Forecast - by Application
- 6.3.1. Apparel and Footwear
- 6.3.2. Food and Grocery
- 6.3.3. Electronics and Home Appliances
- 6.3.4. Home Improvement
- 6.3.5. Other Applications
- 6.4. Market Analysis, Insights and Forecast - by Technology
- 6.4.1. Machine Learning
- 6.4.2. Natural Language Processing
- 6.4.3. Chatbots
- 6.4.4. Image and Video Analytics
- 6.4.5. Swarm Intelligence
- 6.1. Market Analysis, Insights and Forecast - by Channel
- 7. South America America AI in the Retail Market Analysis, Insights and Forecast, 2019-2031
- 7.1. Market Analysis, Insights and Forecast - by Channel
- 7.1.1. Omnichannel
- 7.1.2. Brick and Mortar
- 7.1.3. Pure-play Online Retailers
- 7.2. Market Analysis, Insights and Forecast - by Solution
- 7.2.1. Software
- 7.2.1.1. On Premise
- 7.2.1.2. Cloud
- 7.2.2. Service
- 7.2.1. Software
- 7.3. Market Analysis, Insights and Forecast - by Application
- 7.3.1. Apparel and Footwear
- 7.3.2. Food and Grocery
- 7.3.3. Electronics and Home Appliances
- 7.3.4. Home Improvement
- 7.3.5. Other Applications
- 7.4. Market Analysis, Insights and Forecast - by Technology
- 7.4.1. Machine Learning
- 7.4.2. Natural Language Processing
- 7.4.3. Chatbots
- 7.4.4. Image and Video Analytics
- 7.4.5. Swarm Intelligence
- 7.1. Market Analysis, Insights and Forecast - by Channel
- 8. Europe America AI in the Retail Market Analysis, Insights and Forecast, 2019-2031
- 8.1. Market Analysis, Insights and Forecast - by Channel
- 8.1.1. Omnichannel
- 8.1.2. Brick and Mortar
- 8.1.3. Pure-play Online Retailers
- 8.2. Market Analysis, Insights and Forecast - by Solution
- 8.2.1. Software
- 8.2.1.1. On Premise
- 8.2.1.2. Cloud
- 8.2.2. Service
- 8.2.1. Software
- 8.3. Market Analysis, Insights and Forecast - by Application
- 8.3.1. Apparel and Footwear
- 8.3.2. Food and Grocery
- 8.3.3. Electronics and Home Appliances
- 8.3.4. Home Improvement
- 8.3.5. Other Applications
- 8.4. Market Analysis, Insights and Forecast - by Technology
- 8.4.1. Machine Learning
- 8.4.2. Natural Language Processing
- 8.4.3. Chatbots
- 8.4.4. Image and Video Analytics
- 8.4.5. Swarm Intelligence
- 8.1. Market Analysis, Insights and Forecast - by Channel
- 9. Middle East & Africa America AI in the Retail Market Analysis, Insights and Forecast, 2019-2031
- 9.1. Market Analysis, Insights and Forecast - by Channel
- 9.1.1. Omnichannel
- 9.1.2. Brick and Mortar
- 9.1.3. Pure-play Online Retailers
- 9.2. Market Analysis, Insights and Forecast - by Solution
- 9.2.1. Software
- 9.2.1.1. On Premise
- 9.2.1.2. Cloud
- 9.2.2. Service
- 9.2.1. Software
- 9.3. Market Analysis, Insights and Forecast - by Application
- 9.3.1. Apparel and Footwear
- 9.3.2. Food and Grocery
- 9.3.3. Electronics and Home Appliances
- 9.3.4. Home Improvement
- 9.3.5. Other Applications
- 9.4. Market Analysis, Insights and Forecast - by Technology
- 9.4.1. Machine Learning
- 9.4.2. Natural Language Processing
- 9.4.3. Chatbots
- 9.4.4. Image and Video Analytics
- 9.4.5. Swarm Intelligence
- 9.1. Market Analysis, Insights and Forecast - by Channel
- 10. Asia Pacific America AI in the Retail Market Analysis, Insights and Forecast, 2019-2031
- 10.1. Market Analysis, Insights and Forecast - by Channel
- 10.1.1. Omnichannel
- 10.1.2. Brick and Mortar
- 10.1.3. Pure-play Online Retailers
- 10.2. Market Analysis, Insights and Forecast - by Solution
- 10.2.1. Software
- 10.2.1.1. On Premise
- 10.2.1.2. Cloud
- 10.2.2. Service
- 10.2.1. Software
- 10.3. Market Analysis, Insights and Forecast - by Application
- 10.3.1. Apparel and Footwear
- 10.3.2. Food and Grocery
- 10.3.3. Electronics and Home Appliances
- 10.3.4. Home Improvement
- 10.3.5. Other Applications
- 10.4. Market Analysis, Insights and Forecast - by Technology
- 10.4.1. Machine Learning
- 10.4.2. Natural Language Processing
- 10.4.3. Chatbots
- 10.4.4. Image and Video Analytics
- 10.4.5. Swarm Intelligence
- 10.1. Market Analysis, Insights and Forecast - by Channel
- 11. North America America AI in the Retail Market Analysis, Insights and Forecast, 2019-2031
- 11.1. Market Analysis, Insights and Forecast - By Country/Sub-region
- 11.1.1.
- 12. Europe America AI in the Retail Market Analysis, Insights and Forecast, 2019-2031
- 12.1. Market Analysis, Insights and Forecast - By Country/Sub-region
- 12.1.1.
- 13. Asia Pacific America AI in the Retail Market Analysis, Insights and Forecast, 2019-2031
- 13.1. Market Analysis, Insights and Forecast - By Country/Sub-region
- 13.1.1.
- 14. Latin America America AI in the Retail Market Analysis, Insights and Forecast, 2019-2031
- 14.1. Market Analysis, Insights and Forecast - By Country/Sub-region
- 14.1.1.
- 15. Middle East and Africa America AI in the Retail Market Analysis, Insights and Forecast, 2019-2031
- 15.1. Market Analysis, Insights and Forecast - By Country/Sub-region
- 15.1.1.
- 16. Competitive Analysis
- 16.1. Global Market Share Analysis 2024
- 16.2. Company Profiles
- 16.2.1 ViSenze Pte Ltd
- 16.2.1.1. Overview
- 16.2.1.2. Products
- 16.2.1.3. SWOT Analysis
- 16.2.1.4. Recent Developments
- 16.2.1.5. Financials (Based on Availability)
- 16.2.2 IBM Corporation
- 16.2.2.1. Overview
- 16.2.2.2. Products
- 16.2.2.3. SWOT Analysis
- 16.2.2.4. Recent Developments
- 16.2.2.5. Financials (Based on Availability)
- 16.2.3 Sentient Technologies Holdings Limited
- 16.2.3.1. Overview
- 16.2.3.2. Products
- 16.2.3.3. SWOT Analysis
- 16.2.3.4. Recent Developments
- 16.2.3.5. Financials (Based on Availability)
- 16.2.4 Google LLC
- 16.2.4.1. Overview
- 16.2.4.2. Products
- 16.2.4.3. SWOT Analysis
- 16.2.4.4. Recent Developments
- 16.2.4.5. Financials (Based on Availability)
- 16.2.5 Salesforce com Inc
- 16.2.5.1. Overview
- 16.2.5.2. Products
- 16.2.5.3. SWOT Analysis
- 16.2.5.4. Recent Developments
- 16.2.5.5. Financials (Based on Availability)
- 16.2.6 Microsoft Corporation
- 16.2.6.1. Overview
- 16.2.6.2. Products
- 16.2.6.3. SWOT Analysis
- 16.2.6.4. Recent Developments
- 16.2.6.5. Financials (Based on Availability)
- 16.2.7 Amazon Web Services Inc
- 16.2.7.1. Overview
- 16.2.7.2. Products
- 16.2.7.3. SWOT Analysis
- 16.2.7.4. Recent Developments
- 16.2.7.5. Financials (Based on Availability)
- 16.2.8 Sophos Inc (Thoma Bravo)
- 16.2.8.1. Overview
- 16.2.8.2. Products
- 16.2.8.3. SWOT Analysis
- 16.2.8.4. Recent Developments
- 16.2.8.5. Financials (Based on Availability)
- 16.2.9 Oracle Corporation
- 16.2.9.1. Overview
- 16.2.9.2. Products
- 16.2.9.3. SWOT Analysis
- 16.2.9.4. Recent Developments
- 16.2.9.5. Financials (Based on Availability)
- 16.2.10 SAP SE
- 16.2.10.1. Overview
- 16.2.10.2. Products
- 16.2.10.3. SWOT Analysis
- 16.2.10.4. Recent Developments
- 16.2.10.5. Financials (Based on Availability)
- 16.2.1 ViSenze Pte Ltd
List of Figures
- Figure 1: Global America AI in the Retail Market Revenue Breakdown (Million, %) by Region 2024 & 2032
- Figure 2: Global America AI in the Retail Market Volume Breakdown (K Unit, %) by Region 2024 & 2032
- Figure 3: North America America AI in the Retail Market Revenue (Million), by Country 2024 & 2032
- Figure 4: North America America AI in the Retail Market Volume (K Unit), by Country 2024 & 2032
- Figure 5: North America America AI in the Retail Market Revenue Share (%), by Country 2024 & 2032
- Figure 6: North America America AI in the Retail Market Volume Share (%), by Country 2024 & 2032
- Figure 7: Europe America AI in the Retail Market Revenue (Million), by Country 2024 & 2032
- Figure 8: Europe America AI in the Retail Market Volume (K Unit), by Country 2024 & 2032
- Figure 9: Europe America AI in the Retail Market Revenue Share (%), by Country 2024 & 2032
- Figure 10: Europe America AI in the Retail Market Volume Share (%), by Country 2024 & 2032
- Figure 11: Asia Pacific America AI in the Retail Market Revenue (Million), by Country 2024 & 2032
- Figure 12: Asia Pacific America AI in the Retail Market Volume (K Unit), by Country 2024 & 2032
- Figure 13: Asia Pacific America AI in the Retail Market Revenue Share (%), by Country 2024 & 2032
- Figure 14: Asia Pacific America AI in the Retail Market Volume Share (%), by Country 2024 & 2032
- Figure 15: Latin America America AI in the Retail Market Revenue (Million), by Country 2024 & 2032
- Figure 16: Latin America America AI in the Retail Market Volume (K Unit), by Country 2024 & 2032
- Figure 17: Latin America America AI in the Retail Market Revenue Share (%), by Country 2024 & 2032
- Figure 18: Latin America America AI in the Retail Market Volume Share (%), by Country 2024 & 2032
- Figure 19: Middle East and Africa America AI in the Retail Market Revenue (Million), by Country 2024 & 2032
- Figure 20: Middle East and Africa America AI in the Retail Market Volume (K Unit), by Country 2024 & 2032
- Figure 21: Middle East and Africa America AI in the Retail Market Revenue Share (%), by Country 2024 & 2032
- Figure 22: Middle East and Africa America AI in the Retail Market Volume Share (%), by Country 2024 & 2032
- Figure 23: North America America AI in the Retail Market Revenue (Million), by Channel 2024 & 2032
- Figure 24: North America America AI in the Retail Market Volume (K Unit), by Channel 2024 & 2032
- Figure 25: North America America AI in the Retail Market Revenue Share (%), by Channel 2024 & 2032
- Figure 26: North America America AI in the Retail Market Volume Share (%), by Channel 2024 & 2032
- Figure 27: North America America AI in the Retail Market Revenue (Million), by Solution 2024 & 2032
- Figure 28: North America America AI in the Retail Market Volume (K Unit), by Solution 2024 & 2032
- Figure 29: North America America AI in the Retail Market Revenue Share (%), by Solution 2024 & 2032
- Figure 30: North America America AI in the Retail Market Volume Share (%), by Solution 2024 & 2032
- Figure 31: North America America AI in the Retail Market Revenue (Million), by Application 2024 & 2032
- Figure 32: North America America AI in the Retail Market Volume (K Unit), by Application 2024 & 2032
- Figure 33: North America America AI in the Retail Market Revenue Share (%), by Application 2024 & 2032
- Figure 34: North America America AI in the Retail Market Volume Share (%), by Application 2024 & 2032
- Figure 35: North America America AI in the Retail Market Revenue (Million), by Technology 2024 & 2032
- Figure 36: North America America AI in the Retail Market Volume (K Unit), by Technology 2024 & 2032
- Figure 37: North America America AI in the Retail Market Revenue Share (%), by Technology 2024 & 2032
- Figure 38: North America America AI in the Retail Market Volume Share (%), by Technology 2024 & 2032
- Figure 39: North America America AI in the Retail Market Revenue (Million), by Country 2024 & 2032
- Figure 40: North America America AI in the Retail Market Volume (K Unit), by Country 2024 & 2032
- Figure 41: North America America AI in the Retail Market Revenue Share (%), by Country 2024 & 2032
- Figure 42: North America America AI in the Retail Market Volume Share (%), by Country 2024 & 2032
- Figure 43: South America America AI in the Retail Market Revenue (Million), by Channel 2024 & 2032
- Figure 44: South America America AI in the Retail Market Volume (K Unit), by Channel 2024 & 2032
- Figure 45: South America America AI in the Retail Market Revenue Share (%), by Channel 2024 & 2032
- Figure 46: South America America AI in the Retail Market Volume Share (%), by Channel 2024 & 2032
- Figure 47: South America America AI in the Retail Market Revenue (Million), by Solution 2024 & 2032
- Figure 48: South America America AI in the Retail Market Volume (K Unit), by Solution 2024 & 2032
- Figure 49: South America America AI in the Retail Market Revenue Share (%), by Solution 2024 & 2032
- Figure 50: South America America AI in the Retail Market Volume Share (%), by Solution 2024 & 2032
- Figure 51: South America America AI in the Retail Market Revenue (Million), by Application 2024 & 2032
- Figure 52: South America America AI in the Retail Market Volume (K Unit), by Application 2024 & 2032
- Figure 53: South America America AI in the Retail Market Revenue Share (%), by Application 2024 & 2032
- Figure 54: South America America AI in the Retail Market Volume Share (%), by Application 2024 & 2032
- Figure 55: South America America AI in the Retail Market Revenue (Million), by Technology 2024 & 2032
- Figure 56: South America America AI in the Retail Market Volume (K Unit), by Technology 2024 & 2032
- Figure 57: South America America AI in the Retail Market Revenue Share (%), by Technology 2024 & 2032
- Figure 58: South America America AI in the Retail Market Volume Share (%), by Technology 2024 & 2032
- Figure 59: South America America AI in the Retail Market Revenue (Million), by Country 2024 & 2032
- Figure 60: South America America AI in the Retail Market Volume (K Unit), by Country 2024 & 2032
- Figure 61: South America America AI in the Retail Market Revenue Share (%), by Country 2024 & 2032
- Figure 62: South America America AI in the Retail Market Volume Share (%), by Country 2024 & 2032
- Figure 63: Europe America AI in the Retail Market Revenue (Million), by Channel 2024 & 2032
- Figure 64: Europe America AI in the Retail Market Volume (K Unit), by Channel 2024 & 2032
- Figure 65: Europe America AI in the Retail Market Revenue Share (%), by Channel 2024 & 2032
- Figure 66: Europe America AI in the Retail Market Volume Share (%), by Channel 2024 & 2032
- Figure 67: Europe America AI in the Retail Market Revenue (Million), by Solution 2024 & 2032
- Figure 68: Europe America AI in the Retail Market Volume (K Unit), by Solution 2024 & 2032
- Figure 69: Europe America AI in the Retail Market Revenue Share (%), by Solution 2024 & 2032
- Figure 70: Europe America AI in the Retail Market Volume Share (%), by Solution 2024 & 2032
- Figure 71: Europe America AI in the Retail Market Revenue (Million), by Application 2024 & 2032
- Figure 72: Europe America AI in the Retail Market Volume (K Unit), by Application 2024 & 2032
- Figure 73: Europe America AI in the Retail Market Revenue Share (%), by Application 2024 & 2032
- Figure 74: Europe America AI in the Retail Market Volume Share (%), by Application 2024 & 2032
- Figure 75: Europe America AI in the Retail Market Revenue (Million), by Technology 2024 & 2032
- Figure 76: Europe America AI in the Retail Market Volume (K Unit), by Technology 2024 & 2032
- Figure 77: Europe America AI in the Retail Market Revenue Share (%), by Technology 2024 & 2032
- Figure 78: Europe America AI in the Retail Market Volume Share (%), by Technology 2024 & 2032
- Figure 79: Europe America AI in the Retail Market Revenue (Million), by Country 2024 & 2032
- Figure 80: Europe America AI in the Retail Market Volume (K Unit), by Country 2024 & 2032
- Figure 81: Europe America AI in the Retail Market Revenue Share (%), by Country 2024 & 2032
- Figure 82: Europe America AI in the Retail Market Volume Share (%), by Country 2024 & 2032
- Figure 83: Middle East & Africa America AI in the Retail Market Revenue (Million), by Channel 2024 & 2032
- Figure 84: Middle East & Africa America AI in the Retail Market Volume (K Unit), by Channel 2024 & 2032
- Figure 85: Middle East & Africa America AI in the Retail Market Revenue Share (%), by Channel 2024 & 2032
- Figure 86: Middle East & Africa America AI in the Retail Market Volume Share (%), by Channel 2024 & 2032
- Figure 87: Middle East & Africa America AI in the Retail Market Revenue (Million), by Solution 2024 & 2032
- Figure 88: Middle East & Africa America AI in the Retail Market Volume (K Unit), by Solution 2024 & 2032
- Figure 89: Middle East & Africa America AI in the Retail Market Revenue Share (%), by Solution 2024 & 2032
- Figure 90: Middle East & Africa America AI in the Retail Market Volume Share (%), by Solution 2024 & 2032
- Figure 91: Middle East & Africa America AI in the Retail Market Revenue (Million), by Application 2024 & 2032
- Figure 92: Middle East & Africa America AI in the Retail Market Volume (K Unit), by Application 2024 & 2032
- Figure 93: Middle East & Africa America AI in the Retail Market Revenue Share (%), by Application 2024 & 2032
- Figure 94: Middle East & Africa America AI in the Retail Market Volume Share (%), by Application 2024 & 2032
- Figure 95: Middle East & Africa America AI in the Retail Market Revenue (Million), by Technology 2024 & 2032
- Figure 96: Middle East & Africa America AI in the Retail Market Volume (K Unit), by Technology 2024 & 2032
- Figure 97: Middle East & Africa America AI in the Retail Market Revenue Share (%), by Technology 2024 & 2032
- Figure 98: Middle East & Africa America AI in the Retail Market Volume Share (%), by Technology 2024 & 2032
- Figure 99: Middle East & Africa America AI in the Retail Market Revenue (Million), by Country 2024 & 2032
- Figure 100: Middle East & Africa America AI in the Retail Market Volume (K Unit), by Country 2024 & 2032
- Figure 101: Middle East & Africa America AI in the Retail Market Revenue Share (%), by Country 2024 & 2032
- Figure 102: Middle East & Africa America AI in the Retail Market Volume Share (%), by Country 2024 & 2032
- Figure 103: Asia Pacific America AI in the Retail Market Revenue (Million), by Channel 2024 & 2032
- Figure 104: Asia Pacific America AI in the Retail Market Volume (K Unit), by Channel 2024 & 2032
- Figure 105: Asia Pacific America AI in the Retail Market Revenue Share (%), by Channel 2024 & 2032
- Figure 106: Asia Pacific America AI in the Retail Market Volume Share (%), by Channel 2024 & 2032
- Figure 107: Asia Pacific America AI in the Retail Market Revenue (Million), by Solution 2024 & 2032
- Figure 108: Asia Pacific America AI in the Retail Market Volume (K Unit), by Solution 2024 & 2032
- Figure 109: Asia Pacific America AI in the Retail Market Revenue Share (%), by Solution 2024 & 2032
- Figure 110: Asia Pacific America AI in the Retail Market Volume Share (%), by Solution 2024 & 2032
- Figure 111: Asia Pacific America AI in the Retail Market Revenue (Million), by Application 2024 & 2032
- Figure 112: Asia Pacific America AI in the Retail Market Volume (K Unit), by Application 2024 & 2032
- Figure 113: Asia Pacific America AI in the Retail Market Revenue Share (%), by Application 2024 & 2032
- Figure 114: Asia Pacific America AI in the Retail Market Volume Share (%), by Application 2024 & 2032
- Figure 115: Asia Pacific America AI in the Retail Market Revenue (Million), by Technology 2024 & 2032
- Figure 116: Asia Pacific America AI in the Retail Market Volume (K Unit), by Technology 2024 & 2032
- Figure 117: Asia Pacific America AI in the Retail Market Revenue Share (%), by Technology 2024 & 2032
- Figure 118: Asia Pacific America AI in the Retail Market Volume Share (%), by Technology 2024 & 2032
- Figure 119: Asia Pacific America AI in the Retail Market Revenue (Million), by Country 2024 & 2032
- Figure 120: Asia Pacific America AI in the Retail Market Volume (K Unit), by Country 2024 & 2032
- Figure 121: Asia Pacific America AI in the Retail Market Revenue Share (%), by Country 2024 & 2032
- Figure 122: Asia Pacific America AI in the Retail Market Volume Share (%), by Country 2024 & 2032
List of Tables
- Table 1: Global America AI in the Retail Market Revenue Million Forecast, by Region 2019 & 2032
- Table 2: Global America AI in the Retail Market Volume K Unit Forecast, by Region 2019 & 2032
- Table 3: Global America AI in the Retail Market Revenue Million Forecast, by Channel 2019 & 2032
- Table 4: Global America AI in the Retail Market Volume K Unit Forecast, by Channel 2019 & 2032
- Table 5: Global America AI in the Retail Market Revenue Million Forecast, by Solution 2019 & 2032
- Table 6: Global America AI in the Retail Market Volume K Unit Forecast, by Solution 2019 & 2032
- Table 7: Global America AI in the Retail Market Revenue Million Forecast, by Application 2019 & 2032
- Table 8: Global America AI in the Retail Market Volume K Unit Forecast, by Application 2019 & 2032
- Table 9: Global America AI in the Retail Market Revenue Million Forecast, by Technology 2019 & 2032
- Table 10: Global America AI in the Retail Market Volume K Unit Forecast, by Technology 2019 & 2032
- Table 11: Global America AI in the Retail Market Revenue Million Forecast, by Region 2019 & 2032
- Table 12: Global America AI in the Retail Market Volume K Unit Forecast, by Region 2019 & 2032
- Table 13: Global America AI in the Retail Market Revenue Million Forecast, by Country 2019 & 2032
- Table 14: Global America AI in the Retail Market Volume K Unit Forecast, by Country 2019 & 2032
- Table 15: America AI in the Retail Market Revenue (Million) Forecast, by Application 2019 & 2032
- Table 16: America AI in the Retail Market Volume (K Unit) Forecast, by Application 2019 & 2032
- Table 17: Global America AI in the Retail Market Revenue Million Forecast, by Country 2019 & 2032
- Table 18: Global America AI in the Retail Market Volume K Unit Forecast, by Country 2019 & 2032
- Table 19: America AI in the Retail Market Revenue (Million) Forecast, by Application 2019 & 2032
- Table 20: America AI in the Retail Market Volume (K Unit) Forecast, by Application 2019 & 2032
- Table 21: Global America AI in the Retail Market Revenue Million Forecast, by Country 2019 & 2032
- Table 22: Global America AI in the Retail Market Volume K Unit Forecast, by Country 2019 & 2032
- Table 23: America AI in the Retail Market Revenue (Million) Forecast, by Application 2019 & 2032
- Table 24: America AI in the Retail Market Volume (K Unit) Forecast, by Application 2019 & 2032
- Table 25: Global America AI in the Retail Market Revenue Million Forecast, by Country 2019 & 2032
- Table 26: Global America AI in the Retail Market Volume K Unit Forecast, by Country 2019 & 2032
- Table 27: America AI in the Retail Market Revenue (Million) Forecast, by Application 2019 & 2032
- Table 28: America AI in the Retail Market Volume (K Unit) Forecast, by Application 2019 & 2032
- Table 29: Global America AI in the Retail Market Revenue Million Forecast, by Country 2019 & 2032
- Table 30: Global America AI in the Retail Market Volume K Unit Forecast, by Country 2019 & 2032
- Table 31: America AI in the Retail Market Revenue (Million) Forecast, by Application 2019 & 2032
- Table 32: America AI in the Retail Market Volume (K Unit) Forecast, by Application 2019 & 2032
- Table 33: Global America AI in the Retail Market Revenue Million Forecast, by Channel 2019 & 2032
- Table 34: Global America AI in the Retail Market Volume K Unit Forecast, by Channel 2019 & 2032
- Table 35: Global America AI in the Retail Market Revenue Million Forecast, by Solution 2019 & 2032
- Table 36: Global America AI in the Retail Market Volume K Unit Forecast, by Solution 2019 & 2032
- Table 37: Global America AI in the Retail Market Revenue Million Forecast, by Application 2019 & 2032
- Table 38: Global America AI in the Retail Market Volume K Unit Forecast, by Application 2019 & 2032
- Table 39: Global America AI in the Retail Market Revenue Million Forecast, by Technology 2019 & 2032
- Table 40: Global America AI in the Retail Market Volume K Unit Forecast, by Technology 2019 & 2032
- Table 41: Global America AI in the Retail Market Revenue Million Forecast, by Country 2019 & 2032
- Table 42: Global America AI in the Retail Market Volume K Unit Forecast, by Country 2019 & 2032
- Table 43: United States America AI in the Retail Market Revenue (Million) Forecast, by Application 2019 & 2032
- Table 44: United States America AI in the Retail Market Volume (K Unit) Forecast, by Application 2019 & 2032
- Table 45: Canada America AI in the Retail Market Revenue (Million) Forecast, by Application 2019 & 2032
- Table 46: Canada America AI in the Retail Market Volume (K Unit) Forecast, by Application 2019 & 2032
- Table 47: Mexico America AI in the Retail Market Revenue (Million) Forecast, by Application 2019 & 2032
- Table 48: Mexico America AI in the Retail Market Volume (K Unit) Forecast, by Application 2019 & 2032
- Table 49: Global America AI in the Retail Market Revenue Million Forecast, by Channel 2019 & 2032
- Table 50: Global America AI in the Retail Market Volume K Unit Forecast, by Channel 2019 & 2032
- Table 51: Global America AI in the Retail Market Revenue Million Forecast, by Solution 2019 & 2032
- Table 52: Global America AI in the Retail Market Volume K Unit Forecast, by Solution 2019 & 2032
- Table 53: Global America AI in the Retail Market Revenue Million Forecast, by Application 2019 & 2032
- Table 54: Global America AI in the Retail Market Volume K Unit Forecast, by Application 2019 & 2032
- Table 55: Global America AI in the Retail Market Revenue Million Forecast, by Technology 2019 & 2032
- Table 56: Global America AI in the Retail Market Volume K Unit Forecast, by Technology 2019 & 2032
- Table 57: Global America AI in the Retail Market Revenue Million Forecast, by Country 2019 & 2032
- Table 58: Global America AI in the Retail Market Volume K Unit Forecast, by Country 2019 & 2032
- Table 59: Brazil America AI in the Retail Market Revenue (Million) Forecast, by Application 2019 & 2032
- Table 60: Brazil America AI in the Retail Market Volume (K Unit) Forecast, by Application 2019 & 2032
- Table 61: Argentina America AI in the Retail Market Revenue (Million) Forecast, by Application 2019 & 2032
- Table 62: Argentina America AI in the Retail Market Volume (K Unit) Forecast, by Application 2019 & 2032
- Table 63: Rest of South America America AI in the Retail Market Revenue (Million) Forecast, by Application 2019 & 2032
- Table 64: Rest of South America America AI in the Retail Market Volume (K Unit) Forecast, by Application 2019 & 2032
- Table 65: Global America AI in the Retail Market Revenue Million Forecast, by Channel 2019 & 2032
- Table 66: Global America AI in the Retail Market Volume K Unit Forecast, by Channel 2019 & 2032
- Table 67: Global America AI in the Retail Market Revenue Million Forecast, by Solution 2019 & 2032
- Table 68: Global America AI in the Retail Market Volume K Unit Forecast, by Solution 2019 & 2032
- Table 69: Global America AI in the Retail Market Revenue Million Forecast, by Application 2019 & 2032
- Table 70: Global America AI in the Retail Market Volume K Unit Forecast, by Application 2019 & 2032
- Table 71: Global America AI in the Retail Market Revenue Million Forecast, by Technology 2019 & 2032
- Table 72: Global America AI in the Retail Market Volume K Unit Forecast, by Technology 2019 & 2032
- Table 73: Global America AI in the Retail Market Revenue Million Forecast, by Country 2019 & 2032
- Table 74: Global America AI in the Retail Market Volume K Unit Forecast, by Country 2019 & 2032
- Table 75: United Kingdom America AI in the Retail Market Revenue (Million) Forecast, by Application 2019 & 2032
- Table 76: United Kingdom America AI in the Retail Market Volume (K Unit) Forecast, by Application 2019 & 2032
- Table 77: Germany America AI in the Retail Market Revenue (Million) Forecast, by Application 2019 & 2032
- Table 78: Germany America AI in the Retail Market Volume (K Unit) Forecast, by Application 2019 & 2032
- Table 79: France America AI in the Retail Market Revenue (Million) Forecast, by Application 2019 & 2032
- Table 80: France America AI in the Retail Market Volume (K Unit) Forecast, by Application 2019 & 2032
- Table 81: Italy America AI in the Retail Market Revenue (Million) Forecast, by Application 2019 & 2032
- Table 82: Italy America AI in the Retail Market Volume (K Unit) Forecast, by Application 2019 & 2032
- Table 83: Spain America AI in the Retail Market Revenue (Million) Forecast, by Application 2019 & 2032
- Table 84: Spain America AI in the Retail Market Volume (K Unit) Forecast, by Application 2019 & 2032
- Table 85: Russia America AI in the Retail Market Revenue (Million) Forecast, by Application 2019 & 2032
- Table 86: Russia America AI in the Retail Market Volume (K Unit) Forecast, by Application 2019 & 2032
- Table 87: Benelux America AI in the Retail Market Revenue (Million) Forecast, by Application 2019 & 2032
- Table 88: Benelux America AI in the Retail Market Volume (K Unit) Forecast, by Application 2019 & 2032
- Table 89: Nordics America AI in the Retail Market Revenue (Million) Forecast, by Application 2019 & 2032
- Table 90: Nordics America AI in the Retail Market Volume (K Unit) Forecast, by Application 2019 & 2032
- Table 91: Rest of Europe America AI in the Retail Market Revenue (Million) Forecast, by Application 2019 & 2032
- Table 92: Rest of Europe America AI in the Retail Market Volume (K Unit) Forecast, by Application 2019 & 2032
- Table 93: Global America AI in the Retail Market Revenue Million Forecast, by Channel 2019 & 2032
- Table 94: Global America AI in the Retail Market Volume K Unit Forecast, by Channel 2019 & 2032
- Table 95: Global America AI in the Retail Market Revenue Million Forecast, by Solution 2019 & 2032
- Table 96: Global America AI in the Retail Market Volume K Unit Forecast, by Solution 2019 & 2032
- Table 97: Global America AI in the Retail Market Revenue Million Forecast, by Application 2019 & 2032
- Table 98: Global America AI in the Retail Market Volume K Unit Forecast, by Application 2019 & 2032
- Table 99: Global America AI in the Retail Market Revenue Million Forecast, by Technology 2019 & 2032
- Table 100: Global America AI in the Retail Market Volume K Unit Forecast, by Technology 2019 & 2032
- Table 101: Global America AI in the Retail Market Revenue Million Forecast, by Country 2019 & 2032
- Table 102: Global America AI in the Retail Market Volume K Unit Forecast, by Country 2019 & 2032
- Table 103: Turkey America AI in the Retail Market Revenue (Million) Forecast, by Application 2019 & 2032
- Table 104: Turkey America AI in the Retail Market Volume (K Unit) Forecast, by Application 2019 & 2032
- Table 105: Israel America AI in the Retail Market Revenue (Million) Forecast, by Application 2019 & 2032
- Table 106: Israel America AI in the Retail Market Volume (K Unit) Forecast, by Application 2019 & 2032
- Table 107: GCC America AI in the Retail Market Revenue (Million) Forecast, by Application 2019 & 2032
- Table 108: GCC America AI in the Retail Market Volume (K Unit) Forecast, by Application 2019 & 2032
- Table 109: North Africa America AI in the Retail Market Revenue (Million) Forecast, by Application 2019 & 2032
- Table 110: North Africa America AI in the Retail Market Volume (K Unit) Forecast, by Application 2019 & 2032
- Table 111: South Africa America AI in the Retail Market Revenue (Million) Forecast, by Application 2019 & 2032
- Table 112: South Africa America AI in the Retail Market Volume (K Unit) Forecast, by Application 2019 & 2032
- Table 113: Rest of Middle East & Africa America AI in the Retail Market Revenue (Million) Forecast, by Application 2019 & 2032
- Table 114: Rest of Middle East & Africa America AI in the Retail Market Volume (K Unit) Forecast, by Application 2019 & 2032
- Table 115: Global America AI in the Retail Market Revenue Million Forecast, by Channel 2019 & 2032
- Table 116: Global America AI in the Retail Market Volume K Unit Forecast, by Channel 2019 & 2032
- Table 117: Global America AI in the Retail Market Revenue Million Forecast, by Solution 2019 & 2032
- Table 118: Global America AI in the Retail Market Volume K Unit Forecast, by Solution 2019 & 2032
- Table 119: Global America AI in the Retail Market Revenue Million Forecast, by Application 2019 & 2032
- Table 120: Global America AI in the Retail Market Volume K Unit Forecast, by Application 2019 & 2032
- Table 121: Global America AI in the Retail Market Revenue Million Forecast, by Technology 2019 & 2032
- Table 122: Global America AI in the Retail Market Volume K Unit Forecast, by Technology 2019 & 2032
- Table 123: Global America AI in the Retail Market Revenue Million Forecast, by Country 2019 & 2032
- Table 124: Global America AI in the Retail Market Volume K Unit Forecast, by Country 2019 & 2032
- Table 125: China America AI in the Retail Market Revenue (Million) Forecast, by Application 2019 & 2032
- Table 126: China America AI in the Retail Market Volume (K Unit) Forecast, by Application 2019 & 2032
- Table 127: India America AI in the Retail Market Revenue (Million) Forecast, by Application 2019 & 2032
- Table 128: India America AI in the Retail Market Volume (K Unit) Forecast, by Application 2019 & 2032
- Table 129: Japan America AI in the Retail Market Revenue (Million) Forecast, by Application 2019 & 2032
- Table 130: Japan America AI in the Retail Market Volume (K Unit) Forecast, by Application 2019 & 2032
- Table 131: South Korea America AI in the Retail Market Revenue (Million) Forecast, by Application 2019 & 2032
- Table 132: South Korea America AI in the Retail Market Volume (K Unit) Forecast, by Application 2019 & 2032
- Table 133: ASEAN America AI in the Retail Market Revenue (Million) Forecast, by Application 2019 & 2032
- Table 134: ASEAN America AI in the Retail Market Volume (K Unit) Forecast, by Application 2019 & 2032
- Table 135: Oceania America AI in the Retail Market Revenue (Million) Forecast, by Application 2019 & 2032
- Table 136: Oceania America AI in the Retail Market Volume (K Unit) Forecast, by Application 2019 & 2032
- Table 137: Rest of Asia Pacific America AI in the Retail Market Revenue (Million) Forecast, by Application 2019 & 2032
- Table 138: Rest of Asia Pacific America AI in the Retail Market Volume (K Unit) Forecast, by Application 2019 & 2032
Frequently Asked Questions
1. What is the projected Compound Annual Growth Rate (CAGR) of the America AI in the Retail Market?
The projected CAGR is approximately 30.00%.
2. Which companies are prominent players in the America AI in the Retail Market?
Key companies in the market include ViSenze Pte Ltd, IBM Corporation, Sentient Technologies Holdings Limited, Google LLC, Salesforce com Inc, Microsoft Corporation, Amazon Web Services Inc, Sophos Inc (Thoma Bravo), Oracle Corporation, SAP SE.
3. What are the main segments of the America AI in the Retail Market?
The market segments include Channel, Solution, Application, Technology.
4. Can you provide details about the market size?
The market size is estimated to be USD XX Million as of 2022.
5. What are some drivers contributing to market growth?
; Hardware Advancement Acting as a Key Enabler for AI in Retail; Disruptive Developments in Retail. including AR. VR. IOT. and New Metrics; Rise of AI First Organizations; Need for Efficiency in Supply Chain Optimization.
6. What are the notable trends driving market growth?
Machine Learning Technology is Expected to Grow Siginificantly.
7. Are there any restraints impacting market growth?
; Lack of Professionals. as well as In-house Knowledge for Cultural Readiness.
8. Can you provide examples of recent developments in the market?
N/A
9. What pricing options are available for accessing the report?
Pricing options include single-user, multi-user, and enterprise licenses priced at USD 3800, USD 4500, and USD 5800 respectively.
10. Is the market size provided in terms of value or volume?
The market size is provided in terms of value, measured in Million and volume, measured in K Unit.
11. Are there any specific market keywords associated with the report?
Yes, the market keyword associated with the report is "America AI in the Retail Market," which aids in identifying and referencing the specific market segment covered.
12. How do I determine which pricing option suits my needs best?
The pricing options vary based on user requirements and access needs. Individual users may opt for single-user licenses, while businesses requiring broader access may choose multi-user or enterprise licenses for cost-effective access to the report.
13. Are there any additional resources or data provided in the America AI in the Retail Market report?
While the report offers comprehensive insights, it's advisable to review the specific contents or supplementary materials provided to ascertain if additional resources or data are available.
14. How can I stay updated on further developments or reports in the America AI in the Retail Market?
To stay informed about further developments, trends, and reports in the America AI in the Retail Market, consider subscribing to industry newsletters, following relevant companies and organizations, or regularly checking reputable industry news sources and publications.
Methodology
Step 1 - Identification of Relevant Samples Size from Population Database


Step 2 - Approaches for Defining Global Market Size (Value, Volume* & Price*)

Note*: In applicable scenarios
Step 3 - Data Sources
Primary Research
- Web Analytics
- Survey Reports
- Research Institute
- Latest Research Reports
- Opinion Leaders
Secondary Research
- Annual Reports
- White Paper
- Latest Press Release
- Industry Association
- Paid Database
- Investor Presentations

Step 4 - Data Triangulation
Involves using different sources of information in order to increase the validity of a study
These sources are likely to be stakeholders in a program - participants, other researchers, program staff, other community members, and so on.
Then we put all data in single framework & apply various statistical tools to find out the dynamic on the market.
During the analysis stage, feedback from the stakeholder groups would be compared to determine areas of agreement as well as areas of divergence


