
Key Insights
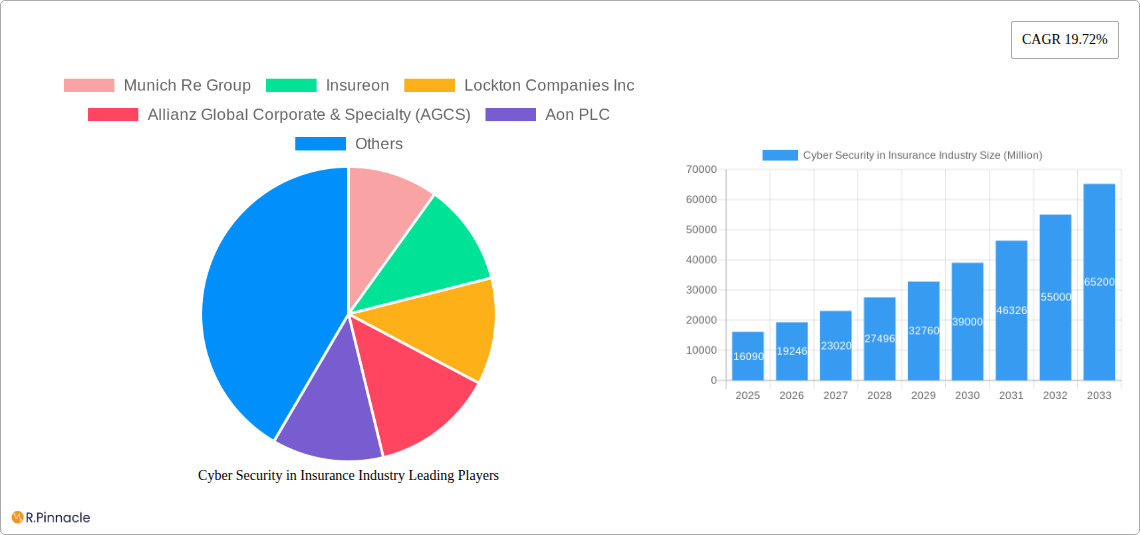
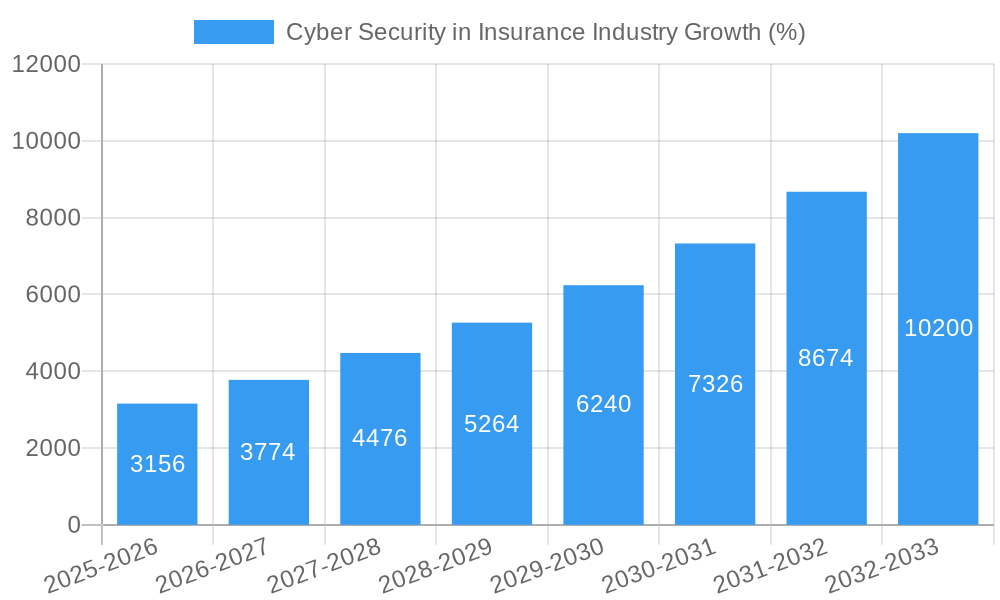
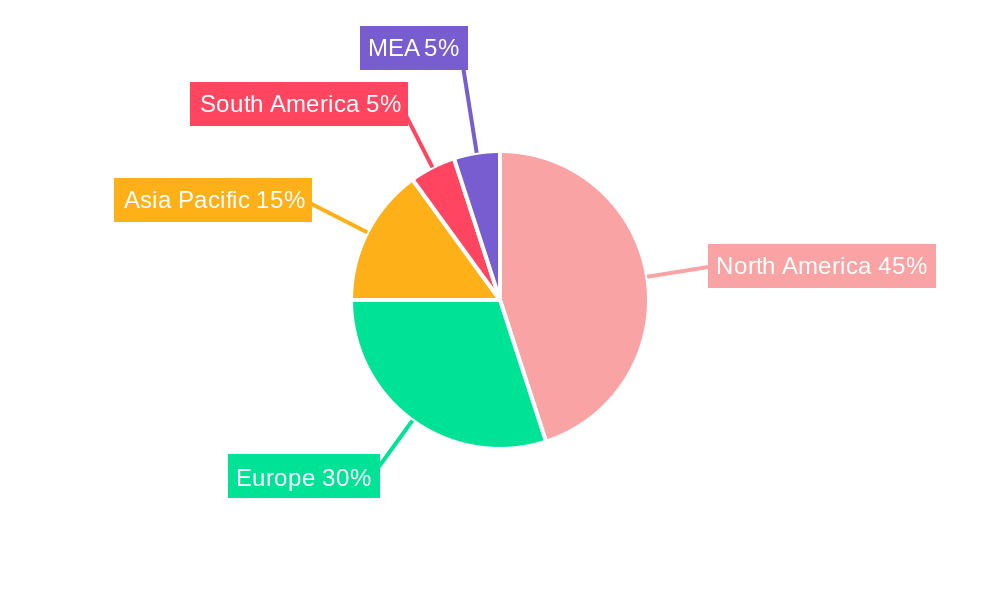
The cybersecurity insurance market is experiencing robust growth, projected to reach \$16.09 billion in 2025 and expand at a Compound Annual Growth Rate (CAGR) of 19.72% from 2025 to 2033. This surge is driven by the escalating frequency and severity of cyberattacks targeting insurance companies and their clients, coupled with increasingly stringent regulatory compliance requirements. The rising adoption of cloud computing and the Internet of Things (IoT) further fuels market expansion, as these technologies introduce new vulnerabilities and expand the attack surface. Key growth segments include large enterprises, heavily reliant on robust cybersecurity infrastructure, and the healthcare and BFSI (Banking, Financial Services, and Insurance) sectors, which handle highly sensitive data attracting sophisticated cybercriminals. North America currently dominates the market, but the Asia-Pacific region is poised for significant growth driven by rapid digitalization and increasing internet penetration. Leading players like Munich Re, Allianz, and Aon are strategically investing in advanced threat detection and response capabilities to capitalize on this expanding market. However, the market faces constraints such as a lack of skilled cybersecurity professionals and the challenges in accurately assessing cyber risks, which can hinder effective risk management and pricing strategies.
This market's future trajectory depends significantly on advancements in cybersecurity technology, evolving regulatory frameworks, and the ability of insurers to develop innovative products and services that effectively address the changing threat landscape. The increasing sophistication of cyberattacks demands proactive measures, including artificial intelligence (AI)-powered threat detection, robust incident response plans, and enhanced cybersecurity awareness training. Insurers will need to collaborate with technology providers to develop comprehensive solutions and leverage data analytics to improve risk assessment and underwriting practices. The geographical expansion into emerging markets, coupled with a focus on customer education about cybersecurity risks and insurance coverage, will be pivotal for driving continued market growth. Competition among established players and the emergence of niche cybersecurity insurance providers will further shape the market's future landscape.
Cyber Security in Insurance Industry: A Comprehensive Market Report (2019-2033)
This in-depth report provides a comprehensive analysis of the Cyber Security in Insurance Industry market, projecting a market value exceeding $XX Million by 2033. It examines market structure, innovation trends, dominant segments, and key players, offering actionable insights for industry professionals. The study period covers 2019-2033, with a base year of 2025 and a forecast period of 2025-2033. This report is crucial for understanding the evolving landscape of cybersecurity within the insurance sector and making informed strategic decisions.
Cyber Security in Insurance Industry Market Structure & Innovation Trends
The Cyber Security in Insurance Industry market is characterized by a moderately concentrated structure, with key players like Munich Re Group, Allianz Global Corporate & Specialty (AGCS), Aon PLC, and Chubb Corporation holding significant market share. However, the market also features numerous smaller, specialized firms. Innovation is driven by increasing cyber threats, evolving regulatory frameworks (like GDPR and CCPA), and the rising adoption of cloud computing and IoT. Product substitutes include traditional risk management strategies, but these are becoming increasingly inadequate in the face of sophisticated cyberattacks. The end-user demographic is broad, encompassing SMEs and large enterprises across diverse sectors. M&A activity has been substantial, with deal values reaching $XX Million in recent years, reflecting the strategic importance of cybersecurity within the insurance sector. Market share data for individual companies is unavailable at this time but is estimated at a range between xx% and xx% for the top 5 players.
Cyber Security in Insurance Industry Market Dynamics & Trends
The Cyber Security in Insurance Industry market is experiencing robust growth, driven by several factors. The rising frequency and severity of cyberattacks are compelling insurance companies to invest heavily in cybersecurity solutions. Technological advancements, such as AI-powered threat detection and blockchain-based security protocols, are reshaping the market landscape. Consumer preferences are shifting towards comprehensive cybersecurity solutions that offer proactive risk mitigation rather than just reactive incident response. Competitive dynamics are characterized by intense rivalry, innovation, and strategic partnerships. The market is expected to exhibit a CAGR of XX% during the forecast period, with market penetration increasing significantly across various sectors. The high demand for better security, increasing regulatory pressure, and rising adoption of new technologies are further fueling the market expansion. The market value is projected to cross $XX Million by 2033.
Dominant Regions & Segments in Cyber Security in Insurance Industry
While global data is unavailable at this time, North America is predicted to be a dominant region due to high technological advancement and increased cyber security awareness. Within industry segments, the BFSI (Banking, Financial Services, and Insurance) sector and Large Enterprises are expected to be the most significant contributors to market growth, due to their larger digital footprint and greater cyber risk exposure.
Key Drivers for North America: Strong regulatory frameworks, high technological adoption, and substantial investment in cybersecurity infrastructure.
Key Drivers for BFSI: High value of sensitive data and stringent regulatory compliance requirements.
Key Drivers for Large Enterprises: Extensive IT infrastructure, increased reliance on digital operations, and high potential financial losses from cyberattacks.
Other segments, such as Healthcare, Retail, IT and Telecom, and Manufacturing, are also experiencing increasing demand for cybersecurity solutions, driven by their increasing digitalization and vulnerability to cyberattacks. SMEs show less penetration due to budget constraints and perceived lower risk profile.
Cyber Security in Insurance Industry Product Innovations
Recent product innovations include AI-driven threat intelligence platforms, enhanced incident response solutions, and blockchain-based security systems. These advancements offer improved threat detection, faster incident response times, and enhanced data protection. The market is witnessing a strong move towards proactive security measures, which integrate various cybersecurity technologies and leverage automation to enhance efficiency. This aligns well with the market need for comprehensive, cost effective and easily deployable security solutions.
Report Scope & Segmentation Analysis
This report segments the market by end-user industry (Healthcare, Retail, BFSI, IT and Telecom, Manufacturing, Other End-user Industries) and organization size (SMEs, Large Enterprises). Each segment presents unique growth opportunities and competitive dynamics. For example, the BFSI segment demonstrates high growth potential due to regulatory pressures and data sensitivity, while SMEs present a growth area once price and usability concerns are addressed. The projected market size for each segment varies considerably with BFSI and large enterprises significantly outpacing the other segments. This report provides detailed projections for each of these segments.
Key Drivers of Cyber Security in Insurance Industry Growth
Growth in this market is fueled by the rise in cyberattacks, increasingly stringent data privacy regulations, the growing adoption of cloud computing and IoT, and the expanding awareness of cybersecurity risks among businesses. The constant evolution of cyber threats necessitates continuous investment in advanced security solutions. Government incentives and financial backing are also driving adoption of these systems.
Challenges in the Cyber Security in Insurance Industry Sector
Key challenges include the high cost of implementing and maintaining advanced cybersecurity solutions, a shortage of skilled cybersecurity professionals, the complexity of integrating various security tools, and the evolving nature of cyber threats. These factors contribute to a dynamic, competitive environment and impact market penetration.
Emerging Opportunities in Cyber Security in Insurance Industry
Emerging opportunities lie in the development of AI-powered threat intelligence platforms, blockchain-based security solutions, and advanced incident response services. The expansion into new markets, particularly in developing economies, presents significant growth potential. Moreover, the integration of cybersecurity solutions into insurance policies is expected to further drive market growth.
Leading Players in the Cyber Security in Insurance Industry Market
- Munich Re Group
- Insureon
- Lockton Companies Inc
- Allianz Global Corporate & Specialty (AGCS)
- Aon PLC
- Security Scorecard Inc
- American International Group Inc
- Zurich Insurance Co Ltd
- The Chubb Corporation
- Berkshire Hathaway Inc
- AXA XL
Key Developments in Cyber Security in Insurance Industry Industry
- September 2022: The Coalition, a cyber insurer, expands its services to the UK market after achieving significant success in the USA, offering comprehensive cybersecurity solutions for SMEs.
- August 2022: SolCyber partners with Converge Insurance, enhancing cybersecurity coverage and application processes for small and mid-sized businesses.
Future Outlook for Cyber Security in Insurance Industry Market
The Cyber Security in Insurance Industry market is poised for continued strong growth, driven by persistent cyber threats, increasing regulatory scrutiny, and the ongoing digital transformation of businesses. Strategic partnerships, technological advancements, and the rising adoption of comprehensive cybersecurity solutions will shape the future market landscape. The market will continue to see growth in the next decade due to the increasing sophistication of cyber threats, the increasing reliance on technology by businesses of all sizes, and the increased regulatory pressures to secure sensitive data.
Cyber Security in Insurance Industry Segmentation
-
1. Organization Size
- 1.1. Large Enterprises
- 1.2. Small and Medium Enterprises
-
2. End-user Industry
- 2.1. Retail
- 2.2. BFSI
- 2.3. Healthcare
- 2.4. Manufacturing
Cyber Security in Insurance Industry Segmentation By Geography
-
1. North America
- 1.1. United States
- 1.2. Canada
-
2. Europe
- 2.1. Germany
- 2.2. United Kingdom
- 2.3. France
-
3. Asia
- 3.1. India
- 3.2. China
- 3.3. Japan
- 3.4. Singapore
- 3.5. Australia and New Zealand
-
4. Latin America
- 4.1. Brazil
- 4.2. Argentina
- 4.3. Rest of South America
-
5. Middle East and Africa
- 5.1. UAE
- 5.2. South Africa
- 5.3. Saudi Arabia
- 5.4. Rest Of MEA
Cyber Security in Insurance Industry REPORT HIGHLIGHTS
| Aspects | Details |
|---|---|
| Study Period | 2019-2033 |
| Base Year | 2024 |
| Estimated Year | 2025 |
| Forecast Period | 2025-2033 |
| Historical Period | 2019-2024 |
| Growth Rate | CAGR of 19.72% from 2019-2033 |
| Segmentation |
|
Table of Contents
- 1. Introduction
- 1.1. Research Scope
- 1.2. Market Segmentation
- 1.3. Research Methodology
- 1.4. Definitions and Assumptions
- 2. Executive Summary
- 2.1. Introduction
- 3. Market Dynamics
- 3.1. Introduction
- 3.2. Market Drivers
- 3.2.1. Increasing Adoption of Cloud-based Services; Rising Data Security Breaches
- 3.3. Market Restrains
- 3.3.1. Difficulties in Implementing Cyber Insurance and High Costs
- 3.4. Market Trends
- 3.4.1. The BFSI Segment is Estimated to Hold a Significant Share
- 4. Market Factor Analysis
- 4.1. Porters Five Forces
- 4.2. Supply/Value Chain
- 4.3. PESTEL analysis
- 4.4. Market Entropy
- 4.5. Patent/Trademark Analysis
- 5. Global Cyber Security in Insurance Industry Analysis, Insights and Forecast, 2019-2031
- 5.1. Market Analysis, Insights and Forecast - by Organization Size
- 5.1.1. Large Enterprises
- 5.1.2. Small and Medium Enterprises
- 5.2. Market Analysis, Insights and Forecast - by End-user Industry
- 5.2.1. Retail
- 5.2.2. BFSI
- 5.2.3. Healthcare
- 5.2.4. Manufacturing
- 5.3. Market Analysis, Insights and Forecast - by Region
- 5.3.1. North America
- 5.3.2. Europe
- 5.3.3. Asia
- 5.3.4. Latin America
- 5.3.5. Middle East and Africa
- 5.1. Market Analysis, Insights and Forecast - by Organization Size
- 6. North America Cyber Security in Insurance Industry Analysis, Insights and Forecast, 2019-2031
- 6.1. Market Analysis, Insights and Forecast - by Organization Size
- 6.1.1. Large Enterprises
- 6.1.2. Small and Medium Enterprises
- 6.2. Market Analysis, Insights and Forecast - by End-user Industry
- 6.2.1. Retail
- 6.2.2. BFSI
- 6.2.3. Healthcare
- 6.2.4. Manufacturing
- 6.1. Market Analysis, Insights and Forecast - by Organization Size
- 7. Europe Cyber Security in Insurance Industry Analysis, Insights and Forecast, 2019-2031
- 7.1. Market Analysis, Insights and Forecast - by Organization Size
- 7.1.1. Large Enterprises
- 7.1.2. Small and Medium Enterprises
- 7.2. Market Analysis, Insights and Forecast - by End-user Industry
- 7.2.1. Retail
- 7.2.2. BFSI
- 7.2.3. Healthcare
- 7.2.4. Manufacturing
- 7.1. Market Analysis, Insights and Forecast - by Organization Size
- 8. Asia Cyber Security in Insurance Industry Analysis, Insights and Forecast, 2019-2031
- 8.1. Market Analysis, Insights and Forecast - by Organization Size
- 8.1.1. Large Enterprises
- 8.1.2. Small and Medium Enterprises
- 8.2. Market Analysis, Insights and Forecast - by End-user Industry
- 8.2.1. Retail
- 8.2.2. BFSI
- 8.2.3. Healthcare
- 8.2.4. Manufacturing
- 8.1. Market Analysis, Insights and Forecast - by Organization Size
- 9. Latin America Cyber Security in Insurance Industry Analysis, Insights and Forecast, 2019-2031
- 9.1. Market Analysis, Insights and Forecast - by Organization Size
- 9.1.1. Large Enterprises
- 9.1.2. Small and Medium Enterprises
- 9.2. Market Analysis, Insights and Forecast - by End-user Industry
- 9.2.1. Retail
- 9.2.2. BFSI
- 9.2.3. Healthcare
- 9.2.4. Manufacturing
- 9.1. Market Analysis, Insights and Forecast - by Organization Size
- 10. Middle East and Africa Cyber Security in Insurance Industry Analysis, Insights and Forecast, 2019-2031
- 10.1. Market Analysis, Insights and Forecast - by Organization Size
- 10.1.1. Large Enterprises
- 10.1.2. Small and Medium Enterprises
- 10.2. Market Analysis, Insights and Forecast - by End-user Industry
- 10.2.1. Retail
- 10.2.2. BFSI
- 10.2.3. Healthcare
- 10.2.4. Manufacturing
- 10.1. Market Analysis, Insights and Forecast - by Organization Size
- 11. North America Cyber Security in Insurance Industry Analysis, Insights and Forecast, 2019-2031
- 11.1. Market Analysis, Insights and Forecast - By Country/Sub-region
- 11.1.1 United States
- 11.1.2 Canada
- 11.1.3 Mexico
- 12. Europe Cyber Security in Insurance Industry Analysis, Insights and Forecast, 2019-2031
- 12.1. Market Analysis, Insights and Forecast - By Country/Sub-region
- 12.1.1 Germany
- 12.1.2 United Kingdom
- 12.1.3 France
- 12.1.4 Spain
- 12.1.5 Italy
- 12.1.6 Spain
- 12.1.7 Belgium
- 12.1.8 Netherland
- 12.1.9 Nordics
- 12.1.10 Rest of Europe
- 13. Asia Pacific Cyber Security in Insurance Industry Analysis, Insights and Forecast, 2019-2031
- 13.1. Market Analysis, Insights and Forecast - By Country/Sub-region
- 13.1.1 China
- 13.1.2 Japan
- 13.1.3 India
- 13.1.4 South Korea
- 13.1.5 Southeast Asia
- 13.1.6 Australia
- 13.1.7 Indonesia
- 13.1.8 Phillipes
- 13.1.9 Singapore
- 13.1.10 Thailandc
- 13.1.11 Rest of Asia Pacific
- 14. South America Cyber Security in Insurance Industry Analysis, Insights and Forecast, 2019-2031
- 14.1. Market Analysis, Insights and Forecast - By Country/Sub-region
- 14.1.1 Brazil
- 14.1.2 Argentina
- 14.1.3 Peru
- 14.1.4 Chile
- 14.1.5 Colombia
- 14.1.6 Ecuador
- 14.1.7 Venezuela
- 14.1.8 Rest of South America
- 15. North America Cyber Security in Insurance Industry Analysis, Insights and Forecast, 2019-2031
- 15.1. Market Analysis, Insights and Forecast - By Country/Sub-region
- 15.1.1 United States
- 15.1.2 Canada
- 15.1.3 Mexico
- 16. MEA Cyber Security in Insurance Industry Analysis, Insights and Forecast, 2019-2031
- 16.1. Market Analysis, Insights and Forecast - By Country/Sub-region
- 16.1.1 United Arab Emirates
- 16.1.2 Saudi Arabia
- 16.1.3 South Africa
- 16.1.4 Rest of Middle East and Africa
- 17. Competitive Analysis
- 17.1. Global Market Share Analysis 2024
- 17.2. Company Profiles
- 17.2.1 Munich Re Group
- 17.2.1.1. Overview
- 17.2.1.2. Products
- 17.2.1.3. SWOT Analysis
- 17.2.1.4. Recent Developments
- 17.2.1.5. Financials (Based on Availability)
- 17.2.2 Insureon
- 17.2.2.1. Overview
- 17.2.2.2. Products
- 17.2.2.3. SWOT Analysis
- 17.2.2.4. Recent Developments
- 17.2.2.5. Financials (Based on Availability)
- 17.2.3 Lockton Companies Inc
- 17.2.3.1. Overview
- 17.2.3.2. Products
- 17.2.3.3. SWOT Analysis
- 17.2.3.4. Recent Developments
- 17.2.3.5. Financials (Based on Availability)
- 17.2.4 Allianz Global Corporate & Specialty (AGCS)
- 17.2.4.1. Overview
- 17.2.4.2. Products
- 17.2.4.3. SWOT Analysis
- 17.2.4.4. Recent Developments
- 17.2.4.5. Financials (Based on Availability)
- 17.2.5 Aon PLC
- 17.2.5.1. Overview
- 17.2.5.2. Products
- 17.2.5.3. SWOT Analysis
- 17.2.5.4. Recent Developments
- 17.2.5.5. Financials (Based on Availability)
- 17.2.6 Security Scorecard Inc
- 17.2.6.1. Overview
- 17.2.6.2. Products
- 17.2.6.3. SWOT Analysis
- 17.2.6.4. Recent Developments
- 17.2.6.5. Financials (Based on Availability)
- 17.2.7 American International Group Inc
- 17.2.7.1. Overview
- 17.2.7.2. Products
- 17.2.7.3. SWOT Analysis
- 17.2.7.4. Recent Developments
- 17.2.7.5. Financials (Based on Availability)
- 17.2.8 Zurich Insurance Co Ltd
- 17.2.8.1. Overview
- 17.2.8.2. Products
- 17.2.8.3. SWOT Analysis
- 17.2.8.4. Recent Developments
- 17.2.8.5. Financials (Based on Availability)
- 17.2.9 The Chubb Corporation
- 17.2.9.1. Overview
- 17.2.9.2. Products
- 17.2.9.3. SWOT Analysis
- 17.2.9.4. Recent Developments
- 17.2.9.5. Financials (Based on Availability)
- 17.2.10 Berkshire Hathaway Inc
- 17.2.10.1. Overview
- 17.2.10.2. Products
- 17.2.10.3. SWOT Analysis
- 17.2.10.4. Recent Developments
- 17.2.10.5. Financials (Based on Availability)
- 17.2.11 AXA XL
- 17.2.11.1. Overview
- 17.2.11.2. Products
- 17.2.11.3. SWOT Analysis
- 17.2.11.4. Recent Developments
- 17.2.11.5. Financials (Based on Availability)
- 17.2.1 Munich Re Group
List of Figures
- Figure 1: Global Cyber Security in Insurance Industry Revenue Breakdown (Million, %) by Region 2024 & 2032
- Figure 2: Global Cyber Security in Insurance Industry Volume Breakdown (K Unit, %) by Region 2024 & 2032
- Figure 3: North America Cyber Security in Insurance Industry Revenue (Million), by Country 2024 & 2032
- Figure 4: North America Cyber Security in Insurance Industry Volume (K Unit), by Country 2024 & 2032
- Figure 5: North America Cyber Security in Insurance Industry Revenue Share (%), by Country 2024 & 2032
- Figure 6: North America Cyber Security in Insurance Industry Volume Share (%), by Country 2024 & 2032
- Figure 7: Europe Cyber Security in Insurance Industry Revenue (Million), by Country 2024 & 2032
- Figure 8: Europe Cyber Security in Insurance Industry Volume (K Unit), by Country 2024 & 2032
- Figure 9: Europe Cyber Security in Insurance Industry Revenue Share (%), by Country 2024 & 2032
- Figure 10: Europe Cyber Security in Insurance Industry Volume Share (%), by Country 2024 & 2032
- Figure 11: Asia Pacific Cyber Security in Insurance Industry Revenue (Million), by Country 2024 & 2032
- Figure 12: Asia Pacific Cyber Security in Insurance Industry Volume (K Unit), by Country 2024 & 2032
- Figure 13: Asia Pacific Cyber Security in Insurance Industry Revenue Share (%), by Country 2024 & 2032
- Figure 14: Asia Pacific Cyber Security in Insurance Industry Volume Share (%), by Country 2024 & 2032
- Figure 15: South America Cyber Security in Insurance Industry Revenue (Million), by Country 2024 & 2032
- Figure 16: South America Cyber Security in Insurance Industry Volume (K Unit), by Country 2024 & 2032
- Figure 17: South America Cyber Security in Insurance Industry Revenue Share (%), by Country 2024 & 2032
- Figure 18: South America Cyber Security in Insurance Industry Volume Share (%), by Country 2024 & 2032
- Figure 19: North America Cyber Security in Insurance Industry Revenue (Million), by Country 2024 & 2032
- Figure 20: North America Cyber Security in Insurance Industry Volume (K Unit), by Country 2024 & 2032
- Figure 21: North America Cyber Security in Insurance Industry Revenue Share (%), by Country 2024 & 2032
- Figure 22: North America Cyber Security in Insurance Industry Volume Share (%), by Country 2024 & 2032
- Figure 23: MEA Cyber Security in Insurance Industry Revenue (Million), by Country 2024 & 2032
- Figure 24: MEA Cyber Security in Insurance Industry Volume (K Unit), by Country 2024 & 2032
- Figure 25: MEA Cyber Security in Insurance Industry Revenue Share (%), by Country 2024 & 2032
- Figure 26: MEA Cyber Security in Insurance Industry Volume Share (%), by Country 2024 & 2032
- Figure 27: North America Cyber Security in Insurance Industry Revenue (Million), by Organization Size 2024 & 2032
- Figure 28: North America Cyber Security in Insurance Industry Volume (K Unit), by Organization Size 2024 & 2032
- Figure 29: North America Cyber Security in Insurance Industry Revenue Share (%), by Organization Size 2024 & 2032
- Figure 30: North America Cyber Security in Insurance Industry Volume Share (%), by Organization Size 2024 & 2032
- Figure 31: North America Cyber Security in Insurance Industry Revenue (Million), by End-user Industry 2024 & 2032
- Figure 32: North America Cyber Security in Insurance Industry Volume (K Unit), by End-user Industry 2024 & 2032
- Figure 33: North America Cyber Security in Insurance Industry Revenue Share (%), by End-user Industry 2024 & 2032
- Figure 34: North America Cyber Security in Insurance Industry Volume Share (%), by End-user Industry 2024 & 2032
- Figure 35: North America Cyber Security in Insurance Industry Revenue (Million), by Country 2024 & 2032
- Figure 36: North America Cyber Security in Insurance Industry Volume (K Unit), by Country 2024 & 2032
- Figure 37: North America Cyber Security in Insurance Industry Revenue Share (%), by Country 2024 & 2032
- Figure 38: North America Cyber Security in Insurance Industry Volume Share (%), by Country 2024 & 2032
- Figure 39: Europe Cyber Security in Insurance Industry Revenue (Million), by Organization Size 2024 & 2032
- Figure 40: Europe Cyber Security in Insurance Industry Volume (K Unit), by Organization Size 2024 & 2032
- Figure 41: Europe Cyber Security in Insurance Industry Revenue Share (%), by Organization Size 2024 & 2032
- Figure 42: Europe Cyber Security in Insurance Industry Volume Share (%), by Organization Size 2024 & 2032
- Figure 43: Europe Cyber Security in Insurance Industry Revenue (Million), by End-user Industry 2024 & 2032
- Figure 44: Europe Cyber Security in Insurance Industry Volume (K Unit), by End-user Industry 2024 & 2032
- Figure 45: Europe Cyber Security in Insurance Industry Revenue Share (%), by End-user Industry 2024 & 2032
- Figure 46: Europe Cyber Security in Insurance Industry Volume Share (%), by End-user Industry 2024 & 2032
- Figure 47: Europe Cyber Security in Insurance Industry Revenue (Million), by Country 2024 & 2032
- Figure 48: Europe Cyber Security in Insurance Industry Volume (K Unit), by Country 2024 & 2032
- Figure 49: Europe Cyber Security in Insurance Industry Revenue Share (%), by Country 2024 & 2032
- Figure 50: Europe Cyber Security in Insurance Industry Volume Share (%), by Country 2024 & 2032
- Figure 51: Asia Cyber Security in Insurance Industry Revenue (Million), by Organization Size 2024 & 2032
- Figure 52: Asia Cyber Security in Insurance Industry Volume (K Unit), by Organization Size 2024 & 2032
- Figure 53: Asia Cyber Security in Insurance Industry Revenue Share (%), by Organization Size 2024 & 2032
- Figure 54: Asia Cyber Security in Insurance Industry Volume Share (%), by Organization Size 2024 & 2032
- Figure 55: Asia Cyber Security in Insurance Industry Revenue (Million), by End-user Industry 2024 & 2032
- Figure 56: Asia Cyber Security in Insurance Industry Volume (K Unit), by End-user Industry 2024 & 2032
- Figure 57: Asia Cyber Security in Insurance Industry Revenue Share (%), by End-user Industry 2024 & 2032
- Figure 58: Asia Cyber Security in Insurance Industry Volume Share (%), by End-user Industry 2024 & 2032
- Figure 59: Asia Cyber Security in Insurance Industry Revenue (Million), by Country 2024 & 2032
- Figure 60: Asia Cyber Security in Insurance Industry Volume (K Unit), by Country 2024 & 2032
- Figure 61: Asia Cyber Security in Insurance Industry Revenue Share (%), by Country 2024 & 2032
- Figure 62: Asia Cyber Security in Insurance Industry Volume Share (%), by Country 2024 & 2032
- Figure 63: Latin America Cyber Security in Insurance Industry Revenue (Million), by Organization Size 2024 & 2032
- Figure 64: Latin America Cyber Security in Insurance Industry Volume (K Unit), by Organization Size 2024 & 2032
- Figure 65: Latin America Cyber Security in Insurance Industry Revenue Share (%), by Organization Size 2024 & 2032
- Figure 66: Latin America Cyber Security in Insurance Industry Volume Share (%), by Organization Size 2024 & 2032
- Figure 67: Latin America Cyber Security in Insurance Industry Revenue (Million), by End-user Industry 2024 & 2032
- Figure 68: Latin America Cyber Security in Insurance Industry Volume (K Unit), by End-user Industry 2024 & 2032
- Figure 69: Latin America Cyber Security in Insurance Industry Revenue Share (%), by End-user Industry 2024 & 2032
- Figure 70: Latin America Cyber Security in Insurance Industry Volume Share (%), by End-user Industry 2024 & 2032
- Figure 71: Latin America Cyber Security in Insurance Industry Revenue (Million), by Country 2024 & 2032
- Figure 72: Latin America Cyber Security in Insurance Industry Volume (K Unit), by Country 2024 & 2032
- Figure 73: Latin America Cyber Security in Insurance Industry Revenue Share (%), by Country 2024 & 2032
- Figure 74: Latin America Cyber Security in Insurance Industry Volume Share (%), by Country 2024 & 2032
- Figure 75: Middle East and Africa Cyber Security in Insurance Industry Revenue (Million), by Organization Size 2024 & 2032
- Figure 76: Middle East and Africa Cyber Security in Insurance Industry Volume (K Unit), by Organization Size 2024 & 2032
- Figure 77: Middle East and Africa Cyber Security in Insurance Industry Revenue Share (%), by Organization Size 2024 & 2032
- Figure 78: Middle East and Africa Cyber Security in Insurance Industry Volume Share (%), by Organization Size 2024 & 2032
- Figure 79: Middle East and Africa Cyber Security in Insurance Industry Revenue (Million), by End-user Industry 2024 & 2032
- Figure 80: Middle East and Africa Cyber Security in Insurance Industry Volume (K Unit), by End-user Industry 2024 & 2032
- Figure 81: Middle East and Africa Cyber Security in Insurance Industry Revenue Share (%), by End-user Industry 2024 & 2032
- Figure 82: Middle East and Africa Cyber Security in Insurance Industry Volume Share (%), by End-user Industry 2024 & 2032
- Figure 83: Middle East and Africa Cyber Security in Insurance Industry Revenue (Million), by Country 2024 & 2032
- Figure 84: Middle East and Africa Cyber Security in Insurance Industry Volume (K Unit), by Country 2024 & 2032
- Figure 85: Middle East and Africa Cyber Security in Insurance Industry Revenue Share (%), by Country 2024 & 2032
- Figure 86: Middle East and Africa Cyber Security in Insurance Industry Volume Share (%), by Country 2024 & 2032
List of Tables
- Table 1: Global Cyber Security in Insurance Industry Revenue Million Forecast, by Region 2019 & 2032
- Table 2: Global Cyber Security in Insurance Industry Volume K Unit Forecast, by Region 2019 & 2032
- Table 3: Global Cyber Security in Insurance Industry Revenue Million Forecast, by Organization Size 2019 & 2032
- Table 4: Global Cyber Security in Insurance Industry Volume K Unit Forecast, by Organization Size 2019 & 2032
- Table 5: Global Cyber Security in Insurance Industry Revenue Million Forecast, by End-user Industry 2019 & 2032
- Table 6: Global Cyber Security in Insurance Industry Volume K Unit Forecast, by End-user Industry 2019 & 2032
- Table 7: Global Cyber Security in Insurance Industry Revenue Million Forecast, by Region 2019 & 2032
- Table 8: Global Cyber Security in Insurance Industry Volume K Unit Forecast, by Region 2019 & 2032
- Table 9: Global Cyber Security in Insurance Industry Revenue Million Forecast, by Country 2019 & 2032
- Table 10: Global Cyber Security in Insurance Industry Volume K Unit Forecast, by Country 2019 & 2032
- Table 11: United States Cyber Security in Insurance Industry Revenue (Million) Forecast, by Application 2019 & 2032
- Table 12: United States Cyber Security in Insurance Industry Volume (K Unit) Forecast, by Application 2019 & 2032
- Table 13: Canada Cyber Security in Insurance Industry Revenue (Million) Forecast, by Application 2019 & 2032
- Table 14: Canada Cyber Security in Insurance Industry Volume (K Unit) Forecast, by Application 2019 & 2032
- Table 15: Mexico Cyber Security in Insurance Industry Revenue (Million) Forecast, by Application 2019 & 2032
- Table 16: Mexico Cyber Security in Insurance Industry Volume (K Unit) Forecast, by Application 2019 & 2032
- Table 17: Global Cyber Security in Insurance Industry Revenue Million Forecast, by Country 2019 & 2032
- Table 18: Global Cyber Security in Insurance Industry Volume K Unit Forecast, by Country 2019 & 2032
- Table 19: Germany Cyber Security in Insurance Industry Revenue (Million) Forecast, by Application 2019 & 2032
- Table 20: Germany Cyber Security in Insurance Industry Volume (K Unit) Forecast, by Application 2019 & 2032
- Table 21: United Kingdom Cyber Security in Insurance Industry Revenue (Million) Forecast, by Application 2019 & 2032
- Table 22: United Kingdom Cyber Security in Insurance Industry Volume (K Unit) Forecast, by Application 2019 & 2032
- Table 23: France Cyber Security in Insurance Industry Revenue (Million) Forecast, by Application 2019 & 2032
- Table 24: France Cyber Security in Insurance Industry Volume (K Unit) Forecast, by Application 2019 & 2032
- Table 25: Spain Cyber Security in Insurance Industry Revenue (Million) Forecast, by Application 2019 & 2032
- Table 26: Spain Cyber Security in Insurance Industry Volume (K Unit) Forecast, by Application 2019 & 2032
- Table 27: Italy Cyber Security in Insurance Industry Revenue (Million) Forecast, by Application 2019 & 2032
- Table 28: Italy Cyber Security in Insurance Industry Volume (K Unit) Forecast, by Application 2019 & 2032
- Table 29: Spain Cyber Security in Insurance Industry Revenue (Million) Forecast, by Application 2019 & 2032
- Table 30: Spain Cyber Security in Insurance Industry Volume (K Unit) Forecast, by Application 2019 & 2032
- Table 31: Belgium Cyber Security in Insurance Industry Revenue (Million) Forecast, by Application 2019 & 2032
- Table 32: Belgium Cyber Security in Insurance Industry Volume (K Unit) Forecast, by Application 2019 & 2032
- Table 33: Netherland Cyber Security in Insurance Industry Revenue (Million) Forecast, by Application 2019 & 2032
- Table 34: Netherland Cyber Security in Insurance Industry Volume (K Unit) Forecast, by Application 2019 & 2032
- Table 35: Nordics Cyber Security in Insurance Industry Revenue (Million) Forecast, by Application 2019 & 2032
- Table 36: Nordics Cyber Security in Insurance Industry Volume (K Unit) Forecast, by Application 2019 & 2032
- Table 37: Rest of Europe Cyber Security in Insurance Industry Revenue (Million) Forecast, by Application 2019 & 2032
- Table 38: Rest of Europe Cyber Security in Insurance Industry Volume (K Unit) Forecast, by Application 2019 & 2032
- Table 39: Global Cyber Security in Insurance Industry Revenue Million Forecast, by Country 2019 & 2032
- Table 40: Global Cyber Security in Insurance Industry Volume K Unit Forecast, by Country 2019 & 2032
- Table 41: China Cyber Security in Insurance Industry Revenue (Million) Forecast, by Application 2019 & 2032
- Table 42: China Cyber Security in Insurance Industry Volume (K Unit) Forecast, by Application 2019 & 2032
- Table 43: Japan Cyber Security in Insurance Industry Revenue (Million) Forecast, by Application 2019 & 2032
- Table 44: Japan Cyber Security in Insurance Industry Volume (K Unit) Forecast, by Application 2019 & 2032
- Table 45: India Cyber Security in Insurance Industry Revenue (Million) Forecast, by Application 2019 & 2032
- Table 46: India Cyber Security in Insurance Industry Volume (K Unit) Forecast, by Application 2019 & 2032
- Table 47: South Korea Cyber Security in Insurance Industry Revenue (Million) Forecast, by Application 2019 & 2032
- Table 48: South Korea Cyber Security in Insurance Industry Volume (K Unit) Forecast, by Application 2019 & 2032
- Table 49: Southeast Asia Cyber Security in Insurance Industry Revenue (Million) Forecast, by Application 2019 & 2032
- Table 50: Southeast Asia Cyber Security in Insurance Industry Volume (K Unit) Forecast, by Application 2019 & 2032
- Table 51: Australia Cyber Security in Insurance Industry Revenue (Million) Forecast, by Application 2019 & 2032
- Table 52: Australia Cyber Security in Insurance Industry Volume (K Unit) Forecast, by Application 2019 & 2032
- Table 53: Indonesia Cyber Security in Insurance Industry Revenue (Million) Forecast, by Application 2019 & 2032
- Table 54: Indonesia Cyber Security in Insurance Industry Volume (K Unit) Forecast, by Application 2019 & 2032
- Table 55: Phillipes Cyber Security in Insurance Industry Revenue (Million) Forecast, by Application 2019 & 2032
- Table 56: Phillipes Cyber Security in Insurance Industry Volume (K Unit) Forecast, by Application 2019 & 2032
- Table 57: Singapore Cyber Security in Insurance Industry Revenue (Million) Forecast, by Application 2019 & 2032
- Table 58: Singapore Cyber Security in Insurance Industry Volume (K Unit) Forecast, by Application 2019 & 2032
- Table 59: Thailandc Cyber Security in Insurance Industry Revenue (Million) Forecast, by Application 2019 & 2032
- Table 60: Thailandc Cyber Security in Insurance Industry Volume (K Unit) Forecast, by Application 2019 & 2032
- Table 61: Rest of Asia Pacific Cyber Security in Insurance Industry Revenue (Million) Forecast, by Application 2019 & 2032
- Table 62: Rest of Asia Pacific Cyber Security in Insurance Industry Volume (K Unit) Forecast, by Application 2019 & 2032
- Table 63: Global Cyber Security in Insurance Industry Revenue Million Forecast, by Country 2019 & 2032
- Table 64: Global Cyber Security in Insurance Industry Volume K Unit Forecast, by Country 2019 & 2032
- Table 65: Brazil Cyber Security in Insurance Industry Revenue (Million) Forecast, by Application 2019 & 2032
- Table 66: Brazil Cyber Security in Insurance Industry Volume (K Unit) Forecast, by Application 2019 & 2032
- Table 67: Argentina Cyber Security in Insurance Industry Revenue (Million) Forecast, by Application 2019 & 2032
- Table 68: Argentina Cyber Security in Insurance Industry Volume (K Unit) Forecast, by Application 2019 & 2032
- Table 69: Peru Cyber Security in Insurance Industry Revenue (Million) Forecast, by Application 2019 & 2032
- Table 70: Peru Cyber Security in Insurance Industry Volume (K Unit) Forecast, by Application 2019 & 2032
- Table 71: Chile Cyber Security in Insurance Industry Revenue (Million) Forecast, by Application 2019 & 2032
- Table 72: Chile Cyber Security in Insurance Industry Volume (K Unit) Forecast, by Application 2019 & 2032
- Table 73: Colombia Cyber Security in Insurance Industry Revenue (Million) Forecast, by Application 2019 & 2032
- Table 74: Colombia Cyber Security in Insurance Industry Volume (K Unit) Forecast, by Application 2019 & 2032
- Table 75: Ecuador Cyber Security in Insurance Industry Revenue (Million) Forecast, by Application 2019 & 2032
- Table 76: Ecuador Cyber Security in Insurance Industry Volume (K Unit) Forecast, by Application 2019 & 2032
- Table 77: Venezuela Cyber Security in Insurance Industry Revenue (Million) Forecast, by Application 2019 & 2032
- Table 78: Venezuela Cyber Security in Insurance Industry Volume (K Unit) Forecast, by Application 2019 & 2032
- Table 79: Rest of South America Cyber Security in Insurance Industry Revenue (Million) Forecast, by Application 2019 & 2032
- Table 80: Rest of South America Cyber Security in Insurance Industry Volume (K Unit) Forecast, by Application 2019 & 2032
- Table 81: Global Cyber Security in Insurance Industry Revenue Million Forecast, by Country 2019 & 2032
- Table 82: Global Cyber Security in Insurance Industry Volume K Unit Forecast, by Country 2019 & 2032
- Table 83: United States Cyber Security in Insurance Industry Revenue (Million) Forecast, by Application 2019 & 2032
- Table 84: United States Cyber Security in Insurance Industry Volume (K Unit) Forecast, by Application 2019 & 2032
- Table 85: Canada Cyber Security in Insurance Industry Revenue (Million) Forecast, by Application 2019 & 2032
- Table 86: Canada Cyber Security in Insurance Industry Volume (K Unit) Forecast, by Application 2019 & 2032
- Table 87: Mexico Cyber Security in Insurance Industry Revenue (Million) Forecast, by Application 2019 & 2032
- Table 88: Mexico Cyber Security in Insurance Industry Volume (K Unit) Forecast, by Application 2019 & 2032
- Table 89: Global Cyber Security in Insurance Industry Revenue Million Forecast, by Country 2019 & 2032
- Table 90: Global Cyber Security in Insurance Industry Volume K Unit Forecast, by Country 2019 & 2032
- Table 91: United Arab Emirates Cyber Security in Insurance Industry Revenue (Million) Forecast, by Application 2019 & 2032
- Table 92: United Arab Emirates Cyber Security in Insurance Industry Volume (K Unit) Forecast, by Application 2019 & 2032
- Table 93: Saudi Arabia Cyber Security in Insurance Industry Revenue (Million) Forecast, by Application 2019 & 2032
- Table 94: Saudi Arabia Cyber Security in Insurance Industry Volume (K Unit) Forecast, by Application 2019 & 2032
- Table 95: South Africa Cyber Security in Insurance Industry Revenue (Million) Forecast, by Application 2019 & 2032
- Table 96: South Africa Cyber Security in Insurance Industry Volume (K Unit) Forecast, by Application 2019 & 2032
- Table 97: Rest of Middle East and Africa Cyber Security in Insurance Industry Revenue (Million) Forecast, by Application 2019 & 2032
- Table 98: Rest of Middle East and Africa Cyber Security in Insurance Industry Volume (K Unit) Forecast, by Application 2019 & 2032
- Table 99: Global Cyber Security in Insurance Industry Revenue Million Forecast, by Organization Size 2019 & 2032
- Table 100: Global Cyber Security in Insurance Industry Volume K Unit Forecast, by Organization Size 2019 & 2032
- Table 101: Global Cyber Security in Insurance Industry Revenue Million Forecast, by End-user Industry 2019 & 2032
- Table 102: Global Cyber Security in Insurance Industry Volume K Unit Forecast, by End-user Industry 2019 & 2032
- Table 103: Global Cyber Security in Insurance Industry Revenue Million Forecast, by Country 2019 & 2032
- Table 104: Global Cyber Security in Insurance Industry Volume K Unit Forecast, by Country 2019 & 2032
- Table 105: United States Cyber Security in Insurance Industry Revenue (Million) Forecast, by Application 2019 & 2032
- Table 106: United States Cyber Security in Insurance Industry Volume (K Unit) Forecast, by Application 2019 & 2032
- Table 107: Canada Cyber Security in Insurance Industry Revenue (Million) Forecast, by Application 2019 & 2032
- Table 108: Canada Cyber Security in Insurance Industry Volume (K Unit) Forecast, by Application 2019 & 2032
- Table 109: Global Cyber Security in Insurance Industry Revenue Million Forecast, by Organization Size 2019 & 2032
- Table 110: Global Cyber Security in Insurance Industry Volume K Unit Forecast, by Organization Size 2019 & 2032
- Table 111: Global Cyber Security in Insurance Industry Revenue Million Forecast, by End-user Industry 2019 & 2032
- Table 112: Global Cyber Security in Insurance Industry Volume K Unit Forecast, by End-user Industry 2019 & 2032
- Table 113: Global Cyber Security in Insurance Industry Revenue Million Forecast, by Country 2019 & 2032
- Table 114: Global Cyber Security in Insurance Industry Volume K Unit Forecast, by Country 2019 & 2032
- Table 115: Germany Cyber Security in Insurance Industry Revenue (Million) Forecast, by Application 2019 & 2032
- Table 116: Germany Cyber Security in Insurance Industry Volume (K Unit) Forecast, by Application 2019 & 2032
- Table 117: United Kingdom Cyber Security in Insurance Industry Revenue (Million) Forecast, by Application 2019 & 2032
- Table 118: United Kingdom Cyber Security in Insurance Industry Volume (K Unit) Forecast, by Application 2019 & 2032
- Table 119: France Cyber Security in Insurance Industry Revenue (Million) Forecast, by Application 2019 & 2032
- Table 120: France Cyber Security in Insurance Industry Volume (K Unit) Forecast, by Application 2019 & 2032
- Table 121: Global Cyber Security in Insurance Industry Revenue Million Forecast, by Organization Size 2019 & 2032
- Table 122: Global Cyber Security in Insurance Industry Volume K Unit Forecast, by Organization Size 2019 & 2032
- Table 123: Global Cyber Security in Insurance Industry Revenue Million Forecast, by End-user Industry 2019 & 2032
- Table 124: Global Cyber Security in Insurance Industry Volume K Unit Forecast, by End-user Industry 2019 & 2032
- Table 125: Global Cyber Security in Insurance Industry Revenue Million Forecast, by Country 2019 & 2032
- Table 126: Global Cyber Security in Insurance Industry Volume K Unit Forecast, by Country 2019 & 2032
- Table 127: India Cyber Security in Insurance Industry Revenue (Million) Forecast, by Application 2019 & 2032
- Table 128: India Cyber Security in Insurance Industry Volume (K Unit) Forecast, by Application 2019 & 2032
- Table 129: China Cyber Security in Insurance Industry Revenue (Million) Forecast, by Application 2019 & 2032
- Table 130: China Cyber Security in Insurance Industry Volume (K Unit) Forecast, by Application 2019 & 2032
- Table 131: Japan Cyber Security in Insurance Industry Revenue (Million) Forecast, by Application 2019 & 2032
- Table 132: Japan Cyber Security in Insurance Industry Volume (K Unit) Forecast, by Application 2019 & 2032
- Table 133: Singapore Cyber Security in Insurance Industry Revenue (Million) Forecast, by Application 2019 & 2032
- Table 134: Singapore Cyber Security in Insurance Industry Volume (K Unit) Forecast, by Application 2019 & 2032
- Table 135: Australia and New Zealand Cyber Security in Insurance Industry Revenue (Million) Forecast, by Application 2019 & 2032
- Table 136: Australia and New Zealand Cyber Security in Insurance Industry Volume (K Unit) Forecast, by Application 2019 & 2032
- Table 137: Global Cyber Security in Insurance Industry Revenue Million Forecast, by Organization Size 2019 & 2032
- Table 138: Global Cyber Security in Insurance Industry Volume K Unit Forecast, by Organization Size 2019 & 2032
- Table 139: Global Cyber Security in Insurance Industry Revenue Million Forecast, by End-user Industry 2019 & 2032
- Table 140: Global Cyber Security in Insurance Industry Volume K Unit Forecast, by End-user Industry 2019 & 2032
- Table 141: Global Cyber Security in Insurance Industry Revenue Million Forecast, by Country 2019 & 2032
- Table 142: Global Cyber Security in Insurance Industry Volume K Unit Forecast, by Country 2019 & 2032
- Table 143: Brazil Cyber Security in Insurance Industry Revenue (Million) Forecast, by Application 2019 & 2032
- Table 144: Brazil Cyber Security in Insurance Industry Volume (K Unit) Forecast, by Application 2019 & 2032
- Table 145: Argentina Cyber Security in Insurance Industry Revenue (Million) Forecast, by Application 2019 & 2032
- Table 146: Argentina Cyber Security in Insurance Industry Volume (K Unit) Forecast, by Application 2019 & 2032
- Table 147: Rest of South America Cyber Security in Insurance Industry Revenue (Million) Forecast, by Application 2019 & 2032
- Table 148: Rest of South America Cyber Security in Insurance Industry Volume (K Unit) Forecast, by Application 2019 & 2032
- Table 149: Global Cyber Security in Insurance Industry Revenue Million Forecast, by Organization Size 2019 & 2032
- Table 150: Global Cyber Security in Insurance Industry Volume K Unit Forecast, by Organization Size 2019 & 2032
- Table 151: Global Cyber Security in Insurance Industry Revenue Million Forecast, by End-user Industry 2019 & 2032
- Table 152: Global Cyber Security in Insurance Industry Volume K Unit Forecast, by End-user Industry 2019 & 2032
- Table 153: Global Cyber Security in Insurance Industry Revenue Million Forecast, by Country 2019 & 2032
- Table 154: Global Cyber Security in Insurance Industry Volume K Unit Forecast, by Country 2019 & 2032
- Table 155: UAE Cyber Security in Insurance Industry Revenue (Million) Forecast, by Application 2019 & 2032
- Table 156: UAE Cyber Security in Insurance Industry Volume (K Unit) Forecast, by Application 2019 & 2032
- Table 157: South Africa Cyber Security in Insurance Industry Revenue (Million) Forecast, by Application 2019 & 2032
- Table 158: South Africa Cyber Security in Insurance Industry Volume (K Unit) Forecast, by Application 2019 & 2032
- Table 159: Saudi Arabia Cyber Security in Insurance Industry Revenue (Million) Forecast, by Application 2019 & 2032
- Table 160: Saudi Arabia Cyber Security in Insurance Industry Volume (K Unit) Forecast, by Application 2019 & 2032
- Table 161: Rest Of MEA Cyber Security in Insurance Industry Revenue (Million) Forecast, by Application 2019 & 2032
- Table 162: Rest Of MEA Cyber Security in Insurance Industry Volume (K Unit) Forecast, by Application 2019 & 2032
Frequently Asked Questions
1. What is the projected Compound Annual Growth Rate (CAGR) of the Cyber Security in Insurance Industry?
The projected CAGR is approximately 19.72%.
2. Which companies are prominent players in the Cyber Security in Insurance Industry?
Key companies in the market include Munich Re Group, Insureon, Lockton Companies Inc, Allianz Global Corporate & Specialty (AGCS), Aon PLC, Security Scorecard Inc, American International Group Inc, Zurich Insurance Co Ltd, The Chubb Corporation, Berkshire Hathaway Inc, AXA XL.
3. What are the main segments of the Cyber Security in Insurance Industry?
The market segments include Organization Size, End-user Industry.
4. Can you provide details about the market size?
The market size is estimated to be USD 16.09 Million as of 2022.
5. What are some drivers contributing to market growth?
Increasing Adoption of Cloud-based Services; Rising Data Security Breaches.
6. What are the notable trends driving market growth?
The BFSI Segment is Estimated to Hold a Significant Share.
7. Are there any restraints impacting market growth?
Difficulties in Implementing Cyber Insurance and High Costs.
8. Can you provide examples of recent developments in the market?
September 2022 - The coalition, a cyber insurer with its headquarters in San Francisco, has been offering small and medium businesses solutions to manage cyber risk by integrating cybersecurity technologies, monitoring, access to digital forensics, incident response, and extensive insurance coverage in the USA. The company has increased its clientele and entered the UK market.
9. What pricing options are available for accessing the report?
Pricing options include single-user, multi-user, and enterprise licenses priced at USD 4750, USD 5250, and USD 8750 respectively.
10. Is the market size provided in terms of value or volume?
The market size is provided in terms of value, measured in Million and volume, measured in K Unit.
11. Are there any specific market keywords associated with the report?
Yes, the market keyword associated with the report is "Cyber Security in Insurance Industry," which aids in identifying and referencing the specific market segment covered.
12. How do I determine which pricing option suits my needs best?
The pricing options vary based on user requirements and access needs. Individual users may opt for single-user licenses, while businesses requiring broader access may choose multi-user or enterprise licenses for cost-effective access to the report.
13. Are there any additional resources or data provided in the Cyber Security in Insurance Industry report?
While the report offers comprehensive insights, it's advisable to review the specific contents or supplementary materials provided to ascertain if additional resources or data are available.
14. How can I stay updated on further developments or reports in the Cyber Security in Insurance Industry?
To stay informed about further developments, trends, and reports in the Cyber Security in Insurance Industry, consider subscribing to industry newsletters, following relevant companies and organizations, or regularly checking reputable industry news sources and publications.
Methodology
Step 1 - Identification of Relevant Samples Size from Population Database


Step 2 - Approaches for Defining Global Market Size (Value, Volume* & Price*)

Note*: In applicable scenarios
Step 3 - Data Sources
Primary Research
- Web Analytics
- Survey Reports
- Research Institute
- Latest Research Reports
- Opinion Leaders
Secondary Research
- Annual Reports
- White Paper
- Latest Press Release
- Industry Association
- Paid Database
- Investor Presentations

Step 4 - Data Triangulation
Involves using different sources of information in order to increase the validity of a study
These sources are likely to be stakeholders in a program - participants, other researchers, program staff, other community members, and so on.
Then we put all data in single framework & apply various statistical tools to find out the dynamic on the market.
During the analysis stage, feedback from the stakeholder groups would be compared to determine areas of agreement as well as areas of divergence


