
Key Insights
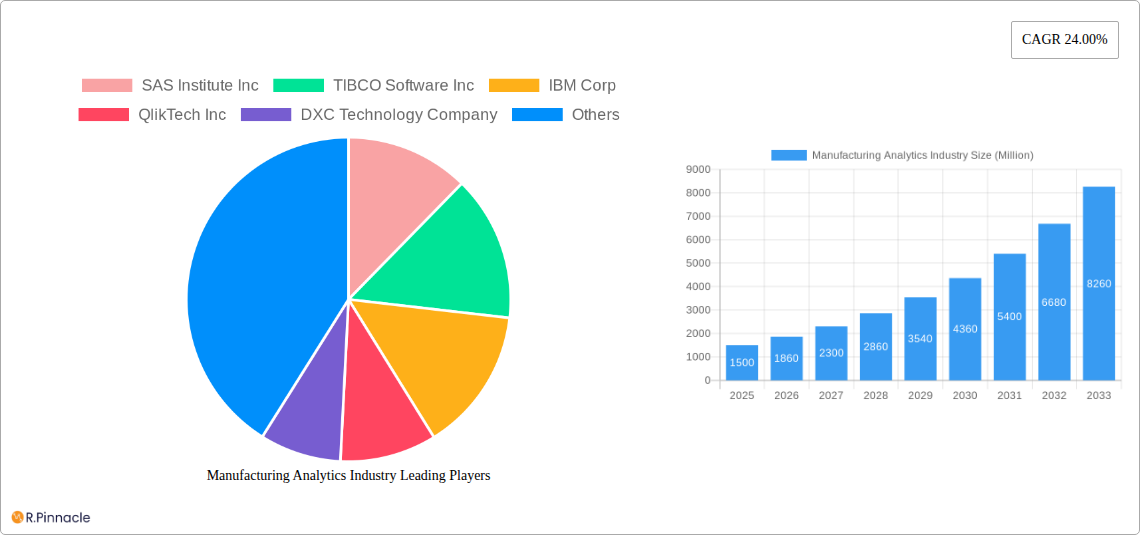
The Manufacturing Analytics market is experiencing robust growth, projected at a 24% CAGR from 2025 to 2033. This expansion is fueled by several key drivers. The increasing adoption of Industry 4.0 technologies, including IoT sensors and advanced data collection systems, provides manufacturers with unprecedented access to real-time operational data. This data, when analyzed effectively through manufacturing analytics solutions, enables significant improvements in efficiency, productivity, and profitability. Furthermore, the rising need for predictive maintenance, driven by the desire to minimize downtime and optimize asset utilization, is a major catalyst for market growth. Companies across various sectors, including automotive, electronics, and pharmaceuticals, are increasingly deploying cloud-based analytics platforms to gain actionable insights from their production processes. The ability to leverage these insights for inventory management, supply chain optimization, and overall operational improvement is proving invaluable in a competitive global landscape.
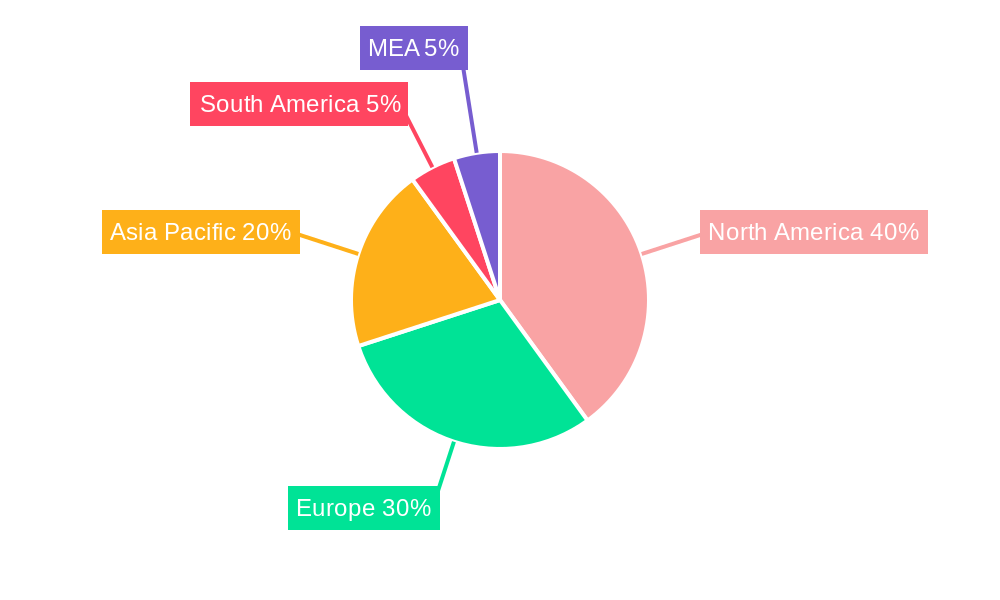
The market segmentation reveals a strong preference for cloud-based solutions over on-premise deployments, reflecting the scalability, cost-effectiveness, and accessibility offered by cloud technologies. Within applications, predictive maintenance is gaining significant traction, followed closely by inventory management and supply chain optimization. Geographically, North America and Europe currently hold significant market share, but the Asia-Pacific region is demonstrating rapid growth, driven by industrialization and technological advancements in countries like China and India. While the market faces certain restraints, such as the initial investment costs associated with implementing new analytics systems and the need for skilled data analysts, the overall growth trajectory remains positive, driven by the demonstrable return on investment generated through improved operational efficiency and reduced costs. The competitive landscape is populated by both established technology giants and specialized analytics providers, leading to innovation and a diverse range of solutions available to manufacturers.
Manufacturing Analytics Industry: A Comprehensive Market Report (2019-2033)
This in-depth report provides a comprehensive analysis of the Manufacturing Analytics industry, projecting a market size of $XX Million by 2033. The study covers the period 2019-2033, with 2025 as the base and estimated year. It offers actionable insights for industry professionals, investors, and stakeholders seeking to navigate this rapidly evolving landscape. This report is optimized for search engines, incorporating high-ranking keywords to ensure maximum visibility.
Manufacturing Analytics Industry Market Structure & Innovation Trends
This section analyzes the competitive landscape, identifying key players and their market share, alongside innovative trends shaping the industry. The market concentration is moderately high, with key players such as SAS Institute Inc, TIBCO Software Inc, IBM Corp, QlikTech Inc, DXC Technology Company, Wipro Limited, Northwest Analytics Inc, Alteryx Inc, Salesforce com Inc (Tableau Software Inc), Oracle Corp, Sisense Inc, General Electric Company, and SAP SE holding significant market share. The collective market share of these companies is estimated at XX%.
- Market Share: SAS Institute Inc. holds an estimated XX% market share, followed by IBM Corp. with XX%, and TIBCO Software Inc. with XX%. Other players contribute the remaining XX%.
- M&A Activity: The industry has witnessed significant M&A activity in recent years, with total deal values exceeding $XX Million between 2019 and 2024. These activities are driven by the need to expand product portfolios, access new technologies, and enhance market reach.
- Innovation Drivers: Key drivers include advancements in Artificial Intelligence (AI), Machine Learning (ML), and cloud computing, leading to the development of more sophisticated and user-friendly analytics solutions. Government regulations promoting data-driven decision-making and Industry 4.0 initiatives also contribute significantly.
- Regulatory Framework: Regulations regarding data privacy and security are increasingly impacting industry practices, driving the adoption of robust data governance frameworks and compliance measures.
- Product Substitutes: While specialized software solutions dominate, the rise of open-source alternatives and cloud-based platforms presents competitive pressure.
- End-User Demographics: The majority of end-users are large-scale manufacturers with established IT infrastructure and a need for advanced analytics capabilities.
Manufacturing Analytics Industry Market Dynamics & Trends
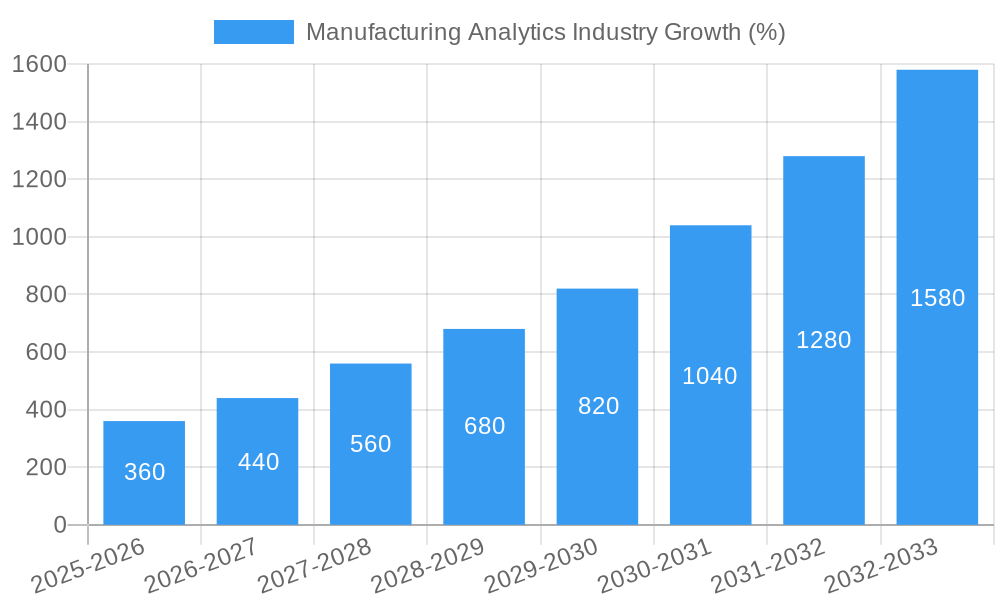
The manufacturing analytics market is experiencing robust growth, driven by several factors. The Compound Annual Growth Rate (CAGR) is projected to be XX% during the forecast period (2025-2033). This growth is fueled by the increasing adoption of smart manufacturing practices, the rising need for real-time data insights, and the growing importance of predictive maintenance to reduce operational costs and downtime. Market penetration is estimated at approximately XX% in 2025, with significant potential for future expansion. Technological disruptions like the proliferation of IoT devices and edge computing are transforming data collection and analysis capabilities, while consumer preferences for personalized products and efficient delivery systems are pushing manufacturers to optimize their supply chains. Competitive dynamics are characterized by continuous innovation, strategic partnerships, and a focus on delivering value-added solutions.
Dominant Regions & Segments in Manufacturing Analytics Industry
North America currently dominates the manufacturing analytics market, driven by high technology adoption rates, robust IT infrastructure, and the presence of major players. However, Asia-Pacific is expected to experience significant growth in the coming years.
By Deployment:
- Cloud-based: This segment holds a significant market share, driven by its scalability, cost-effectiveness, and ease of access.
- On-premise: On-premise solutions remain prevalent in industries with stringent data security requirements or limited internet connectivity.
By Application:
- Supply Chain Optimization: This application area is a major growth driver, as manufacturers strive to improve efficiency and reduce costs.
- Predictive Maintenance: Predictive maintenance solutions are gaining traction, enabling manufacturers to minimize downtime and optimize maintenance schedules.
- Inventory Management: Real-time inventory tracking and optimization are crucial for enhancing operational efficiency and reducing waste.
- Other Applications: This includes areas like quality control, production optimization, and energy management.
By End-user Industry:
- Automotive: The automotive industry is a key adopter of manufacturing analytics, driven by the need for greater efficiency and quality control in vehicle production.
- Electronics: The electronics industry relies heavily on manufacturing analytics for supply chain management, production optimization, and quality control.
- Oil & Gas: The oil and gas industry uses manufacturing analytics to optimize production, reduce downtime, and ensure safety.
- Pharmaceutical: This industry utilizes manufacturing analytics for quality control, compliance, and supply chain management.
- Food & Beverage: The food and beverage industry employs manufacturing analytics for process optimization, supply chain management, and quality control.
- Other End-user Industries: Various other sectors such as aerospace, chemicals, and textiles also adopt manufacturing analytics.
Manufacturing Analytics Industry Product Innovations
Recent product innovations focus on integrating AI, ML, and advanced visualization tools to provide more actionable insights. These solutions emphasize real-time data analysis, predictive capabilities, and seamless integration with existing manufacturing systems. The market is witnessing a shift towards cloud-based, subscription-based models, emphasizing accessibility and scalability. Competitive advantages are achieved through the development of proprietary algorithms, robust data security features, and strong customer support.
Report Scope & Segmentation Analysis
This report segments the manufacturing analytics market by deployment (cloud-based, on-premise), application (inventory management, supply chain optimization, predictive maintenance, other applications), and end-user industry (electronics, oil & gas, automotive, pharmaceutical, food & beverage, other end-user industries). Each segment's growth projection, market size, and competitive dynamics are analyzed, considering factors like technological advancements and regulatory changes. The market size for each segment is predicted to grow significantly over the forecast period. For example, the cloud-based segment is projected to reach $XX Million by 2033, while the supply chain optimization application is estimated to reach $XX Million.
Key Drivers of Manufacturing Analytics Industry Growth
The growth of the manufacturing analytics market is propelled by several factors:
- Technological advancements: The emergence of AI, ML, IoT, and Big Data technologies enables advanced data analysis and predictive modeling.
- Economic factors: The need to improve operational efficiency and reduce costs drives the adoption of manufacturing analytics.
- Regulatory pressures: Regulations promoting data-driven decision making and industry 4.0 initiatives are encouraging companies to adopt analytics solutions.
Challenges in the Manufacturing Analytics Industry Sector
Despite the significant growth potential, the manufacturing analytics industry faces several challenges:
- Data security and privacy concerns: Protecting sensitive manufacturing data is paramount.
- Integration complexities: Integrating analytics solutions with existing legacy systems can be challenging and time-consuming.
- Lack of skilled professionals: A shortage of data scientists and analytics experts hinders the effective implementation of solutions. This shortage impacts the market negatively, slowing down growth by an estimated XX%.
Emerging Opportunities in Manufacturing Analytics Industry
The manufacturing analytics market presents several exciting opportunities:
- Expansion into new industries: Untapped sectors can benefit from adopting analytics solutions.
- Development of niche applications: Specialized solutions for specific industry needs are in demand.
- Leveraging emerging technologies: Integration of technologies like blockchain and digital twins offers exciting new possibilities.
Leading Players in the Manufacturing Analytics Industry Market
- SAS Institute Inc
- TIBCO Software Inc
- IBM Corp
- QlikTech Inc
- DXC Technology Company
- Wipro Limited
- Northwest Analytics Inc
- Alteryx Inc
- Salesforce com Inc (Tableau Software Inc)
- Oracle Corp
- Sisense Inc
- General Electric Company
- SAP SE
Key Developments in Manufacturing Analytics Industry Industry
- January 2023: SAS Institute Inc. launched a new AI-powered manufacturing analytics solution.
- March 2022: IBM Corp. and a major automotive manufacturer announced a strategic partnership to develop advanced predictive maintenance solutions.
- June 2021: TIBCO Software Inc. acquired a smaller analytics firm to expand its product portfolio. (Further details on other developments will be provided in the full report).
Future Outlook for Manufacturing Analytics Industry Market
The manufacturing analytics market is poised for continued strong growth, driven by ongoing technological advancements and the increasing need for data-driven decision-making across various industries. The market is projected to reach $XX Million by 2033, presenting significant opportunities for existing players and new entrants. Strategic partnerships, technological innovation, and a focus on providing value-added solutions will be crucial for success in this competitive landscape.
Manufacturing Analytics Industry Segmentation
-
1. Deployment
- 1.1. Cloud-based
- 1.2. On-premise
-
2. Appllication
- 2.1. Inventory Management
- 2.2. Supply Chain Optimization
- 2.3. Predictive Maintenance
- 2.4. Other Applications
-
3. End-user Industry
- 3.1. Electronics
- 3.2. Oil & Gas
- 3.3. Automotive
- 3.4. Pharmaceutical
- 3.5. Food & Beverage
- 3.6. Other End-user Industries
Manufacturing Analytics Industry Segmentation By Geography
- 1. North America
- 2. Europe
- 3. Asia Pacific
- 4. Latin America
- 5. Middle East
Manufacturing Analytics Industry REPORT HIGHLIGHTS
| Aspects | Details |
|---|---|
| Study Period | 2019-2033 |
| Base Year | 2024 |
| Estimated Year | 2025 |
| Forecast Period | 2025-2033 |
| Historical Period | 2019-2024 |
| Growth Rate | CAGR of 24.00% from 2019-2033 |
| Segmentation |
|
Table of Contents
- 1. Introduction
- 1.1. Research Scope
- 1.2. Market Segmentation
- 1.3. Research Methodology
- 1.4. Definitions and Assumptions
- 2. Executive Summary
- 2.1. Introduction
- 3. Market Dynamics
- 3.1. Introduction
- 3.2. Market Drivers
- 3.2.1. ; Adoption of BI and Advanced Data Management Strategies in Manufacturing Applications; Increasing Application of Industry 4.0 Across Various Segments of Manufacturing Industries
- 3.3. Market Restrains
- 3.3.1. ; High Initial Investment in the Transation of IIoT Across Industrial Region
- 3.4. Market Trends
- 3.4.1. Automotive Sector is Expected to Grow at a Significant Rate
- 4. Market Factor Analysis
- 4.1. Porters Five Forces
- 4.2. Supply/Value Chain
- 4.3. PESTEL analysis
- 4.4. Market Entropy
- 4.5. Patent/Trademark Analysis
- 5. Global Manufacturing Analytics Industry Analysis, Insights and Forecast, 2019-2031
- 5.1. Market Analysis, Insights and Forecast - by Deployment
- 5.1.1. Cloud-based
- 5.1.2. On-premise
- 5.2. Market Analysis, Insights and Forecast - by Appllication
- 5.2.1. Inventory Management
- 5.2.2. Supply Chain Optimization
- 5.2.3. Predictive Maintenance
- 5.2.4. Other Applications
- 5.3. Market Analysis, Insights and Forecast - by End-user Industry
- 5.3.1. Electronics
- 5.3.2. Oil & Gas
- 5.3.3. Automotive
- 5.3.4. Pharmaceutical
- 5.3.5. Food & Beverage
- 5.3.6. Other End-user Industries
- 5.4. Market Analysis, Insights and Forecast - by Region
- 5.4.1. North America
- 5.4.2. Europe
- 5.4.3. Asia Pacific
- 5.4.4. Latin America
- 5.4.5. Middle East
- 5.1. Market Analysis, Insights and Forecast - by Deployment
- 6. North America Manufacturing Analytics Industry Analysis, Insights and Forecast, 2019-2031
- 6.1. Market Analysis, Insights and Forecast - by Deployment
- 6.1.1. Cloud-based
- 6.1.2. On-premise
- 6.2. Market Analysis, Insights and Forecast - by Appllication
- 6.2.1. Inventory Management
- 6.2.2. Supply Chain Optimization
- 6.2.3. Predictive Maintenance
- 6.2.4. Other Applications
- 6.3. Market Analysis, Insights and Forecast - by End-user Industry
- 6.3.1. Electronics
- 6.3.2. Oil & Gas
- 6.3.3. Automotive
- 6.3.4. Pharmaceutical
- 6.3.5. Food & Beverage
- 6.3.6. Other End-user Industries
- 6.1. Market Analysis, Insights and Forecast - by Deployment
- 7. Europe Manufacturing Analytics Industry Analysis, Insights and Forecast, 2019-2031
- 7.1. Market Analysis, Insights and Forecast - by Deployment
- 7.1.1. Cloud-based
- 7.1.2. On-premise
- 7.2. Market Analysis, Insights and Forecast - by Appllication
- 7.2.1. Inventory Management
- 7.2.2. Supply Chain Optimization
- 7.2.3. Predictive Maintenance
- 7.2.4. Other Applications
- 7.3. Market Analysis, Insights and Forecast - by End-user Industry
- 7.3.1. Electronics
- 7.3.2. Oil & Gas
- 7.3.3. Automotive
- 7.3.4. Pharmaceutical
- 7.3.5. Food & Beverage
- 7.3.6. Other End-user Industries
- 7.1. Market Analysis, Insights and Forecast - by Deployment
- 8. Asia Pacific Manufacturing Analytics Industry Analysis, Insights and Forecast, 2019-2031
- 8.1. Market Analysis, Insights and Forecast - by Deployment
- 8.1.1. Cloud-based
- 8.1.2. On-premise
- 8.2. Market Analysis, Insights and Forecast - by Appllication
- 8.2.1. Inventory Management
- 8.2.2. Supply Chain Optimization
- 8.2.3. Predictive Maintenance
- 8.2.4. Other Applications
- 8.3. Market Analysis, Insights and Forecast - by End-user Industry
- 8.3.1. Electronics
- 8.3.2. Oil & Gas
- 8.3.3. Automotive
- 8.3.4. Pharmaceutical
- 8.3.5. Food & Beverage
- 8.3.6. Other End-user Industries
- 8.1. Market Analysis, Insights and Forecast - by Deployment
- 9. Latin America Manufacturing Analytics Industry Analysis, Insights and Forecast, 2019-2031
- 9.1. Market Analysis, Insights and Forecast - by Deployment
- 9.1.1. Cloud-based
- 9.1.2. On-premise
- 9.2. Market Analysis, Insights and Forecast - by Appllication
- 9.2.1. Inventory Management
- 9.2.2. Supply Chain Optimization
- 9.2.3. Predictive Maintenance
- 9.2.4. Other Applications
- 9.3. Market Analysis, Insights and Forecast - by End-user Industry
- 9.3.1. Electronics
- 9.3.2. Oil & Gas
- 9.3.3. Automotive
- 9.3.4. Pharmaceutical
- 9.3.5. Food & Beverage
- 9.3.6. Other End-user Industries
- 9.1. Market Analysis, Insights and Forecast - by Deployment
- 10. Middle East Manufacturing Analytics Industry Analysis, Insights and Forecast, 2019-2031
- 10.1. Market Analysis, Insights and Forecast - by Deployment
- 10.1.1. Cloud-based
- 10.1.2. On-premise
- 10.2. Market Analysis, Insights and Forecast - by Appllication
- 10.2.1. Inventory Management
- 10.2.2. Supply Chain Optimization
- 10.2.3. Predictive Maintenance
- 10.2.4. Other Applications
- 10.3. Market Analysis, Insights and Forecast - by End-user Industry
- 10.3.1. Electronics
- 10.3.2. Oil & Gas
- 10.3.3. Automotive
- 10.3.4. Pharmaceutical
- 10.3.5. Food & Beverage
- 10.3.6. Other End-user Industries
- 10.1. Market Analysis, Insights and Forecast - by Deployment
- 11. North America Manufacturing Analytics Industry Analysis, Insights and Forecast, 2019-2031
- 11.1. Market Analysis, Insights and Forecast - By Country/Sub-region
- 11.1.1 United States
- 11.1.2 Canada
- 11.1.3 Mexico
- 12. Europe Manufacturing Analytics Industry Analysis, Insights and Forecast, 2019-2031
- 12.1. Market Analysis, Insights and Forecast - By Country/Sub-region
- 12.1.1 Germany
- 12.1.2 United Kingdom
- 12.1.3 France
- 12.1.4 Spain
- 12.1.5 Italy
- 12.1.6 Spain
- 12.1.7 Belgium
- 12.1.8 Netherland
- 12.1.9 Nordics
- 12.1.10 Rest of Europe
- 13. Asia Pacific Manufacturing Analytics Industry Analysis, Insights and Forecast, 2019-2031
- 13.1. Market Analysis, Insights and Forecast - By Country/Sub-region
- 13.1.1 China
- 13.1.2 Japan
- 13.1.3 India
- 13.1.4 South Korea
- 13.1.5 Southeast Asia
- 13.1.6 Australia
- 13.1.7 Indonesia
- 13.1.8 Phillipes
- 13.1.9 Singapore
- 13.1.10 Thailandc
- 13.1.11 Rest of Asia Pacific
- 14. South America Manufacturing Analytics Industry Analysis, Insights and Forecast, 2019-2031
- 14.1. Market Analysis, Insights and Forecast - By Country/Sub-region
- 14.1.1 Brazil
- 14.1.2 Argentina
- 14.1.3 Peru
- 14.1.4 Chile
- 14.1.5 Colombia
- 14.1.6 Ecuador
- 14.1.7 Venezuela
- 14.1.8 Rest of South America
- 15. North America Manufacturing Analytics Industry Analysis, Insights and Forecast, 2019-2031
- 15.1. Market Analysis, Insights and Forecast - By Country/Sub-region
- 15.1.1 United States
- 15.1.2 Canada
- 15.1.3 Mexico
- 16. MEA Manufacturing Analytics Industry Analysis, Insights and Forecast, 2019-2031
- 16.1. Market Analysis, Insights and Forecast - By Country/Sub-region
- 16.1.1 United Arab Emirates
- 16.1.2 Saudi Arabia
- 16.1.3 South Africa
- 16.1.4 Rest of Middle East and Africa
- 17. Competitive Analysis
- 17.1. Global Market Share Analysis 2024
- 17.2. Company Profiles
- 17.2.1 SAS Institute Inc
- 17.2.1.1. Overview
- 17.2.1.2. Products
- 17.2.1.3. SWOT Analysis
- 17.2.1.4. Recent Developments
- 17.2.1.5. Financials (Based on Availability)
- 17.2.2 TIBCO Software Inc
- 17.2.2.1. Overview
- 17.2.2.2. Products
- 17.2.2.3. SWOT Analysis
- 17.2.2.4. Recent Developments
- 17.2.2.5. Financials (Based on Availability)
- 17.2.3 IBM Corp
- 17.2.3.1. Overview
- 17.2.3.2. Products
- 17.2.3.3. SWOT Analysis
- 17.2.3.4. Recent Developments
- 17.2.3.5. Financials (Based on Availability)
- 17.2.4 QlikTech Inc
- 17.2.4.1. Overview
- 17.2.4.2. Products
- 17.2.4.3. SWOT Analysis
- 17.2.4.4. Recent Developments
- 17.2.4.5. Financials (Based on Availability)
- 17.2.5 DXC Technology Company
- 17.2.5.1. Overview
- 17.2.5.2. Products
- 17.2.5.3. SWOT Analysis
- 17.2.5.4. Recent Developments
- 17.2.5.5. Financials (Based on Availability)
- 17.2.6 Wipro Limited
- 17.2.6.1. Overview
- 17.2.6.2. Products
- 17.2.6.3. SWOT Analysis
- 17.2.6.4. Recent Developments
- 17.2.6.5. Financials (Based on Availability)
- 17.2.7 Northwest Analytics Inc
- 17.2.7.1. Overview
- 17.2.7.2. Products
- 17.2.7.3. SWOT Analysis
- 17.2.7.4. Recent Developments
- 17.2.7.5. Financials (Based on Availability)
- 17.2.8 Alteryx Inc
- 17.2.8.1. Overview
- 17.2.8.2. Products
- 17.2.8.3. SWOT Analysis
- 17.2.8.4. Recent Developments
- 17.2.8.5. Financials (Based on Availability)
- 17.2.9 Salesforce com Inc (Tableau Software Inc )
- 17.2.9.1. Overview
- 17.2.9.2. Products
- 17.2.9.3. SWOT Analysis
- 17.2.9.4. Recent Developments
- 17.2.9.5. Financials (Based on Availability)
- 17.2.10 Oracle Corp
- 17.2.10.1. Overview
- 17.2.10.2. Products
- 17.2.10.3. SWOT Analysis
- 17.2.10.4. Recent Developments
- 17.2.10.5. Financials (Based on Availability)
- 17.2.11 Sisense Inc
- 17.2.11.1. Overview
- 17.2.11.2. Products
- 17.2.11.3. SWOT Analysis
- 17.2.11.4. Recent Developments
- 17.2.11.5. Financials (Based on Availability)
- 17.2.12 General Electric Company
- 17.2.12.1. Overview
- 17.2.12.2. Products
- 17.2.12.3. SWOT Analysis
- 17.2.12.4. Recent Developments
- 17.2.12.5. Financials (Based on Availability)
- 17.2.13 SAP SE
- 17.2.13.1. Overview
- 17.2.13.2. Products
- 17.2.13.3. SWOT Analysis
- 17.2.13.4. Recent Developments
- 17.2.13.5. Financials (Based on Availability)
- 17.2.1 SAS Institute Inc
List of Figures
- Figure 1: Global Manufacturing Analytics Industry Revenue Breakdown (Million, %) by Region 2024 & 2032
- Figure 2: Global Manufacturing Analytics Industry Volume Breakdown (K Unit, %) by Region 2024 & 2032
- Figure 3: North America Manufacturing Analytics Industry Revenue (Million), by Country 2024 & 2032
- Figure 4: North America Manufacturing Analytics Industry Volume (K Unit), by Country 2024 & 2032
- Figure 5: North America Manufacturing Analytics Industry Revenue Share (%), by Country 2024 & 2032
- Figure 6: North America Manufacturing Analytics Industry Volume Share (%), by Country 2024 & 2032
- Figure 7: Europe Manufacturing Analytics Industry Revenue (Million), by Country 2024 & 2032
- Figure 8: Europe Manufacturing Analytics Industry Volume (K Unit), by Country 2024 & 2032
- Figure 9: Europe Manufacturing Analytics Industry Revenue Share (%), by Country 2024 & 2032
- Figure 10: Europe Manufacturing Analytics Industry Volume Share (%), by Country 2024 & 2032
- Figure 11: Asia Pacific Manufacturing Analytics Industry Revenue (Million), by Country 2024 & 2032
- Figure 12: Asia Pacific Manufacturing Analytics Industry Volume (K Unit), by Country 2024 & 2032
- Figure 13: Asia Pacific Manufacturing Analytics Industry Revenue Share (%), by Country 2024 & 2032
- Figure 14: Asia Pacific Manufacturing Analytics Industry Volume Share (%), by Country 2024 & 2032
- Figure 15: South America Manufacturing Analytics Industry Revenue (Million), by Country 2024 & 2032
- Figure 16: South America Manufacturing Analytics Industry Volume (K Unit), by Country 2024 & 2032
- Figure 17: South America Manufacturing Analytics Industry Revenue Share (%), by Country 2024 & 2032
- Figure 18: South America Manufacturing Analytics Industry Volume Share (%), by Country 2024 & 2032
- Figure 19: North America Manufacturing Analytics Industry Revenue (Million), by Country 2024 & 2032
- Figure 20: North America Manufacturing Analytics Industry Volume (K Unit), by Country 2024 & 2032
- Figure 21: North America Manufacturing Analytics Industry Revenue Share (%), by Country 2024 & 2032
- Figure 22: North America Manufacturing Analytics Industry Volume Share (%), by Country 2024 & 2032
- Figure 23: MEA Manufacturing Analytics Industry Revenue (Million), by Country 2024 & 2032
- Figure 24: MEA Manufacturing Analytics Industry Volume (K Unit), by Country 2024 & 2032
- Figure 25: MEA Manufacturing Analytics Industry Revenue Share (%), by Country 2024 & 2032
- Figure 26: MEA Manufacturing Analytics Industry Volume Share (%), by Country 2024 & 2032
- Figure 27: North America Manufacturing Analytics Industry Revenue (Million), by Deployment 2024 & 2032
- Figure 28: North America Manufacturing Analytics Industry Volume (K Unit), by Deployment 2024 & 2032
- Figure 29: North America Manufacturing Analytics Industry Revenue Share (%), by Deployment 2024 & 2032
- Figure 30: North America Manufacturing Analytics Industry Volume Share (%), by Deployment 2024 & 2032
- Figure 31: North America Manufacturing Analytics Industry Revenue (Million), by Appllication 2024 & 2032
- Figure 32: North America Manufacturing Analytics Industry Volume (K Unit), by Appllication 2024 & 2032
- Figure 33: North America Manufacturing Analytics Industry Revenue Share (%), by Appllication 2024 & 2032
- Figure 34: North America Manufacturing Analytics Industry Volume Share (%), by Appllication 2024 & 2032
- Figure 35: North America Manufacturing Analytics Industry Revenue (Million), by End-user Industry 2024 & 2032
- Figure 36: North America Manufacturing Analytics Industry Volume (K Unit), by End-user Industry 2024 & 2032
- Figure 37: North America Manufacturing Analytics Industry Revenue Share (%), by End-user Industry 2024 & 2032
- Figure 38: North America Manufacturing Analytics Industry Volume Share (%), by End-user Industry 2024 & 2032
- Figure 39: North America Manufacturing Analytics Industry Revenue (Million), by Country 2024 & 2032
- Figure 40: North America Manufacturing Analytics Industry Volume (K Unit), by Country 2024 & 2032
- Figure 41: North America Manufacturing Analytics Industry Revenue Share (%), by Country 2024 & 2032
- Figure 42: North America Manufacturing Analytics Industry Volume Share (%), by Country 2024 & 2032
- Figure 43: Europe Manufacturing Analytics Industry Revenue (Million), by Deployment 2024 & 2032
- Figure 44: Europe Manufacturing Analytics Industry Volume (K Unit), by Deployment 2024 & 2032
- Figure 45: Europe Manufacturing Analytics Industry Revenue Share (%), by Deployment 2024 & 2032
- Figure 46: Europe Manufacturing Analytics Industry Volume Share (%), by Deployment 2024 & 2032
- Figure 47: Europe Manufacturing Analytics Industry Revenue (Million), by Appllication 2024 & 2032
- Figure 48: Europe Manufacturing Analytics Industry Volume (K Unit), by Appllication 2024 & 2032
- Figure 49: Europe Manufacturing Analytics Industry Revenue Share (%), by Appllication 2024 & 2032
- Figure 50: Europe Manufacturing Analytics Industry Volume Share (%), by Appllication 2024 & 2032
- Figure 51: Europe Manufacturing Analytics Industry Revenue (Million), by End-user Industry 2024 & 2032
- Figure 52: Europe Manufacturing Analytics Industry Volume (K Unit), by End-user Industry 2024 & 2032
- Figure 53: Europe Manufacturing Analytics Industry Revenue Share (%), by End-user Industry 2024 & 2032
- Figure 54: Europe Manufacturing Analytics Industry Volume Share (%), by End-user Industry 2024 & 2032
- Figure 55: Europe Manufacturing Analytics Industry Revenue (Million), by Country 2024 & 2032
- Figure 56: Europe Manufacturing Analytics Industry Volume (K Unit), by Country 2024 & 2032
- Figure 57: Europe Manufacturing Analytics Industry Revenue Share (%), by Country 2024 & 2032
- Figure 58: Europe Manufacturing Analytics Industry Volume Share (%), by Country 2024 & 2032
- Figure 59: Asia Pacific Manufacturing Analytics Industry Revenue (Million), by Deployment 2024 & 2032
- Figure 60: Asia Pacific Manufacturing Analytics Industry Volume (K Unit), by Deployment 2024 & 2032
- Figure 61: Asia Pacific Manufacturing Analytics Industry Revenue Share (%), by Deployment 2024 & 2032
- Figure 62: Asia Pacific Manufacturing Analytics Industry Volume Share (%), by Deployment 2024 & 2032
- Figure 63: Asia Pacific Manufacturing Analytics Industry Revenue (Million), by Appllication 2024 & 2032
- Figure 64: Asia Pacific Manufacturing Analytics Industry Volume (K Unit), by Appllication 2024 & 2032
- Figure 65: Asia Pacific Manufacturing Analytics Industry Revenue Share (%), by Appllication 2024 & 2032
- Figure 66: Asia Pacific Manufacturing Analytics Industry Volume Share (%), by Appllication 2024 & 2032
- Figure 67: Asia Pacific Manufacturing Analytics Industry Revenue (Million), by End-user Industry 2024 & 2032
- Figure 68: Asia Pacific Manufacturing Analytics Industry Volume (K Unit), by End-user Industry 2024 & 2032
- Figure 69: Asia Pacific Manufacturing Analytics Industry Revenue Share (%), by End-user Industry 2024 & 2032
- Figure 70: Asia Pacific Manufacturing Analytics Industry Volume Share (%), by End-user Industry 2024 & 2032
- Figure 71: Asia Pacific Manufacturing Analytics Industry Revenue (Million), by Country 2024 & 2032
- Figure 72: Asia Pacific Manufacturing Analytics Industry Volume (K Unit), by Country 2024 & 2032
- Figure 73: Asia Pacific Manufacturing Analytics Industry Revenue Share (%), by Country 2024 & 2032
- Figure 74: Asia Pacific Manufacturing Analytics Industry Volume Share (%), by Country 2024 & 2032
- Figure 75: Latin America Manufacturing Analytics Industry Revenue (Million), by Deployment 2024 & 2032
- Figure 76: Latin America Manufacturing Analytics Industry Volume (K Unit), by Deployment 2024 & 2032
- Figure 77: Latin America Manufacturing Analytics Industry Revenue Share (%), by Deployment 2024 & 2032
- Figure 78: Latin America Manufacturing Analytics Industry Volume Share (%), by Deployment 2024 & 2032
- Figure 79: Latin America Manufacturing Analytics Industry Revenue (Million), by Appllication 2024 & 2032
- Figure 80: Latin America Manufacturing Analytics Industry Volume (K Unit), by Appllication 2024 & 2032
- Figure 81: Latin America Manufacturing Analytics Industry Revenue Share (%), by Appllication 2024 & 2032
- Figure 82: Latin America Manufacturing Analytics Industry Volume Share (%), by Appllication 2024 & 2032
- Figure 83: Latin America Manufacturing Analytics Industry Revenue (Million), by End-user Industry 2024 & 2032
- Figure 84: Latin America Manufacturing Analytics Industry Volume (K Unit), by End-user Industry 2024 & 2032
- Figure 85: Latin America Manufacturing Analytics Industry Revenue Share (%), by End-user Industry 2024 & 2032
- Figure 86: Latin America Manufacturing Analytics Industry Volume Share (%), by End-user Industry 2024 & 2032
- Figure 87: Latin America Manufacturing Analytics Industry Revenue (Million), by Country 2024 & 2032
- Figure 88: Latin America Manufacturing Analytics Industry Volume (K Unit), by Country 2024 & 2032
- Figure 89: Latin America Manufacturing Analytics Industry Revenue Share (%), by Country 2024 & 2032
- Figure 90: Latin America Manufacturing Analytics Industry Volume Share (%), by Country 2024 & 2032
- Figure 91: Middle East Manufacturing Analytics Industry Revenue (Million), by Deployment 2024 & 2032
- Figure 92: Middle East Manufacturing Analytics Industry Volume (K Unit), by Deployment 2024 & 2032
- Figure 93: Middle East Manufacturing Analytics Industry Revenue Share (%), by Deployment 2024 & 2032
- Figure 94: Middle East Manufacturing Analytics Industry Volume Share (%), by Deployment 2024 & 2032
- Figure 95: Middle East Manufacturing Analytics Industry Revenue (Million), by Appllication 2024 & 2032
- Figure 96: Middle East Manufacturing Analytics Industry Volume (K Unit), by Appllication 2024 & 2032
- Figure 97: Middle East Manufacturing Analytics Industry Revenue Share (%), by Appllication 2024 & 2032
- Figure 98: Middle East Manufacturing Analytics Industry Volume Share (%), by Appllication 2024 & 2032
- Figure 99: Middle East Manufacturing Analytics Industry Revenue (Million), by End-user Industry 2024 & 2032
- Figure 100: Middle East Manufacturing Analytics Industry Volume (K Unit), by End-user Industry 2024 & 2032
- Figure 101: Middle East Manufacturing Analytics Industry Revenue Share (%), by End-user Industry 2024 & 2032
- Figure 102: Middle East Manufacturing Analytics Industry Volume Share (%), by End-user Industry 2024 & 2032
- Figure 103: Middle East Manufacturing Analytics Industry Revenue (Million), by Country 2024 & 2032
- Figure 104: Middle East Manufacturing Analytics Industry Volume (K Unit), by Country 2024 & 2032
- Figure 105: Middle East Manufacturing Analytics Industry Revenue Share (%), by Country 2024 & 2032
- Figure 106: Middle East Manufacturing Analytics Industry Volume Share (%), by Country 2024 & 2032
List of Tables
- Table 1: Global Manufacturing Analytics Industry Revenue Million Forecast, by Region 2019 & 2032
- Table 2: Global Manufacturing Analytics Industry Volume K Unit Forecast, by Region 2019 & 2032
- Table 3: Global Manufacturing Analytics Industry Revenue Million Forecast, by Deployment 2019 & 2032
- Table 4: Global Manufacturing Analytics Industry Volume K Unit Forecast, by Deployment 2019 & 2032
- Table 5: Global Manufacturing Analytics Industry Revenue Million Forecast, by Appllication 2019 & 2032
- Table 6: Global Manufacturing Analytics Industry Volume K Unit Forecast, by Appllication 2019 & 2032
- Table 7: Global Manufacturing Analytics Industry Revenue Million Forecast, by End-user Industry 2019 & 2032
- Table 8: Global Manufacturing Analytics Industry Volume K Unit Forecast, by End-user Industry 2019 & 2032
- Table 9: Global Manufacturing Analytics Industry Revenue Million Forecast, by Region 2019 & 2032
- Table 10: Global Manufacturing Analytics Industry Volume K Unit Forecast, by Region 2019 & 2032
- Table 11: Global Manufacturing Analytics Industry Revenue Million Forecast, by Country 2019 & 2032
- Table 12: Global Manufacturing Analytics Industry Volume K Unit Forecast, by Country 2019 & 2032
- Table 13: United States Manufacturing Analytics Industry Revenue (Million) Forecast, by Application 2019 & 2032
- Table 14: United States Manufacturing Analytics Industry Volume (K Unit) Forecast, by Application 2019 & 2032
- Table 15: Canada Manufacturing Analytics Industry Revenue (Million) Forecast, by Application 2019 & 2032
- Table 16: Canada Manufacturing Analytics Industry Volume (K Unit) Forecast, by Application 2019 & 2032
- Table 17: Mexico Manufacturing Analytics Industry Revenue (Million) Forecast, by Application 2019 & 2032
- Table 18: Mexico Manufacturing Analytics Industry Volume (K Unit) Forecast, by Application 2019 & 2032
- Table 19: Global Manufacturing Analytics Industry Revenue Million Forecast, by Country 2019 & 2032
- Table 20: Global Manufacturing Analytics Industry Volume K Unit Forecast, by Country 2019 & 2032
- Table 21: Germany Manufacturing Analytics Industry Revenue (Million) Forecast, by Application 2019 & 2032
- Table 22: Germany Manufacturing Analytics Industry Volume (K Unit) Forecast, by Application 2019 & 2032
- Table 23: United Kingdom Manufacturing Analytics Industry Revenue (Million) Forecast, by Application 2019 & 2032
- Table 24: United Kingdom Manufacturing Analytics Industry Volume (K Unit) Forecast, by Application 2019 & 2032
- Table 25: France Manufacturing Analytics Industry Revenue (Million) Forecast, by Application 2019 & 2032
- Table 26: France Manufacturing Analytics Industry Volume (K Unit) Forecast, by Application 2019 & 2032
- Table 27: Spain Manufacturing Analytics Industry Revenue (Million) Forecast, by Application 2019 & 2032
- Table 28: Spain Manufacturing Analytics Industry Volume (K Unit) Forecast, by Application 2019 & 2032
- Table 29: Italy Manufacturing Analytics Industry Revenue (Million) Forecast, by Application 2019 & 2032
- Table 30: Italy Manufacturing Analytics Industry Volume (K Unit) Forecast, by Application 2019 & 2032
- Table 31: Spain Manufacturing Analytics Industry Revenue (Million) Forecast, by Application 2019 & 2032
- Table 32: Spain Manufacturing Analytics Industry Volume (K Unit) Forecast, by Application 2019 & 2032
- Table 33: Belgium Manufacturing Analytics Industry Revenue (Million) Forecast, by Application 2019 & 2032
- Table 34: Belgium Manufacturing Analytics Industry Volume (K Unit) Forecast, by Application 2019 & 2032
- Table 35: Netherland Manufacturing Analytics Industry Revenue (Million) Forecast, by Application 2019 & 2032
- Table 36: Netherland Manufacturing Analytics Industry Volume (K Unit) Forecast, by Application 2019 & 2032
- Table 37: Nordics Manufacturing Analytics Industry Revenue (Million) Forecast, by Application 2019 & 2032
- Table 38: Nordics Manufacturing Analytics Industry Volume (K Unit) Forecast, by Application 2019 & 2032
- Table 39: Rest of Europe Manufacturing Analytics Industry Revenue (Million) Forecast, by Application 2019 & 2032
- Table 40: Rest of Europe Manufacturing Analytics Industry Volume (K Unit) Forecast, by Application 2019 & 2032
- Table 41: Global Manufacturing Analytics Industry Revenue Million Forecast, by Country 2019 & 2032
- Table 42: Global Manufacturing Analytics Industry Volume K Unit Forecast, by Country 2019 & 2032
- Table 43: China Manufacturing Analytics Industry Revenue (Million) Forecast, by Application 2019 & 2032
- Table 44: China Manufacturing Analytics Industry Volume (K Unit) Forecast, by Application 2019 & 2032
- Table 45: Japan Manufacturing Analytics Industry Revenue (Million) Forecast, by Application 2019 & 2032
- Table 46: Japan Manufacturing Analytics Industry Volume (K Unit) Forecast, by Application 2019 & 2032
- Table 47: India Manufacturing Analytics Industry Revenue (Million) Forecast, by Application 2019 & 2032
- Table 48: India Manufacturing Analytics Industry Volume (K Unit) Forecast, by Application 2019 & 2032
- Table 49: South Korea Manufacturing Analytics Industry Revenue (Million) Forecast, by Application 2019 & 2032
- Table 50: South Korea Manufacturing Analytics Industry Volume (K Unit) Forecast, by Application 2019 & 2032
- Table 51: Southeast Asia Manufacturing Analytics Industry Revenue (Million) Forecast, by Application 2019 & 2032
- Table 52: Southeast Asia Manufacturing Analytics Industry Volume (K Unit) Forecast, by Application 2019 & 2032
- Table 53: Australia Manufacturing Analytics Industry Revenue (Million) Forecast, by Application 2019 & 2032
- Table 54: Australia Manufacturing Analytics Industry Volume (K Unit) Forecast, by Application 2019 & 2032
- Table 55: Indonesia Manufacturing Analytics Industry Revenue (Million) Forecast, by Application 2019 & 2032
- Table 56: Indonesia Manufacturing Analytics Industry Volume (K Unit) Forecast, by Application 2019 & 2032
- Table 57: Phillipes Manufacturing Analytics Industry Revenue (Million) Forecast, by Application 2019 & 2032
- Table 58: Phillipes Manufacturing Analytics Industry Volume (K Unit) Forecast, by Application 2019 & 2032
- Table 59: Singapore Manufacturing Analytics Industry Revenue (Million) Forecast, by Application 2019 & 2032
- Table 60: Singapore Manufacturing Analytics Industry Volume (K Unit) Forecast, by Application 2019 & 2032
- Table 61: Thailandc Manufacturing Analytics Industry Revenue (Million) Forecast, by Application 2019 & 2032
- Table 62: Thailandc Manufacturing Analytics Industry Volume (K Unit) Forecast, by Application 2019 & 2032
- Table 63: Rest of Asia Pacific Manufacturing Analytics Industry Revenue (Million) Forecast, by Application 2019 & 2032
- Table 64: Rest of Asia Pacific Manufacturing Analytics Industry Volume (K Unit) Forecast, by Application 2019 & 2032
- Table 65: Global Manufacturing Analytics Industry Revenue Million Forecast, by Country 2019 & 2032
- Table 66: Global Manufacturing Analytics Industry Volume K Unit Forecast, by Country 2019 & 2032
- Table 67: Brazil Manufacturing Analytics Industry Revenue (Million) Forecast, by Application 2019 & 2032
- Table 68: Brazil Manufacturing Analytics Industry Volume (K Unit) Forecast, by Application 2019 & 2032
- Table 69: Argentina Manufacturing Analytics Industry Revenue (Million) Forecast, by Application 2019 & 2032
- Table 70: Argentina Manufacturing Analytics Industry Volume (K Unit) Forecast, by Application 2019 & 2032
- Table 71: Peru Manufacturing Analytics Industry Revenue (Million) Forecast, by Application 2019 & 2032
- Table 72: Peru Manufacturing Analytics Industry Volume (K Unit) Forecast, by Application 2019 & 2032
- Table 73: Chile Manufacturing Analytics Industry Revenue (Million) Forecast, by Application 2019 & 2032
- Table 74: Chile Manufacturing Analytics Industry Volume (K Unit) Forecast, by Application 2019 & 2032
- Table 75: Colombia Manufacturing Analytics Industry Revenue (Million) Forecast, by Application 2019 & 2032
- Table 76: Colombia Manufacturing Analytics Industry Volume (K Unit) Forecast, by Application 2019 & 2032
- Table 77: Ecuador Manufacturing Analytics Industry Revenue (Million) Forecast, by Application 2019 & 2032
- Table 78: Ecuador Manufacturing Analytics Industry Volume (K Unit) Forecast, by Application 2019 & 2032
- Table 79: Venezuela Manufacturing Analytics Industry Revenue (Million) Forecast, by Application 2019 & 2032
- Table 80: Venezuela Manufacturing Analytics Industry Volume (K Unit) Forecast, by Application 2019 & 2032
- Table 81: Rest of South America Manufacturing Analytics Industry Revenue (Million) Forecast, by Application 2019 & 2032
- Table 82: Rest of South America Manufacturing Analytics Industry Volume (K Unit) Forecast, by Application 2019 & 2032
- Table 83: Global Manufacturing Analytics Industry Revenue Million Forecast, by Country 2019 & 2032
- Table 84: Global Manufacturing Analytics Industry Volume K Unit Forecast, by Country 2019 & 2032
- Table 85: United States Manufacturing Analytics Industry Revenue (Million) Forecast, by Application 2019 & 2032
- Table 86: United States Manufacturing Analytics Industry Volume (K Unit) Forecast, by Application 2019 & 2032
- Table 87: Canada Manufacturing Analytics Industry Revenue (Million) Forecast, by Application 2019 & 2032
- Table 88: Canada Manufacturing Analytics Industry Volume (K Unit) Forecast, by Application 2019 & 2032
- Table 89: Mexico Manufacturing Analytics Industry Revenue (Million) Forecast, by Application 2019 & 2032
- Table 90: Mexico Manufacturing Analytics Industry Volume (K Unit) Forecast, by Application 2019 & 2032
- Table 91: Global Manufacturing Analytics Industry Revenue Million Forecast, by Country 2019 & 2032
- Table 92: Global Manufacturing Analytics Industry Volume K Unit Forecast, by Country 2019 & 2032
- Table 93: United Arab Emirates Manufacturing Analytics Industry Revenue (Million) Forecast, by Application 2019 & 2032
- Table 94: United Arab Emirates Manufacturing Analytics Industry Volume (K Unit) Forecast, by Application 2019 & 2032
- Table 95: Saudi Arabia Manufacturing Analytics Industry Revenue (Million) Forecast, by Application 2019 & 2032
- Table 96: Saudi Arabia Manufacturing Analytics Industry Volume (K Unit) Forecast, by Application 2019 & 2032
- Table 97: South Africa Manufacturing Analytics Industry Revenue (Million) Forecast, by Application 2019 & 2032
- Table 98: South Africa Manufacturing Analytics Industry Volume (K Unit) Forecast, by Application 2019 & 2032
- Table 99: Rest of Middle East and Africa Manufacturing Analytics Industry Revenue (Million) Forecast, by Application 2019 & 2032
- Table 100: Rest of Middle East and Africa Manufacturing Analytics Industry Volume (K Unit) Forecast, by Application 2019 & 2032
- Table 101: Global Manufacturing Analytics Industry Revenue Million Forecast, by Deployment 2019 & 2032
- Table 102: Global Manufacturing Analytics Industry Volume K Unit Forecast, by Deployment 2019 & 2032
- Table 103: Global Manufacturing Analytics Industry Revenue Million Forecast, by Appllication 2019 & 2032
- Table 104: Global Manufacturing Analytics Industry Volume K Unit Forecast, by Appllication 2019 & 2032
- Table 105: Global Manufacturing Analytics Industry Revenue Million Forecast, by End-user Industry 2019 & 2032
- Table 106: Global Manufacturing Analytics Industry Volume K Unit Forecast, by End-user Industry 2019 & 2032
- Table 107: Global Manufacturing Analytics Industry Revenue Million Forecast, by Country 2019 & 2032
- Table 108: Global Manufacturing Analytics Industry Volume K Unit Forecast, by Country 2019 & 2032
- Table 109: Global Manufacturing Analytics Industry Revenue Million Forecast, by Deployment 2019 & 2032
- Table 110: Global Manufacturing Analytics Industry Volume K Unit Forecast, by Deployment 2019 & 2032
- Table 111: Global Manufacturing Analytics Industry Revenue Million Forecast, by Appllication 2019 & 2032
- Table 112: Global Manufacturing Analytics Industry Volume K Unit Forecast, by Appllication 2019 & 2032
- Table 113: Global Manufacturing Analytics Industry Revenue Million Forecast, by End-user Industry 2019 & 2032
- Table 114: Global Manufacturing Analytics Industry Volume K Unit Forecast, by End-user Industry 2019 & 2032
- Table 115: Global Manufacturing Analytics Industry Revenue Million Forecast, by Country 2019 & 2032
- Table 116: Global Manufacturing Analytics Industry Volume K Unit Forecast, by Country 2019 & 2032
- Table 117: Global Manufacturing Analytics Industry Revenue Million Forecast, by Deployment 2019 & 2032
- Table 118: Global Manufacturing Analytics Industry Volume K Unit Forecast, by Deployment 2019 & 2032
- Table 119: Global Manufacturing Analytics Industry Revenue Million Forecast, by Appllication 2019 & 2032
- Table 120: Global Manufacturing Analytics Industry Volume K Unit Forecast, by Appllication 2019 & 2032
- Table 121: Global Manufacturing Analytics Industry Revenue Million Forecast, by End-user Industry 2019 & 2032
- Table 122: Global Manufacturing Analytics Industry Volume K Unit Forecast, by End-user Industry 2019 & 2032
- Table 123: Global Manufacturing Analytics Industry Revenue Million Forecast, by Country 2019 & 2032
- Table 124: Global Manufacturing Analytics Industry Volume K Unit Forecast, by Country 2019 & 2032
- Table 125: Global Manufacturing Analytics Industry Revenue Million Forecast, by Deployment 2019 & 2032
- Table 126: Global Manufacturing Analytics Industry Volume K Unit Forecast, by Deployment 2019 & 2032
- Table 127: Global Manufacturing Analytics Industry Revenue Million Forecast, by Appllication 2019 & 2032
- Table 128: Global Manufacturing Analytics Industry Volume K Unit Forecast, by Appllication 2019 & 2032
- Table 129: Global Manufacturing Analytics Industry Revenue Million Forecast, by End-user Industry 2019 & 2032
- Table 130: Global Manufacturing Analytics Industry Volume K Unit Forecast, by End-user Industry 2019 & 2032
- Table 131: Global Manufacturing Analytics Industry Revenue Million Forecast, by Country 2019 & 2032
- Table 132: Global Manufacturing Analytics Industry Volume K Unit Forecast, by Country 2019 & 2032
- Table 133: Global Manufacturing Analytics Industry Revenue Million Forecast, by Deployment 2019 & 2032
- Table 134: Global Manufacturing Analytics Industry Volume K Unit Forecast, by Deployment 2019 & 2032
- Table 135: Global Manufacturing Analytics Industry Revenue Million Forecast, by Appllication 2019 & 2032
- Table 136: Global Manufacturing Analytics Industry Volume K Unit Forecast, by Appllication 2019 & 2032
- Table 137: Global Manufacturing Analytics Industry Revenue Million Forecast, by End-user Industry 2019 & 2032
- Table 138: Global Manufacturing Analytics Industry Volume K Unit Forecast, by End-user Industry 2019 & 2032
- Table 139: Global Manufacturing Analytics Industry Revenue Million Forecast, by Country 2019 & 2032
- Table 140: Global Manufacturing Analytics Industry Volume K Unit Forecast, by Country 2019 & 2032
Frequently Asked Questions
1. What is the projected Compound Annual Growth Rate (CAGR) of the Manufacturing Analytics Industry?
The projected CAGR is approximately 24.00%.
2. Which companies are prominent players in the Manufacturing Analytics Industry?
Key companies in the market include SAS Institute Inc, TIBCO Software Inc, IBM Corp, QlikTech Inc, DXC Technology Company, Wipro Limited, Northwest Analytics Inc, Alteryx Inc, Salesforce com Inc (Tableau Software Inc ), Oracle Corp, Sisense Inc, General Electric Company, SAP SE.
3. What are the main segments of the Manufacturing Analytics Industry?
The market segments include Deployment, Appllication, End-user Industry.
4. Can you provide details about the market size?
The market size is estimated to be USD XX Million as of 2022.
5. What are some drivers contributing to market growth?
; Adoption of BI and Advanced Data Management Strategies in Manufacturing Applications; Increasing Application of Industry 4.0 Across Various Segments of Manufacturing Industries.
6. What are the notable trends driving market growth?
Automotive Sector is Expected to Grow at a Significant Rate.
7. Are there any restraints impacting market growth?
; High Initial Investment in the Transation of IIoT Across Industrial Region.
8. Can you provide examples of recent developments in the market?
N/A
9. What pricing options are available for accessing the report?
Pricing options include single-user, multi-user, and enterprise licenses priced at USD 4750, USD 5250, and USD 8750 respectively.
10. Is the market size provided in terms of value or volume?
The market size is provided in terms of value, measured in Million and volume, measured in K Unit.
11. Are there any specific market keywords associated with the report?
Yes, the market keyword associated with the report is "Manufacturing Analytics Industry," which aids in identifying and referencing the specific market segment covered.
12. How do I determine which pricing option suits my needs best?
The pricing options vary based on user requirements and access needs. Individual users may opt for single-user licenses, while businesses requiring broader access may choose multi-user or enterprise licenses for cost-effective access to the report.
13. Are there any additional resources or data provided in the Manufacturing Analytics Industry report?
While the report offers comprehensive insights, it's advisable to review the specific contents or supplementary materials provided to ascertain if additional resources or data are available.
14. How can I stay updated on further developments or reports in the Manufacturing Analytics Industry?
To stay informed about further developments, trends, and reports in the Manufacturing Analytics Industry, consider subscribing to industry newsletters, following relevant companies and organizations, or regularly checking reputable industry news sources and publications.
Methodology
Step 1 - Identification of Relevant Samples Size from Population Database


Step 2 - Approaches for Defining Global Market Size (Value, Volume* & Price*)

Note*: In applicable scenarios
Step 3 - Data Sources
Primary Research
- Web Analytics
- Survey Reports
- Research Institute
- Latest Research Reports
- Opinion Leaders
Secondary Research
- Annual Reports
- White Paper
- Latest Press Release
- Industry Association
- Paid Database
- Investor Presentations

Step 4 - Data Triangulation
Involves using different sources of information in order to increase the validity of a study
These sources are likely to be stakeholders in a program - participants, other researchers, program staff, other community members, and so on.
Then we put all data in single framework & apply various statistical tools to find out the dynamic on the market.
During the analysis stage, feedback from the stakeholder groups would be compared to determine areas of agreement as well as areas of divergence


