
Key Insights
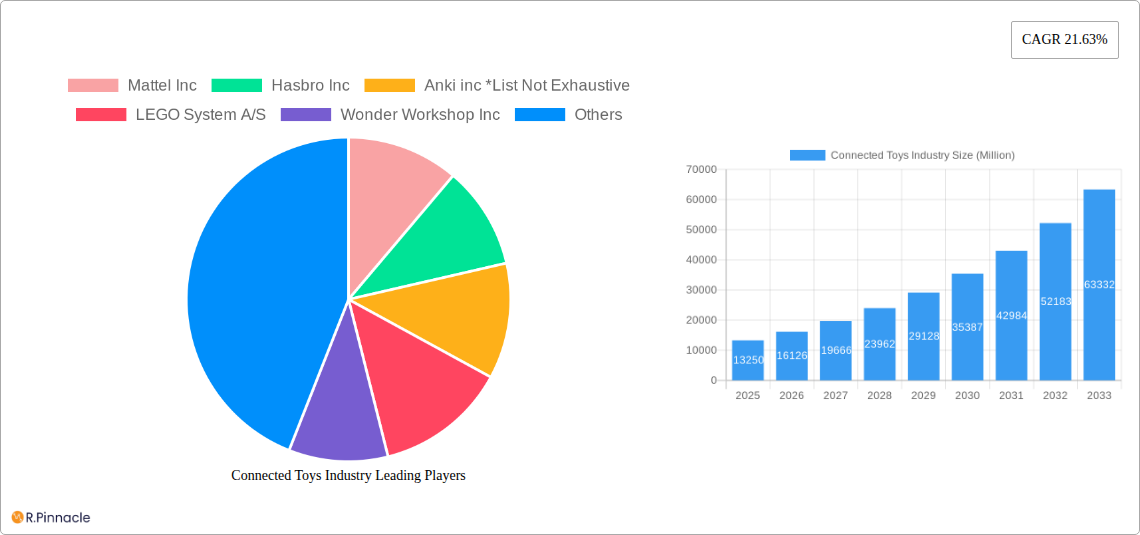
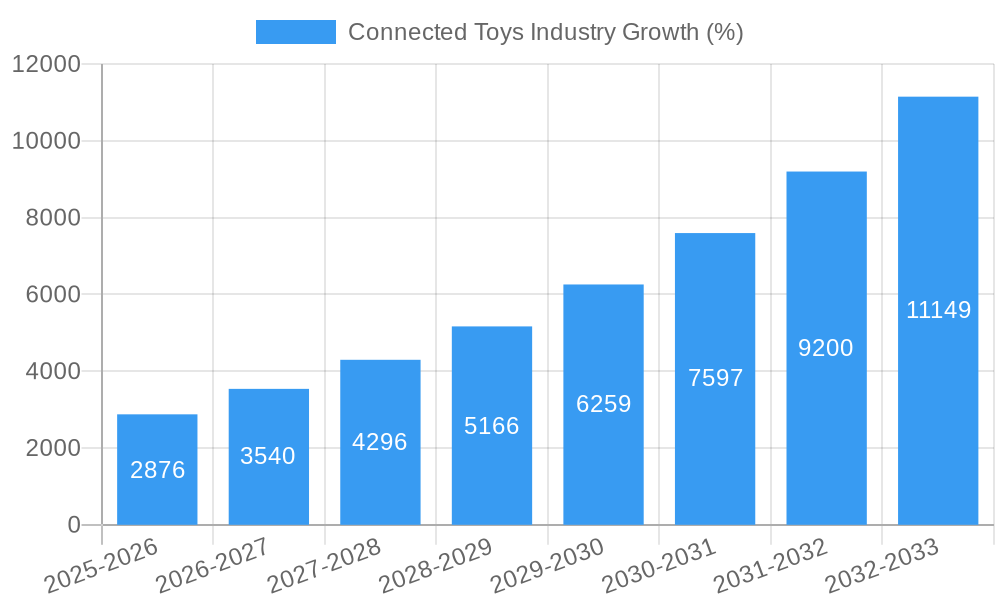
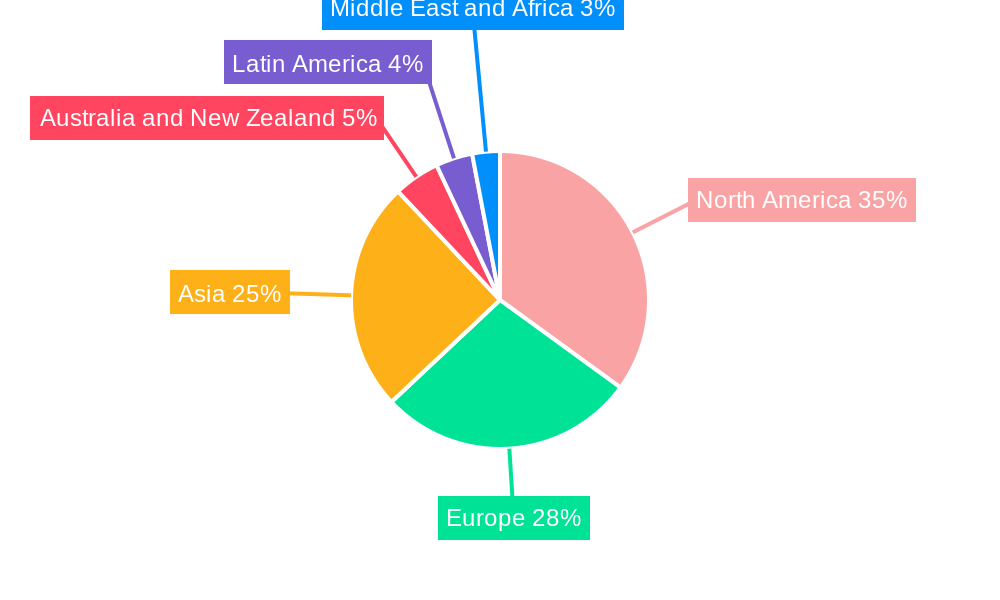
The connected toys market, valued at $13.25 billion in 2025, is experiencing robust growth, projected to expand at a Compound Annual Growth Rate (CAGR) of 21.63% from 2025 to 2033. This surge is fueled by several key factors. Increasing smartphone and tablet penetration, particularly among children, provides a readily available platform for interaction with these toys. Furthermore, advancements in technology, such as improved connectivity, sophisticated AI integration, and enhanced user interfaces, are driving innovation and creating more engaging and educational play experiences. Parents are also increasingly seeking educational and developmental toys, and connected toys often offer features that cater to these needs, further boosting market demand. The market segmentation reveals a strong preference for smartphone-connected toys, followed by console and tablet-connected options, reflecting the prevalent usage patterns of children and their access to these devices. Competition is fierce, with established players like Mattel, Hasbro, and LEGO vying for market share alongside innovative startups like Anki (though now defunct, its legacy contributes to the market's technological advancements) and Wonder Workshop. The geographical distribution likely shows North America and Europe as leading regions, given their high technological adoption rates and disposable income levels, while Asia is anticipated to experience significant growth driven by increasing purchasing power and a large child population.
The future growth of the connected toys market hinges on continuous technological innovation, ensuring seamless connectivity, enhanced safety features, and affordability. Addressing potential concerns regarding data privacy and screen time will be crucial for sustained market expansion. The market's evolution will likely see an increased integration of augmented and virtual reality technologies, creating even more immersive play experiences. The rise of subscription-based models and the incorporation of personalized learning features within the toys are also likely future trends, further driving market value and fostering customer loyalty. A focus on developing toys that cater to diverse age groups and interests will also be vital for capturing a wider consumer base and ensuring the continued success of the connected toys market.
Connected Toys Industry Market Report: 2019-2033
This comprehensive report provides an in-depth analysis of the Connected Toys Industry, offering invaluable insights for industry professionals, investors, and strategists. Covering the period from 2019 to 2033, with a focus on the estimated year 2025, this report meticulously examines market dynamics, segmentation, key players, and future growth potential. The report leverages extensive data analysis to predict a market value exceeding $XX Million by 2033.
Connected Toys Industry Market Structure & Innovation Trends
The Connected Toys market, valued at $XX Million in 2024, exhibits a moderately concentrated structure, with key players like Mattel Inc, Hasbro Inc, LEGO System A/S, and others holding significant market share. Market concentration is expected to slightly increase by 2033, driven by strategic mergers and acquisitions (M&A). Innovation is primarily fueled by advancements in AI, augmented reality (AR), and connectivity technologies, leading to increasingly sophisticated and interactive toys. Regulatory frameworks, particularly concerning data privacy and children's safety, significantly influence market dynamics. Product substitutes, such as traditional toys and digital entertainment platforms, pose a continuous competitive challenge. The end-user demographic is predominantly children aged 3-12, with a growing segment of older children and teenagers embracing technologically advanced play experiences. The historical period (2019-2024) witnessed several significant M&A activities, with deal values totaling approximately $XX Million.
- Market Share: Mattel Inc holds approximately XX%, Hasbro Inc holds approximately XX%, and LEGO System A/S holds approximately XX%. The remaining share is distributed among several smaller players.
- M&A Activity (2019-2024): Significant deals include [mention specific deals and values, if available. Otherwise use "Several notable acquisitions occurred, involving a combined value of approximately $XX Million"].
Connected Toys Industry Market Dynamics & Trends
The Connected Toys market is experiencing robust growth, driven by increasing smartphone penetration, rising disposable incomes in developing economies, and a growing preference for interactive and engaging play experiences. The Compound Annual Growth Rate (CAGR) during the forecast period (2025-2033) is projected to be XX%. Technological disruptions, such as the integration of AI and AR, are fundamentally reshaping the industry, while consumer preferences are shifting towards personalized and educational toys. The competitive landscape is dynamic, with established players facing competition from innovative startups. Market penetration is currently estimated at XX% globally, with substantial room for growth in emerging markets.
Dominant Regions & Segments in Connected Toys Industry
The North American region currently dominates the Connected Toys market, driven by high consumer spending, robust technological infrastructure, and the presence of major players like Mattel Inc. and Hasbro Inc. Europe and Asia-Pacific are also significant markets, exhibiting strong growth potential.
- By Type:
- Smartphone Connected Toys: This segment holds the largest market share, driven by the widespread adoption of smartphones and their integration with various toys.
- Console Connected Toys: This segment exhibits moderate growth, primarily driven by the popularity of gaming consoles among children and teenagers.
- Tablet Connected Toys: This segment shows steady growth, influenced by the increasing use of tablets for entertainment and education.
Key Drivers for North American Dominance:
- Strong consumer spending power.
- Developed technological infrastructure facilitating widespread adoption.
- Presence of major toy manufacturers and robust distribution networks.
Connected Toys Industry Product Innovations
Recent product innovations in the Connected Toys sector emphasize enhanced interactivity, personalization, and educational value. Integration of AI facilitates customized gameplay experiences, while AR enhances immersive play scenarios. These technological trends reflect a growing demand for toys that engage children intellectually and socially, catering to the evolving preferences of parents and educators. The market is witnessing the emergence of toys incorporating IoT technologies, offering enhanced connectivity and data-driven insights into children's play patterns.
Report Scope & Segmentation Analysis
This report segments the Connected Toys market by type: Smartphone Connected Toys, Console Connected Toys, and Tablet Connected Toys. Each segment is analyzed based on market size, growth projections, and competitive dynamics. For instance, the Smartphone Connected Toys segment is projected to experience significant growth due to the ubiquitous nature of smartphones. The Console Connected Toys segment will see growth driven by new game releases and console upgrades. The Tablet Connected Toys segment will continue to grow, though more modestly, due to the already high penetration of tablets.
Key Drivers of Connected Toys Industry Growth
Technological advancements, such as AI, AR, and IoT, are key drivers of growth. Rising disposable incomes, particularly in developing economies, contribute significantly. Favorable regulatory frameworks supporting innovation also play a vital role. Increasing demand for educational toys with learning elements further fuel the market's expansion. The evolving parent preference for screen-time management also contributes to the growing appeal of connected toys with educational and skill-building content.
Challenges in the Connected Toys Industry Sector
Data privacy concerns and stringent regulatory requirements pose significant challenges. Supply chain disruptions and increased raw material costs impact profitability. Intense competition among established players and new entrants creates price pressure. Ensuring product safety and avoiding potential hazards related to connectivity and data handling are paramount concerns, impacting the industry's growth.
Emerging Opportunities in Connected Toys Industry
The integration of AI and machine learning opens avenues for creating highly personalized play experiences. Expansion into new markets, particularly in developing economies, presents substantial opportunities for growth. The rise of educational toys with gamified learning elements is a significant emerging trend. Focus on sustainable and ethically sourced materials provides an opportunity to meet growing consumer demands for eco-friendly products.
Leading Players in the Connected Toys Industry Market
- Mattel Inc
- Hasbro Inc
- Anki inc
- LEGO System A/S
- Wonder Workshop Inc
- Sphero
- WowWee Group Limited
- Leka SAS
- Sony Corporation
- Bandai Namco Entertainment Inc
Key Developments in Connected Toys Industry
- March 2023: The Lego Group reported a significant profit increase, investing in production and opening 155 new stores. This demonstrates the substantial market demand and the company's strategic response to meet it.
- January 2022: LEGO discontinued its VIDIYO product line, highlighting the dynamic nature of the market and the importance of adapting to changing consumer preferences and technological advancements.
Future Outlook for Connected Toys Industry Market
The Connected Toys market is poised for substantial growth driven by technological innovations, rising consumer spending, and a growing preference for interactive and educational play experiences. Strategic collaborations, targeted product development, and expansion into new markets will be crucial for success in this dynamic sector. The increasing focus on safety, security, and data privacy will shape the future of the industry. The market is expected to see an increase in value due to these factors.
Connected Toys Industry Segmentation
-
1. Type
- 1.1. Smartphone Connected Toys
- 1.2. Console Connected Toys
- 1.3. Tablet Connected Toys
Connected Toys Industry Segmentation By Geography
- 1. North America
- 2. Europe
- 3. Asia
- 4. Australia and New Zealand
- 5. Latin America
- 6. Middle East and Africa
Connected Toys Industry REPORT HIGHLIGHTS
| Aspects | Details |
|---|---|
| Study Period | 2019-2033 |
| Base Year | 2024 |
| Estimated Year | 2025 |
| Forecast Period | 2025-2033 |
| Historical Period | 2019-2024 |
| Growth Rate | CAGR of 21.63% from 2019-2033 |
| Segmentation |
|
Table of Contents
- 1. Introduction
- 1.1. Research Scope
- 1.2. Market Segmentation
- 1.3. Research Methodology
- 1.4. Definitions and Assumptions
- 2. Executive Summary
- 2.1. Introduction
- 3. Market Dynamics
- 3.1. Introduction
- 3.2. Market Drivers
- 3.2.1. Easy Availability of Connected Platforms
- 3.3. Market Restrains
- 3.3.1. Fragmented Market with Several Local Vendors
- 3.4. Market Trends
- 3.4.1. Smartphone Connected Toys are Expected to Witness Significant Growth
- 4. Market Factor Analysis
- 4.1. Porters Five Forces
- 4.2. Supply/Value Chain
- 4.3. PESTEL analysis
- 4.4. Market Entropy
- 4.5. Patent/Trademark Analysis
- 5. Global Connected Toys Industry Analysis, Insights and Forecast, 2019-2031
- 5.1. Market Analysis, Insights and Forecast - by Type
- 5.1.1. Smartphone Connected Toys
- 5.1.2. Console Connected Toys
- 5.1.3. Tablet Connected Toys
- 5.2. Market Analysis, Insights and Forecast - by Region
- 5.2.1. North America
- 5.2.2. Europe
- 5.2.3. Asia
- 5.2.4. Australia and New Zealand
- 5.2.5. Latin America
- 5.2.6. Middle East and Africa
- 5.1. Market Analysis, Insights and Forecast - by Type
- 6. North America Connected Toys Industry Analysis, Insights and Forecast, 2019-2031
- 6.1. Market Analysis, Insights and Forecast - by Type
- 6.1.1. Smartphone Connected Toys
- 6.1.2. Console Connected Toys
- 6.1.3. Tablet Connected Toys
- 6.1. Market Analysis, Insights and Forecast - by Type
- 7. Europe Connected Toys Industry Analysis, Insights and Forecast, 2019-2031
- 7.1. Market Analysis, Insights and Forecast - by Type
- 7.1.1. Smartphone Connected Toys
- 7.1.2. Console Connected Toys
- 7.1.3. Tablet Connected Toys
- 7.1. Market Analysis, Insights and Forecast - by Type
- 8. Asia Connected Toys Industry Analysis, Insights and Forecast, 2019-2031
- 8.1. Market Analysis, Insights and Forecast - by Type
- 8.1.1. Smartphone Connected Toys
- 8.1.2. Console Connected Toys
- 8.1.3. Tablet Connected Toys
- 8.1. Market Analysis, Insights and Forecast - by Type
- 9. Australia and New Zealand Connected Toys Industry Analysis, Insights and Forecast, 2019-2031
- 9.1. Market Analysis, Insights and Forecast - by Type
- 9.1.1. Smartphone Connected Toys
- 9.1.2. Console Connected Toys
- 9.1.3. Tablet Connected Toys
- 9.1. Market Analysis, Insights and Forecast - by Type
- 10. Latin America Connected Toys Industry Analysis, Insights and Forecast, 2019-2031
- 10.1. Market Analysis, Insights and Forecast - by Type
- 10.1.1. Smartphone Connected Toys
- 10.1.2. Console Connected Toys
- 10.1.3. Tablet Connected Toys
- 10.1. Market Analysis, Insights and Forecast - by Type
- 11. Middle East and Africa Connected Toys Industry Analysis, Insights and Forecast, 2019-2031
- 11.1. Market Analysis, Insights and Forecast - by Type
- 11.1.1. Smartphone Connected Toys
- 11.1.2. Console Connected Toys
- 11.1.3. Tablet Connected Toys
- 11.1. Market Analysis, Insights and Forecast - by Type
- 12. North America Connected Toys Industry Analysis, Insights and Forecast, 2019-2031
- 12.1. Market Analysis, Insights and Forecast - By Country/Sub-region
- 12.1.1.
- 13. Europe Connected Toys Industry Analysis, Insights and Forecast, 2019-2031
- 13.1. Market Analysis, Insights and Forecast - By Country/Sub-region
- 13.1.1.
- 14. Asia Connected Toys Industry Analysis, Insights and Forecast, 2019-2031
- 14.1. Market Analysis, Insights and Forecast - By Country/Sub-region
- 14.1.1.
- 15. Australia and New Zealand Connected Toys Industry Analysis, Insights and Forecast, 2019-2031
- 15.1. Market Analysis, Insights and Forecast - By Country/Sub-region
- 15.1.1.
- 16. Latin America Connected Toys Industry Analysis, Insights and Forecast, 2019-2031
- 16.1. Market Analysis, Insights and Forecast - By Country/Sub-region
- 16.1.1.
- 17. Middle East and Africa Connected Toys Industry Analysis, Insights and Forecast, 2019-2031
- 17.1. Market Analysis, Insights and Forecast - By Country/Sub-region
- 17.1.1.
- 18. Competitive Analysis
- 18.1. Global Market Share Analysis 2024
- 18.2. Company Profiles
- 18.2.1 Mattel Inc
- 18.2.1.1. Overview
- 18.2.1.2. Products
- 18.2.1.3. SWOT Analysis
- 18.2.1.4. Recent Developments
- 18.2.1.5. Financials (Based on Availability)
- 18.2.2 Hasbro Inc
- 18.2.2.1. Overview
- 18.2.2.2. Products
- 18.2.2.3. SWOT Analysis
- 18.2.2.4. Recent Developments
- 18.2.2.5. Financials (Based on Availability)
- 18.2.3 Anki inc *List Not Exhaustive
- 18.2.3.1. Overview
- 18.2.3.2. Products
- 18.2.3.3. SWOT Analysis
- 18.2.3.4. Recent Developments
- 18.2.3.5. Financials (Based on Availability)
- 18.2.4 LEGO System A/S
- 18.2.4.1. Overview
- 18.2.4.2. Products
- 18.2.4.3. SWOT Analysis
- 18.2.4.4. Recent Developments
- 18.2.4.5. Financials (Based on Availability)
- 18.2.5 Wonder Workshop Inc
- 18.2.5.1. Overview
- 18.2.5.2. Products
- 18.2.5.3. SWOT Analysis
- 18.2.5.4. Recent Developments
- 18.2.5.5. Financials (Based on Availability)
- 18.2.6 Sphero
- 18.2.6.1. Overview
- 18.2.6.2. Products
- 18.2.6.3. SWOT Analysis
- 18.2.6.4. Recent Developments
- 18.2.6.5. Financials (Based on Availability)
- 18.2.7 WowWee Group Limited
- 18.2.7.1. Overview
- 18.2.7.2. Products
- 18.2.7.3. SWOT Analysis
- 18.2.7.4. Recent Developments
- 18.2.7.5. Financials (Based on Availability)
- 18.2.8 Leka SAS
- 18.2.8.1. Overview
- 18.2.8.2. Products
- 18.2.8.3. SWOT Analysis
- 18.2.8.4. Recent Developments
- 18.2.8.5. Financials (Based on Availability)
- 18.2.9 Sony Corporation
- 18.2.9.1. Overview
- 18.2.9.2. Products
- 18.2.9.3. SWOT Analysis
- 18.2.9.4. Recent Developments
- 18.2.9.5. Financials (Based on Availability)
- 18.2.10 Bandai Namco Entertainment Inc
- 18.2.10.1. Overview
- 18.2.10.2. Products
- 18.2.10.3. SWOT Analysis
- 18.2.10.4. Recent Developments
- 18.2.10.5. Financials (Based on Availability)
- 18.2.1 Mattel Inc
List of Figures
- Figure 1: Global Connected Toys Industry Revenue Breakdown (Million, %) by Region 2024 & 2032
- Figure 2: North America Connected Toys Industry Revenue (Million), by Country 2024 & 2032
- Figure 3: North America Connected Toys Industry Revenue Share (%), by Country 2024 & 2032
- Figure 4: Europe Connected Toys Industry Revenue (Million), by Country 2024 & 2032
- Figure 5: Europe Connected Toys Industry Revenue Share (%), by Country 2024 & 2032
- Figure 6: Asia Connected Toys Industry Revenue (Million), by Country 2024 & 2032
- Figure 7: Asia Connected Toys Industry Revenue Share (%), by Country 2024 & 2032
- Figure 8: Australia and New Zealand Connected Toys Industry Revenue (Million), by Country 2024 & 2032
- Figure 9: Australia and New Zealand Connected Toys Industry Revenue Share (%), by Country 2024 & 2032
- Figure 10: Latin America Connected Toys Industry Revenue (Million), by Country 2024 & 2032
- Figure 11: Latin America Connected Toys Industry Revenue Share (%), by Country 2024 & 2032
- Figure 12: Middle East and Africa Connected Toys Industry Revenue (Million), by Country 2024 & 2032
- Figure 13: Middle East and Africa Connected Toys Industry Revenue Share (%), by Country 2024 & 2032
- Figure 14: North America Connected Toys Industry Revenue (Million), by Type 2024 & 2032
- Figure 15: North America Connected Toys Industry Revenue Share (%), by Type 2024 & 2032
- Figure 16: North America Connected Toys Industry Revenue (Million), by Country 2024 & 2032
- Figure 17: North America Connected Toys Industry Revenue Share (%), by Country 2024 & 2032
- Figure 18: Europe Connected Toys Industry Revenue (Million), by Type 2024 & 2032
- Figure 19: Europe Connected Toys Industry Revenue Share (%), by Type 2024 & 2032
- Figure 20: Europe Connected Toys Industry Revenue (Million), by Country 2024 & 2032
- Figure 21: Europe Connected Toys Industry Revenue Share (%), by Country 2024 & 2032
- Figure 22: Asia Connected Toys Industry Revenue (Million), by Type 2024 & 2032
- Figure 23: Asia Connected Toys Industry Revenue Share (%), by Type 2024 & 2032
- Figure 24: Asia Connected Toys Industry Revenue (Million), by Country 2024 & 2032
- Figure 25: Asia Connected Toys Industry Revenue Share (%), by Country 2024 & 2032
- Figure 26: Australia and New Zealand Connected Toys Industry Revenue (Million), by Type 2024 & 2032
- Figure 27: Australia and New Zealand Connected Toys Industry Revenue Share (%), by Type 2024 & 2032
- Figure 28: Australia and New Zealand Connected Toys Industry Revenue (Million), by Country 2024 & 2032
- Figure 29: Australia and New Zealand Connected Toys Industry Revenue Share (%), by Country 2024 & 2032
- Figure 30: Latin America Connected Toys Industry Revenue (Million), by Type 2024 & 2032
- Figure 31: Latin America Connected Toys Industry Revenue Share (%), by Type 2024 & 2032
- Figure 32: Latin America Connected Toys Industry Revenue (Million), by Country 2024 & 2032
- Figure 33: Latin America Connected Toys Industry Revenue Share (%), by Country 2024 & 2032
- Figure 34: Middle East and Africa Connected Toys Industry Revenue (Million), by Type 2024 & 2032
- Figure 35: Middle East and Africa Connected Toys Industry Revenue Share (%), by Type 2024 & 2032
- Figure 36: Middle East and Africa Connected Toys Industry Revenue (Million), by Country 2024 & 2032
- Figure 37: Middle East and Africa Connected Toys Industry Revenue Share (%), by Country 2024 & 2032
List of Tables
- Table 1: Global Connected Toys Industry Revenue Million Forecast, by Region 2019 & 2032
- Table 2: Global Connected Toys Industry Revenue Million Forecast, by Type 2019 & 2032
- Table 3: Global Connected Toys Industry Revenue Million Forecast, by Region 2019 & 2032
- Table 4: Global Connected Toys Industry Revenue Million Forecast, by Country 2019 & 2032
- Table 5: Connected Toys Industry Revenue (Million) Forecast, by Application 2019 & 2032
- Table 6: Global Connected Toys Industry Revenue Million Forecast, by Country 2019 & 2032
- Table 7: Connected Toys Industry Revenue (Million) Forecast, by Application 2019 & 2032
- Table 8: Global Connected Toys Industry Revenue Million Forecast, by Country 2019 & 2032
- Table 9: Connected Toys Industry Revenue (Million) Forecast, by Application 2019 & 2032
- Table 10: Global Connected Toys Industry Revenue Million Forecast, by Country 2019 & 2032
- Table 11: Connected Toys Industry Revenue (Million) Forecast, by Application 2019 & 2032
- Table 12: Global Connected Toys Industry Revenue Million Forecast, by Country 2019 & 2032
- Table 13: Connected Toys Industry Revenue (Million) Forecast, by Application 2019 & 2032
- Table 14: Global Connected Toys Industry Revenue Million Forecast, by Country 2019 & 2032
- Table 15: Connected Toys Industry Revenue (Million) Forecast, by Application 2019 & 2032
- Table 16: Global Connected Toys Industry Revenue Million Forecast, by Type 2019 & 2032
- Table 17: Global Connected Toys Industry Revenue Million Forecast, by Country 2019 & 2032
- Table 18: Global Connected Toys Industry Revenue Million Forecast, by Type 2019 & 2032
- Table 19: Global Connected Toys Industry Revenue Million Forecast, by Country 2019 & 2032
- Table 20: Global Connected Toys Industry Revenue Million Forecast, by Type 2019 & 2032
- Table 21: Global Connected Toys Industry Revenue Million Forecast, by Country 2019 & 2032
- Table 22: Global Connected Toys Industry Revenue Million Forecast, by Type 2019 & 2032
- Table 23: Global Connected Toys Industry Revenue Million Forecast, by Country 2019 & 2032
- Table 24: Global Connected Toys Industry Revenue Million Forecast, by Type 2019 & 2032
- Table 25: Global Connected Toys Industry Revenue Million Forecast, by Country 2019 & 2032
- Table 26: Global Connected Toys Industry Revenue Million Forecast, by Type 2019 & 2032
- Table 27: Global Connected Toys Industry Revenue Million Forecast, by Country 2019 & 2032
Frequently Asked Questions
1. What is the projected Compound Annual Growth Rate (CAGR) of the Connected Toys Industry?
The projected CAGR is approximately 21.63%.
2. Which companies are prominent players in the Connected Toys Industry?
Key companies in the market include Mattel Inc, Hasbro Inc, Anki inc *List Not Exhaustive, LEGO System A/S, Wonder Workshop Inc, Sphero, WowWee Group Limited, Leka SAS, Sony Corporation, Bandai Namco Entertainment Inc.
3. What are the main segments of the Connected Toys Industry?
The market segments include Type.
4. Can you provide details about the market size?
The market size is estimated to be USD 13.25 Million as of 2022.
5. What are some drivers contributing to market growth?
Easy Availability of Connected Platforms.
6. What are the notable trends driving market growth?
Smartphone Connected Toys are Expected to Witness Significant Growth.
7. Are there any restraints impacting market growth?
Fragmented Market with Several Local Vendors.
8. Can you provide examples of recent developments in the market?
March 2023: The Lego Group recently announced a significant increase in profit after three years, despite experiencing a surge in demand. To meet the growing demand, the company made substantial investments in production capabilities and expanded its reach by opening 155 new branded stores in the previous year. Additionally, the company ramped up production at three of its five factories to ensure an adequate supply of Lego products.
9. What pricing options are available for accessing the report?
Pricing options include single-user, multi-user, and enterprise licenses priced at USD 4750, USD 5250, and USD 8750 respectively.
10. Is the market size provided in terms of value or volume?
The market size is provided in terms of value, measured in Million.
11. Are there any specific market keywords associated with the report?
Yes, the market keyword associated with the report is "Connected Toys Industry," which aids in identifying and referencing the specific market segment covered.
12. How do I determine which pricing option suits my needs best?
The pricing options vary based on user requirements and access needs. Individual users may opt for single-user licenses, while businesses requiring broader access may choose multi-user or enterprise licenses for cost-effective access to the report.
13. Are there any additional resources or data provided in the Connected Toys Industry report?
While the report offers comprehensive insights, it's advisable to review the specific contents or supplementary materials provided to ascertain if additional resources or data are available.
14. How can I stay updated on further developments or reports in the Connected Toys Industry?
To stay informed about further developments, trends, and reports in the Connected Toys Industry, consider subscribing to industry newsletters, following relevant companies and organizations, or regularly checking reputable industry news sources and publications.
Methodology
Step 1 - Identification of Relevant Samples Size from Population Database


Step 2 - Approaches for Defining Global Market Size (Value, Volume* & Price*)

Note*: In applicable scenarios
Step 3 - Data Sources
Primary Research
- Web Analytics
- Survey Reports
- Research Institute
- Latest Research Reports
- Opinion Leaders
Secondary Research
- Annual Reports
- White Paper
- Latest Press Release
- Industry Association
- Paid Database
- Investor Presentations

Step 4 - Data Triangulation
Involves using different sources of information in order to increase the validity of a study
These sources are likely to be stakeholders in a program - participants, other researchers, program staff, other community members, and so on.
Then we put all data in single framework & apply various statistical tools to find out the dynamic on the market.
During the analysis stage, feedback from the stakeholder groups would be compared to determine areas of agreement as well as areas of divergence


