
Key Insights
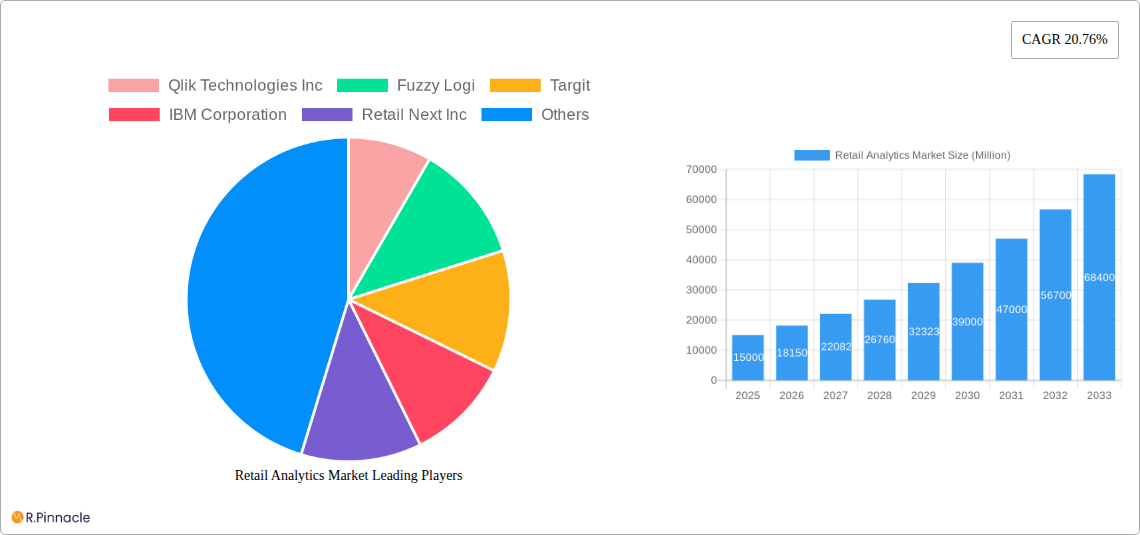
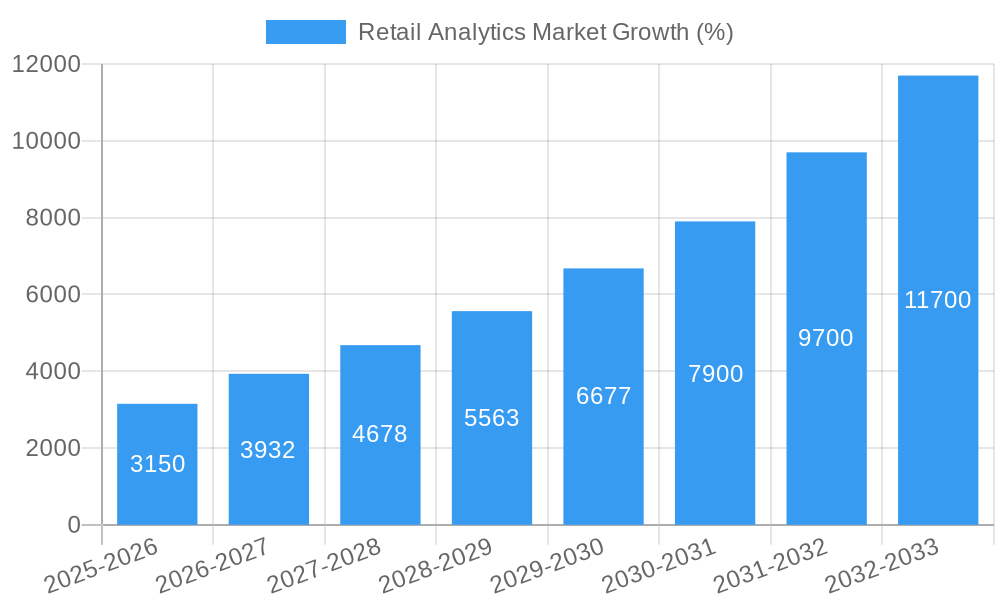
The global retail analytics market is experiencing robust growth, fueled by the increasing adoption of data-driven decision-making strategies within the retail sector. A CAGR of 20.76% from 2019-2024 suggests a rapidly expanding market, projected to continue its upward trajectory through 2033. This growth is driven by several key factors, including the proliferation of e-commerce, the need for enhanced customer experience personalization, and the rising demand for efficient supply chain management. Businesses are leveraging retail analytics to gain deeper insights into consumer behavior, optimize pricing strategies, improve inventory management, and personalize marketing campaigns. The market is segmented by deployment mode (on-premise and cloud), type (solutions and services), module type (covering various retail functions like strategy, marketing, finance, operations, merchandising, and supply chain), business type (SMEs and large organizations), and geography. Cloud-based solutions are gaining significant traction due to their scalability, cost-effectiveness, and accessibility. The increasing adoption of advanced analytics techniques, such as artificial intelligence and machine learning, is further propelling market expansion.
The competitive landscape is characterized by a mix of established players and emerging technology providers. Companies like Qlik, IBM, Adobe, Tableau, and others offer a range of solutions catering to diverse retail needs. While North America and Europe currently hold significant market share, the Asia-Pacific region is poised for substantial growth, driven by increasing digitalization and economic development in countries like China and India. The market faces some restraints, including data security concerns, the need for skilled analytics professionals, and the complexity of integrating various data sources. However, the overall positive market outlook indicates substantial future growth potential, especially with the continued advancements in data analytics technologies and the increasing reliance on data-driven decision-making within the retail industry. Future growth will be shaped by innovations in areas such as predictive analytics, real-time data processing, and the integration of omnichannel data.
Retail Analytics Market Report: A Comprehensive Analysis (2019-2033)
This in-depth report provides a comprehensive analysis of the Retail Analytics Market, offering invaluable insights for industry professionals, investors, and strategists. Covering the period from 2019 to 2033, with a focus on 2025, this report dissects market dynamics, identifies key players, and forecasts future growth trajectories. The report leverages extensive data analysis to provide actionable intelligence, enabling informed decision-making in this rapidly evolving sector.
Retail Analytics Market Structure & Innovation Trends
The Retail Analytics market is characterized by a moderately concentrated landscape, with several major players holding significant market share. However, the market also witnesses consistent entry of new players, driven by technological advancements and rising demand for data-driven retail strategies. Market concentration is further analyzed by assessing the market share held by key players like Qlik Technologies Inc, IBM Corporation, and SAP SE. These companies, along with others, hold an estimated xx% of the market share collectively in 2025. Innovation is primarily driven by the need for enhanced predictive capabilities, improved data visualization tools, and the integration of artificial intelligence (AI) and machine learning (ML). Regulatory frameworks, particularly concerning data privacy (e.g., GDPR), significantly influence market practices. Product substitutes, such as traditional market research methods, are increasingly being replaced by the efficiency and scalability of retail analytics solutions. M&A activities in the sector, valued at approximately $xx Million in 2024, are expected to continue, further shaping market consolidation and innovation. The end-user demographics are diverse, including small and medium enterprises (SMEs), large-scale organizations, and various retail sectors.
- Market Concentration: High, with top 5 players holding xx% market share (2025).
- Innovation Drivers: AI/ML integration, advanced visualization, predictive analytics.
- M&A Activity: $xx Million in deal value (2024), signifying consolidation.
- Regulatory Impact: GDPR and similar regulations influence data handling practices.
Retail Analytics Market Dynamics & Trends
The Retail Analytics Market exhibits a robust growth trajectory, driven by the escalating need for data-driven decision-making among retailers. The increasing adoption of omnichannel strategies necessitates sophisticated analytics for understanding consumer behavior across multiple touchpoints. Technological disruptions, particularly in cloud computing and big data technologies, are enabling the processing and analysis of vast datasets, uncovering valuable insights previously inaccessible. Consumer preference for personalized experiences further fuels the demand for retail analytics, as retailers strive to provide targeted offers and recommendations. The competitive dynamics are intense, with established players constantly innovating and new entrants leveraging niche technologies. The market is projected to achieve a CAGR of xx% during the forecast period (2025-2033), with market penetration expected to reach xx% by 2033. The rise of e-commerce and the increasing volume of online transactions contribute significantly to this growth.
Dominant Regions & Segments in Retail Analytics Market
The Retail Analytics market demonstrates strong growth across various regions and segments. While data suggests the United Kingdom and Germany hold a strong market share in Europe, North America continues to lead globally due to higher technology adoption and a mature retail sector.
- Leading Region: North America
- Leading Country (Europe): United Kingdom
- Dominant Segment (Deployment): Cloud-based solutions exhibit faster growth due to scalability and cost-effectiveness.
- Dominant Segment (Type): Solutions (analytics, visualization tools, and data management) holds the largest market share.
- Dominant Segment (Module Type): Marketing modules, driven by the need for targeted campaigns and customer segmentation.
- Dominant Segment (Business Type): Large-scale organizations demonstrate higher adoption due to resources and data volume.
Key drivers for regional dominance include robust technological infrastructure, favorable economic policies, and a thriving retail industry. The strong digital infrastructure in North America, for example, enables seamless data integration and analysis, driving the adoption of retail analytics solutions. Furthermore, the preference for personalized shopping experiences among consumers in these regions fuels the demand for sophisticated analytics capabilities.
Retail Analytics Market Product Innovations
Recent years have seen significant advancements in retail analytics, characterized by the integration of AI/ML algorithms for predictive modeling, improved data visualization techniques for more effective insights, and enhanced data security measures to comply with evolving regulations. These innovations enable retailers to optimize pricing strategies, personalize customer experiences, and streamline supply chain operations more effectively. The increasing focus on real-time analytics and the development of cloud-based solutions further enhance accessibility and scalability. This rapid pace of innovation positions the market for continued growth and adoption across various retail segments.
Report Scope & Segmentation Analysis
This report comprehensively analyzes the Retail Analytics Market across various segments:
- By Mode of Deployment: On-Premise and Cloud, with cloud-based solutions witnessing faster growth. The cloud segment is projected to reach $xx Million by 2033.
- By Type: Solutions (Analytics, Visualization Tools, Data Management) and Services (Integration, Support & Consulting). Solutions dominate the market, expected to reach $xx Million by 2033.
- By Module Type: Strategy & Planning, Marketing, Financial Management, Store Operations, Merchandising, Supply Chain Management, and Other Module Types. Marketing and Merchandising modules show strong growth potential.
- By Business Type: Small & Medium Enterprises (SMEs) and Large-scale organizations. Large organizations currently dominate, but SME adoption is increasing rapidly.
- By Country: United Kingdom, Germany, France, and Other Countries. The UK and Germany represent significant market share within Europe.
Key Drivers of Retail Analytics Market Growth
Several factors propel the Retail Analytics market's growth. Technological advancements, particularly in AI/ML and cloud computing, provide powerful tools for data analysis. The rising consumer demand for personalized experiences pushes retailers to adopt analytics for targeted marketing. Stringent regulatory compliance requirements around data privacy also drive the adoption of robust analytics solutions to ensure responsible data handling. Furthermore, the increasing competition in the retail landscape necessitates data-driven insights for optimized strategies.
Challenges in the Retail Analytics Market Sector
Despite its strong growth trajectory, the Retail Analytics market faces challenges. The high initial investment in software and infrastructure can deter some businesses, especially SMEs. Data security concerns and the need for compliance with evolving regulations represent significant hurdles. The complexity of integrating diverse data sources and the need for skilled professionals to analyze and interpret the data also pose barriers to entry and adoption. The intense competition among vendors also puts pressure on pricing and margins.
Emerging Opportunities in Retail Analytics Market
The Retail Analytics Market presents several emerging opportunities. The increasing adoption of IoT devices in retail settings generates vast amounts of data, creating opportunities for advanced analytics and predictive capabilities. The growing importance of personalization and omnichannel experiences necessitates more sophisticated analytics tools. Expansion into emerging markets with growing retail sectors represents significant potential. The development of more user-friendly and accessible analytical tools can further broaden market adoption.
Leading Players in the Retail Analytics Market Market
- Qlik Technologies Inc
- Fuzzy Logi
- Targit
- IBM Corporation
- Retail Next Inc
- Adobe Systems Incorporated
- Pentaho Corporation
- Microstrategy Inc
- Zoho Corporation
- Tableau Software Inc
- Alteryx Inc
- Oracle Corporation
- ZAP Business Intelligence
- SAP SE
- Prevedere Software Inc
Key Developments in Retail Analytics Market Industry
- January 2022: dunnhumby and SAP announced a strategic partnership to integrate customer insights into retail marketing and merchandising. This collaboration strengthens the capabilities of both companies and enhances offerings for retailers.
- June 2022: Lytho Inc. launched its Creative Window software, expanding its reach into the retail and other sectors. This highlights the growing demand for specialized software solutions within the retail analytics ecosystem.
Future Outlook for Retail Analytics Market Market
The Retail Analytics Market is poised for significant growth, driven by continued technological advancements, escalating demand for personalized experiences, and the increasing need for data-driven decision-making in the retail sector. The expansion into emerging markets and the integration of innovative technologies like AI and IoT present considerable opportunities. Strategic partnerships and mergers & acquisitions will continue to reshape the market landscape, driving further innovation and consolidation. The future outlook is positive, with substantial potential for market expansion and growth across all segments.
Retail Analytics Market Segmentation
-
1. Mode of Deployment
- 1.1. On-Premise
- 1.2. Cloud
-
2. Type
- 2.1. Solution
- 2.2. Services (Integration, Support & Consulting)
-
3. Module Type
- 3.1. Strategy
- 3.2. Marketing (Pricing, Loyalty and Segment Analysis)
- 3.3. Financial Management (Accounts Management)
- 3.4. Store Op
- 3.5. Merchand
- 3.6. Supply C
- 3.7. Other Module Types
-
4. Business Type
- 4.1. Small & Medium Enterprises
- 4.2. Large-scale organizations
Retail Analytics Market Segmentation By Geography
-
1. North America
- 1.1. United States
- 1.2. Canada
- 1.3. Mexico
-
2. South America
- 2.1. Brazil
- 2.2. Argentina
- 2.3. Rest of South America
-
3. Europe
- 3.1. United Kingdom
- 3.2. Germany
- 3.3. France
- 3.4. Italy
- 3.5. Spain
- 3.6. Russia
- 3.7. Benelux
- 3.8. Nordics
- 3.9. Rest of Europe
-
4. Middle East & Africa
- 4.1. Turkey
- 4.2. Israel
- 4.3. GCC
- 4.4. North Africa
- 4.5. South Africa
- 4.6. Rest of Middle East & Africa
-
5. Asia Pacific
- 5.1. China
- 5.2. India
- 5.3. Japan
- 5.4. South Korea
- 5.5. ASEAN
- 5.6. Oceania
- 5.7. Rest of Asia Pacific

Retail Analytics Market REPORT HIGHLIGHTS
| Aspects | Details |
|---|---|
| Study Period | 2019-2033 |
| Base Year | 2024 |
| Estimated Year | 2025 |
| Forecast Period | 2025-2033 |
| Historical Period | 2019-2024 |
| Growth Rate | CAGR of 20.76% from 2019-2033 |
| Segmentation |
|
Table of Contents
- 1. Introduction
- 1.1. Research Scope
- 1.2. Market Segmentation
- 1.3. Research Methodology
- 1.4. Definitions and Assumptions
- 2. Executive Summary
- 2.1. Introduction
- 3. Market Dynamics
- 3.1. Introduction
- 3.2. Market Drivers
- 3.2.1. Increased Emphasis on Predictive Analysis; Sustained Increase in Volume of Data; Growing Demand for Sales Forecasting
- 3.3. Market Restrains
- 3.3.1. Lack of General Awareness and Expertise in Emerging Regions; Standardization and Integration Issues
- 3.4. Market Trends
- 3.4.1. Cloud Segment is One of the Factors Driving the Market
- 4. Market Factor Analysis
- 4.1. Porters Five Forces
- 4.2. Supply/Value Chain
- 4.3. PESTEL analysis
- 4.4. Market Entropy
- 4.5. Patent/Trademark Analysis
- 5. Global Retail Analytics Market Analysis, Insights and Forecast, 2019-2031
- 5.1. Market Analysis, Insights and Forecast - by Mode of Deployment
- 5.1.1. On-Premise
- 5.1.2. Cloud
- 5.2. Market Analysis, Insights and Forecast - by Type
- 5.2.1. Solution
- 5.2.2. Services (Integration, Support & Consulting)
- 5.3. Market Analysis, Insights and Forecast - by Module Type
- 5.3.1. Strategy
- 5.3.2. Marketing (Pricing, Loyalty and Segment Analysis)
- 5.3.3. Financial Management (Accounts Management)
- 5.3.4. Store Op
- 5.3.5. Merchand
- 5.3.6. Supply C
- 5.3.7. Other Module Types
- 5.4. Market Analysis, Insights and Forecast - by Business Type
- 5.4.1. Small & Medium Enterprises
- 5.4.2. Large-scale organizations
- 5.5. Market Analysis, Insights and Forecast - by Region
- 5.5.1. North America
- 5.5.2. South America
- 5.5.3. Europe
- 5.5.4. Middle East & Africa
- 5.5.5. Asia Pacific
- 5.1. Market Analysis, Insights and Forecast - by Mode of Deployment
- 6. North America Retail Analytics Market Analysis, Insights and Forecast, 2019-2031
- 6.1. Market Analysis, Insights and Forecast - by Mode of Deployment
- 6.1.1. On-Premise
- 6.1.2. Cloud
- 6.2. Market Analysis, Insights and Forecast - by Type
- 6.2.1. Solution
- 6.2.2. Services (Integration, Support & Consulting)
- 6.3. Market Analysis, Insights and Forecast - by Module Type
- 6.3.1. Strategy
- 6.3.2. Marketing (Pricing, Loyalty and Segment Analysis)
- 6.3.3. Financial Management (Accounts Management)
- 6.3.4. Store Op
- 6.3.5. Merchand
- 6.3.6. Supply C
- 6.3.7. Other Module Types
- 6.4. Market Analysis, Insights and Forecast - by Business Type
- 6.4.1. Small & Medium Enterprises
- 6.4.2. Large-scale organizations
- 6.1. Market Analysis, Insights and Forecast - by Mode of Deployment
- 7. South America Retail Analytics Market Analysis, Insights and Forecast, 2019-2031
- 7.1. Market Analysis, Insights and Forecast - by Mode of Deployment
- 7.1.1. On-Premise
- 7.1.2. Cloud
- 7.2. Market Analysis, Insights and Forecast - by Type
- 7.2.1. Solution
- 7.2.2. Services (Integration, Support & Consulting)
- 7.3. Market Analysis, Insights and Forecast - by Module Type
- 7.3.1. Strategy
- 7.3.2. Marketing (Pricing, Loyalty and Segment Analysis)
- 7.3.3. Financial Management (Accounts Management)
- 7.3.4. Store Op
- 7.3.5. Merchand
- 7.3.6. Supply C
- 7.3.7. Other Module Types
- 7.4. Market Analysis, Insights and Forecast - by Business Type
- 7.4.1. Small & Medium Enterprises
- 7.4.2. Large-scale organizations
- 7.1. Market Analysis, Insights and Forecast - by Mode of Deployment
- 8. Europe Retail Analytics Market Analysis, Insights and Forecast, 2019-2031
- 8.1. Market Analysis, Insights and Forecast - by Mode of Deployment
- 8.1.1. On-Premise
- 8.1.2. Cloud
- 8.2. Market Analysis, Insights and Forecast - by Type
- 8.2.1. Solution
- 8.2.2. Services (Integration, Support & Consulting)
- 8.3. Market Analysis, Insights and Forecast - by Module Type
- 8.3.1. Strategy
- 8.3.2. Marketing (Pricing, Loyalty and Segment Analysis)
- 8.3.3. Financial Management (Accounts Management)
- 8.3.4. Store Op
- 8.3.5. Merchand
- 8.3.6. Supply C
- 8.3.7. Other Module Types
- 8.4. Market Analysis, Insights and Forecast - by Business Type
- 8.4.1. Small & Medium Enterprises
- 8.4.2. Large-scale organizations
- 8.1. Market Analysis, Insights and Forecast - by Mode of Deployment
- 9. Middle East & Africa Retail Analytics Market Analysis, Insights and Forecast, 2019-2031
- 9.1. Market Analysis, Insights and Forecast - by Mode of Deployment
- 9.1.1. On-Premise
- 9.1.2. Cloud
- 9.2. Market Analysis, Insights and Forecast - by Type
- 9.2.1. Solution
- 9.2.2. Services (Integration, Support & Consulting)
- 9.3. Market Analysis, Insights and Forecast - by Module Type
- 9.3.1. Strategy
- 9.3.2. Marketing (Pricing, Loyalty and Segment Analysis)
- 9.3.3. Financial Management (Accounts Management)
- 9.3.4. Store Op
- 9.3.5. Merchand
- 9.3.6. Supply C
- 9.3.7. Other Module Types
- 9.4. Market Analysis, Insights and Forecast - by Business Type
- 9.4.1. Small & Medium Enterprises
- 9.4.2. Large-scale organizations
- 9.1. Market Analysis, Insights and Forecast - by Mode of Deployment
- 10. Asia Pacific Retail Analytics Market Analysis, Insights and Forecast, 2019-2031
- 10.1. Market Analysis, Insights and Forecast - by Mode of Deployment
- 10.1.1. On-Premise
- 10.1.2. Cloud
- 10.2. Market Analysis, Insights and Forecast - by Type
- 10.2.1. Solution
- 10.2.2. Services (Integration, Support & Consulting)
- 10.3. Market Analysis, Insights and Forecast - by Module Type
- 10.3.1. Strategy
- 10.3.2. Marketing (Pricing, Loyalty and Segment Analysis)
- 10.3.3. Financial Management (Accounts Management)
- 10.3.4. Store Op
- 10.3.5. Merchand
- 10.3.6. Supply C
- 10.3.7. Other Module Types
- 10.4. Market Analysis, Insights and Forecast - by Business Type
- 10.4.1. Small & Medium Enterprises
- 10.4.2. Large-scale organizations
- 10.1. Market Analysis, Insights and Forecast - by Mode of Deployment
- 11. China Retail Analytics Market Analysis, Insights and Forecast, 2019-2031
- 11.1. Market Analysis, Insights and Forecast - By Country/Sub-region
- 11.1.1.
- 12. India Retail Analytics Market Analysis, Insights and Forecast, 2019-2031
- 12.1. Market Analysis, Insights and Forecast - By Country/Sub-region
- 12.1.1.
- 13. Japan Retail Analytics Market Analysis, Insights and Forecast, 2019-2031
- 13.1. Market Analysis, Insights and Forecast - By Country/Sub-region
- 13.1.1.
- 14. South Korea Retail Analytics Market Analysis, Insights and Forecast, 2019-2031
- 14.1. Market Analysis, Insights and Forecast - By Country/Sub-region
- 14.1.1.
- 15. Rest of Asia Pacific Retail Analytics Market Analysis, Insights and Forecast, 2019-2031
- 15.1. Market Analysis, Insights and Forecast - By Country/Sub-region
- 15.1.1.
- 16. Competitive Analysis
- 16.1. Global Market Share Analysis 2024
- 16.2. Company Profiles
- 16.2.1 Qlik Technologies Inc
- 16.2.1.1. Overview
- 16.2.1.2. Products
- 16.2.1.3. SWOT Analysis
- 16.2.1.4. Recent Developments
- 16.2.1.5. Financials (Based on Availability)
- 16.2.2 Fuzzy Logi
- 16.2.2.1. Overview
- 16.2.2.2. Products
- 16.2.2.3. SWOT Analysis
- 16.2.2.4. Recent Developments
- 16.2.2.5. Financials (Based on Availability)
- 16.2.3 Targit
- 16.2.3.1. Overview
- 16.2.3.2. Products
- 16.2.3.3. SWOT Analysis
- 16.2.3.4. Recent Developments
- 16.2.3.5. Financials (Based on Availability)
- 16.2.4 IBM Corporation
- 16.2.4.1. Overview
- 16.2.4.2. Products
- 16.2.4.3. SWOT Analysis
- 16.2.4.4. Recent Developments
- 16.2.4.5. Financials (Based on Availability)
- 16.2.5 Retail Next Inc
- 16.2.5.1. Overview
- 16.2.5.2. Products
- 16.2.5.3. SWOT Analysis
- 16.2.5.4. Recent Developments
- 16.2.5.5. Financials (Based on Availability)
- 16.2.6 Adobe Systems Incorporated
- 16.2.6.1. Overview
- 16.2.6.2. Products
- 16.2.6.3. SWOT Analysis
- 16.2.6.4. Recent Developments
- 16.2.6.5. Financials (Based on Availability)
- 16.2.7 Pentaho Corporation
- 16.2.7.1. Overview
- 16.2.7.2. Products
- 16.2.7.3. SWOT Analysis
- 16.2.7.4. Recent Developments
- 16.2.7.5. Financials (Based on Availability)
- 16.2.8 Microstrategy Inc
- 16.2.8.1. Overview
- 16.2.8.2. Products
- 16.2.8.3. SWOT Analysis
- 16.2.8.4. Recent Developments
- 16.2.8.5. Financials (Based on Availability)
- 16.2.9 Zoho Corporation
- 16.2.9.1. Overview
- 16.2.9.2. Products
- 16.2.9.3. SWOT Analysis
- 16.2.9.4. Recent Developments
- 16.2.9.5. Financials (Based on Availability)
- 16.2.10 Tableau Software Inc
- 16.2.10.1. Overview
- 16.2.10.2. Products
- 16.2.10.3. SWOT Analysis
- 16.2.10.4. Recent Developments
- 16.2.10.5. Financials (Based on Availability)
- 16.2.11 Alteryx Inc
- 16.2.11.1. Overview
- 16.2.11.2. Products
- 16.2.11.3. SWOT Analysis
- 16.2.11.4. Recent Developments
- 16.2.11.5. Financials (Based on Availability)
- 16.2.12 Oracle Corporation
- 16.2.12.1. Overview
- 16.2.12.2. Products
- 16.2.12.3. SWOT Analysis
- 16.2.12.4. Recent Developments
- 16.2.12.5. Financials (Based on Availability)
- 16.2.13 ZAP Business Intelligence
- 16.2.13.1. Overview
- 16.2.13.2. Products
- 16.2.13.3. SWOT Analysis
- 16.2.13.4. Recent Developments
- 16.2.13.5. Financials (Based on Availability)
- 16.2.14 SAP SE
- 16.2.14.1. Overview
- 16.2.14.2. Products
- 16.2.14.3. SWOT Analysis
- 16.2.14.4. Recent Developments
- 16.2.14.5. Financials (Based on Availability)
- 16.2.15 Prevedere Software Inc
- 16.2.15.1. Overview
- 16.2.15.2. Products
- 16.2.15.3. SWOT Analysis
- 16.2.15.4. Recent Developments
- 16.2.15.5. Financials (Based on Availability)
- 16.2.1 Qlik Technologies Inc
List of Figures
- Figure 1: Global Retail Analytics Market Revenue Breakdown (Million, %) by Region 2024 & 2032
- Figure 2: China Retail Analytics Market Revenue (Million), by Country 2024 & 2032
- Figure 3: China Retail Analytics Market Revenue Share (%), by Country 2024 & 2032
- Figure 4: India Retail Analytics Market Revenue (Million), by Country 2024 & 2032
- Figure 5: India Retail Analytics Market Revenue Share (%), by Country 2024 & 2032
- Figure 6: Japan Retail Analytics Market Revenue (Million), by Country 2024 & 2032
- Figure 7: Japan Retail Analytics Market Revenue Share (%), by Country 2024 & 2032
- Figure 8: South Korea Retail Analytics Market Revenue (Million), by Country 2024 & 2032
- Figure 9: South Korea Retail Analytics Market Revenue Share (%), by Country 2024 & 2032
- Figure 10: Rest of Asia Pacific Retail Analytics Market Revenue (Million), by Country 2024 & 2032
- Figure 11: Rest of Asia Pacific Retail Analytics Market Revenue Share (%), by Country 2024 & 2032
- Figure 12: North America Retail Analytics Market Revenue (Million), by Mode of Deployment 2024 & 2032
- Figure 13: North America Retail Analytics Market Revenue Share (%), by Mode of Deployment 2024 & 2032
- Figure 14: North America Retail Analytics Market Revenue (Million), by Type 2024 & 2032
- Figure 15: North America Retail Analytics Market Revenue Share (%), by Type 2024 & 2032
- Figure 16: North America Retail Analytics Market Revenue (Million), by Module Type 2024 & 2032
- Figure 17: North America Retail Analytics Market Revenue Share (%), by Module Type 2024 & 2032
- Figure 18: North America Retail Analytics Market Revenue (Million), by Business Type 2024 & 2032
- Figure 19: North America Retail Analytics Market Revenue Share (%), by Business Type 2024 & 2032
- Figure 20: North America Retail Analytics Market Revenue (Million), by Country 2024 & 2032
- Figure 21: North America Retail Analytics Market Revenue Share (%), by Country 2024 & 2032
- Figure 22: South America Retail Analytics Market Revenue (Million), by Mode of Deployment 2024 & 2032
- Figure 23: South America Retail Analytics Market Revenue Share (%), by Mode of Deployment 2024 & 2032
- Figure 24: South America Retail Analytics Market Revenue (Million), by Type 2024 & 2032
- Figure 25: South America Retail Analytics Market Revenue Share (%), by Type 2024 & 2032
- Figure 26: South America Retail Analytics Market Revenue (Million), by Module Type 2024 & 2032
- Figure 27: South America Retail Analytics Market Revenue Share (%), by Module Type 2024 & 2032
- Figure 28: South America Retail Analytics Market Revenue (Million), by Business Type 2024 & 2032
- Figure 29: South America Retail Analytics Market Revenue Share (%), by Business Type 2024 & 2032
- Figure 30: South America Retail Analytics Market Revenue (Million), by Country 2024 & 2032
- Figure 31: South America Retail Analytics Market Revenue Share (%), by Country 2024 & 2032
- Figure 32: Europe Retail Analytics Market Revenue (Million), by Mode of Deployment 2024 & 2032
- Figure 33: Europe Retail Analytics Market Revenue Share (%), by Mode of Deployment 2024 & 2032
- Figure 34: Europe Retail Analytics Market Revenue (Million), by Type 2024 & 2032
- Figure 35: Europe Retail Analytics Market Revenue Share (%), by Type 2024 & 2032
- Figure 36: Europe Retail Analytics Market Revenue (Million), by Module Type 2024 & 2032
- Figure 37: Europe Retail Analytics Market Revenue Share (%), by Module Type 2024 & 2032
- Figure 38: Europe Retail Analytics Market Revenue (Million), by Business Type 2024 & 2032
- Figure 39: Europe Retail Analytics Market Revenue Share (%), by Business Type 2024 & 2032
- Figure 40: Europe Retail Analytics Market Revenue (Million), by Country 2024 & 2032
- Figure 41: Europe Retail Analytics Market Revenue Share (%), by Country 2024 & 2032
- Figure 42: Middle East & Africa Retail Analytics Market Revenue (Million), by Mode of Deployment 2024 & 2032
- Figure 43: Middle East & Africa Retail Analytics Market Revenue Share (%), by Mode of Deployment 2024 & 2032
- Figure 44: Middle East & Africa Retail Analytics Market Revenue (Million), by Type 2024 & 2032
- Figure 45: Middle East & Africa Retail Analytics Market Revenue Share (%), by Type 2024 & 2032
- Figure 46: Middle East & Africa Retail Analytics Market Revenue (Million), by Module Type 2024 & 2032
- Figure 47: Middle East & Africa Retail Analytics Market Revenue Share (%), by Module Type 2024 & 2032
- Figure 48: Middle East & Africa Retail Analytics Market Revenue (Million), by Business Type 2024 & 2032
- Figure 49: Middle East & Africa Retail Analytics Market Revenue Share (%), by Business Type 2024 & 2032
- Figure 50: Middle East & Africa Retail Analytics Market Revenue (Million), by Country 2024 & 2032
- Figure 51: Middle East & Africa Retail Analytics Market Revenue Share (%), by Country 2024 & 2032
- Figure 52: Asia Pacific Retail Analytics Market Revenue (Million), by Mode of Deployment 2024 & 2032
- Figure 53: Asia Pacific Retail Analytics Market Revenue Share (%), by Mode of Deployment 2024 & 2032
- Figure 54: Asia Pacific Retail Analytics Market Revenue (Million), by Type 2024 & 2032
- Figure 55: Asia Pacific Retail Analytics Market Revenue Share (%), by Type 2024 & 2032
- Figure 56: Asia Pacific Retail Analytics Market Revenue (Million), by Module Type 2024 & 2032
- Figure 57: Asia Pacific Retail Analytics Market Revenue Share (%), by Module Type 2024 & 2032
- Figure 58: Asia Pacific Retail Analytics Market Revenue (Million), by Business Type 2024 & 2032
- Figure 59: Asia Pacific Retail Analytics Market Revenue Share (%), by Business Type 2024 & 2032
- Figure 60: Asia Pacific Retail Analytics Market Revenue (Million), by Country 2024 & 2032
- Figure 61: Asia Pacific Retail Analytics Market Revenue Share (%), by Country 2024 & 2032
List of Tables
- Table 1: Global Retail Analytics Market Revenue Million Forecast, by Region 2019 & 2032
- Table 2: Global Retail Analytics Market Revenue Million Forecast, by Mode of Deployment 2019 & 2032
- Table 3: Global Retail Analytics Market Revenue Million Forecast, by Type 2019 & 2032
- Table 4: Global Retail Analytics Market Revenue Million Forecast, by Module Type 2019 & 2032
- Table 5: Global Retail Analytics Market Revenue Million Forecast, by Business Type 2019 & 2032
- Table 6: Global Retail Analytics Market Revenue Million Forecast, by Region 2019 & 2032
- Table 7: Global Retail Analytics Market Revenue Million Forecast, by Country 2019 & 2032
- Table 8: Retail Analytics Market Revenue (Million) Forecast, by Application 2019 & 2032
- Table 9: Global Retail Analytics Market Revenue Million Forecast, by Country 2019 & 2032
- Table 10: Retail Analytics Market Revenue (Million) Forecast, by Application 2019 & 2032
- Table 11: Global Retail Analytics Market Revenue Million Forecast, by Country 2019 & 2032
- Table 12: Retail Analytics Market Revenue (Million) Forecast, by Application 2019 & 2032
- Table 13: Global Retail Analytics Market Revenue Million Forecast, by Country 2019 & 2032
- Table 14: Retail Analytics Market Revenue (Million) Forecast, by Application 2019 & 2032
- Table 15: Global Retail Analytics Market Revenue Million Forecast, by Country 2019 & 2032
- Table 16: Retail Analytics Market Revenue (Million) Forecast, by Application 2019 & 2032
- Table 17: Global Retail Analytics Market Revenue Million Forecast, by Mode of Deployment 2019 & 2032
- Table 18: Global Retail Analytics Market Revenue Million Forecast, by Type 2019 & 2032
- Table 19: Global Retail Analytics Market Revenue Million Forecast, by Module Type 2019 & 2032
- Table 20: Global Retail Analytics Market Revenue Million Forecast, by Business Type 2019 & 2032
- Table 21: Global Retail Analytics Market Revenue Million Forecast, by Country 2019 & 2032
- Table 22: United States Retail Analytics Market Revenue (Million) Forecast, by Application 2019 & 2032
- Table 23: Canada Retail Analytics Market Revenue (Million) Forecast, by Application 2019 & 2032
- Table 24: Mexico Retail Analytics Market Revenue (Million) Forecast, by Application 2019 & 2032
- Table 25: Global Retail Analytics Market Revenue Million Forecast, by Mode of Deployment 2019 & 2032
- Table 26: Global Retail Analytics Market Revenue Million Forecast, by Type 2019 & 2032
- Table 27: Global Retail Analytics Market Revenue Million Forecast, by Module Type 2019 & 2032
- Table 28: Global Retail Analytics Market Revenue Million Forecast, by Business Type 2019 & 2032
- Table 29: Global Retail Analytics Market Revenue Million Forecast, by Country 2019 & 2032
- Table 30: Brazil Retail Analytics Market Revenue (Million) Forecast, by Application 2019 & 2032
- Table 31: Argentina Retail Analytics Market Revenue (Million) Forecast, by Application 2019 & 2032
- Table 32: Rest of South America Retail Analytics Market Revenue (Million) Forecast, by Application 2019 & 2032
- Table 33: Global Retail Analytics Market Revenue Million Forecast, by Mode of Deployment 2019 & 2032
- Table 34: Global Retail Analytics Market Revenue Million Forecast, by Type 2019 & 2032
- Table 35: Global Retail Analytics Market Revenue Million Forecast, by Module Type 2019 & 2032
- Table 36: Global Retail Analytics Market Revenue Million Forecast, by Business Type 2019 & 2032
- Table 37: Global Retail Analytics Market Revenue Million Forecast, by Country 2019 & 2032
- Table 38: United Kingdom Retail Analytics Market Revenue (Million) Forecast, by Application 2019 & 2032
- Table 39: Germany Retail Analytics Market Revenue (Million) Forecast, by Application 2019 & 2032
- Table 40: France Retail Analytics Market Revenue (Million) Forecast, by Application 2019 & 2032
- Table 41: Italy Retail Analytics Market Revenue (Million) Forecast, by Application 2019 & 2032
- Table 42: Spain Retail Analytics Market Revenue (Million) Forecast, by Application 2019 & 2032
- Table 43: Russia Retail Analytics Market Revenue (Million) Forecast, by Application 2019 & 2032
- Table 44: Benelux Retail Analytics Market Revenue (Million) Forecast, by Application 2019 & 2032
- Table 45: Nordics Retail Analytics Market Revenue (Million) Forecast, by Application 2019 & 2032
- Table 46: Rest of Europe Retail Analytics Market Revenue (Million) Forecast, by Application 2019 & 2032
- Table 47: Global Retail Analytics Market Revenue Million Forecast, by Mode of Deployment 2019 & 2032
- Table 48: Global Retail Analytics Market Revenue Million Forecast, by Type 2019 & 2032
- Table 49: Global Retail Analytics Market Revenue Million Forecast, by Module Type 2019 & 2032
- Table 50: Global Retail Analytics Market Revenue Million Forecast, by Business Type 2019 & 2032
- Table 51: Global Retail Analytics Market Revenue Million Forecast, by Country 2019 & 2032
- Table 52: Turkey Retail Analytics Market Revenue (Million) Forecast, by Application 2019 & 2032
- Table 53: Israel Retail Analytics Market Revenue (Million) Forecast, by Application 2019 & 2032
- Table 54: GCC Retail Analytics Market Revenue (Million) Forecast, by Application 2019 & 2032
- Table 55: North Africa Retail Analytics Market Revenue (Million) Forecast, by Application 2019 & 2032
- Table 56: South Africa Retail Analytics Market Revenue (Million) Forecast, by Application 2019 & 2032
- Table 57: Rest of Middle East & Africa Retail Analytics Market Revenue (Million) Forecast, by Application 2019 & 2032
- Table 58: Global Retail Analytics Market Revenue Million Forecast, by Mode of Deployment 2019 & 2032
- Table 59: Global Retail Analytics Market Revenue Million Forecast, by Type 2019 & 2032
- Table 60: Global Retail Analytics Market Revenue Million Forecast, by Module Type 2019 & 2032
- Table 61: Global Retail Analytics Market Revenue Million Forecast, by Business Type 2019 & 2032
- Table 62: Global Retail Analytics Market Revenue Million Forecast, by Country 2019 & 2032
- Table 63: China Retail Analytics Market Revenue (Million) Forecast, by Application 2019 & 2032
- Table 64: India Retail Analytics Market Revenue (Million) Forecast, by Application 2019 & 2032
- Table 65: Japan Retail Analytics Market Revenue (Million) Forecast, by Application 2019 & 2032
- Table 66: South Korea Retail Analytics Market Revenue (Million) Forecast, by Application 2019 & 2032
- Table 67: ASEAN Retail Analytics Market Revenue (Million) Forecast, by Application 2019 & 2032
- Table 68: Oceania Retail Analytics Market Revenue (Million) Forecast, by Application 2019 & 2032
- Table 69: Rest of Asia Pacific Retail Analytics Market Revenue (Million) Forecast, by Application 2019 & 2032
Frequently Asked Questions
1. What is the projected Compound Annual Growth Rate (CAGR) of the Retail Analytics Market?
The projected CAGR is approximately 20.76%.
2. Which companies are prominent players in the Retail Analytics Market?
Key companies in the market include Qlik Technologies Inc, Fuzzy Logi, Targit, IBM Corporation, Retail Next Inc, Adobe Systems Incorporated, Pentaho Corporation, Microstrategy Inc, Zoho Corporation, Tableau Software Inc, Alteryx Inc, Oracle Corporation, ZAP Business Intelligence, SAP SE, Prevedere Software Inc.
3. What are the main segments of the Retail Analytics Market?
The market segments include Mode of Deployment, Type, Module Type, Business Type.
4. Can you provide details about the market size?
The market size is estimated to be USD XX Million as of 2022.
5. What are some drivers contributing to market growth?
Increased Emphasis on Predictive Analysis; Sustained Increase in Volume of Data; Growing Demand for Sales Forecasting.
6. What are the notable trends driving market growth?
Cloud Segment is One of the Factors Driving the Market.
7. Are there any restraints impacting market growth?
Lack of General Awareness and Expertise in Emerging Regions; Standardization and Integration Issues.
8. Can you provide examples of recent developments in the market?
January 2022: dunnhumby, the global player in Customer Data Science, announced a new strategic relationship with SAP, the industry leader in business application software, that will assist retailers in integrating sophisticated customer insights into their marketing and merchandising programs. The collaboration will enable businesses to make faster, customer-driven decisions and provide a more personalized shopping experience in-store and at home.
9. What pricing options are available for accessing the report?
Pricing options include single-user, multi-user, and enterprise licenses priced at USD 3800, USD 4500, and USD 5800 respectively.
10. Is the market size provided in terms of value or volume?
The market size is provided in terms of value, measured in Million.
11. Are there any specific market keywords associated with the report?
Yes, the market keyword associated with the report is "Retail Analytics Market," which aids in identifying and referencing the specific market segment covered.
12. How do I determine which pricing option suits my needs best?
The pricing options vary based on user requirements and access needs. Individual users may opt for single-user licenses, while businesses requiring broader access may choose multi-user or enterprise licenses for cost-effective access to the report.
13. Are there any additional resources or data provided in the Retail Analytics Market report?
While the report offers comprehensive insights, it's advisable to review the specific contents or supplementary materials provided to ascertain if additional resources or data are available.
14. How can I stay updated on further developments or reports in the Retail Analytics Market?
To stay informed about further developments, trends, and reports in the Retail Analytics Market, consider subscribing to industry newsletters, following relevant companies and organizations, or regularly checking reputable industry news sources and publications.
Methodology
Step 1 - Identification of Relevant Samples Size from Population Database


Step 2 - Approaches for Defining Global Market Size (Value, Volume* & Price*)

Note*: In applicable scenarios
Step 3 - Data Sources
Primary Research
- Web Analytics
- Survey Reports
- Research Institute
- Latest Research Reports
- Opinion Leaders
Secondary Research
- Annual Reports
- White Paper
- Latest Press Release
- Industry Association
- Paid Database
- Investor Presentations

Step 4 - Data Triangulation
Involves using different sources of information in order to increase the validity of a study
These sources are likely to be stakeholders in a program - participants, other researchers, program staff, other community members, and so on.
Then we put all data in single framework & apply various statistical tools to find out the dynamic on the market.
During the analysis stage, feedback from the stakeholder groups would be compared to determine areas of agreement as well as areas of divergence


