
Key Insights
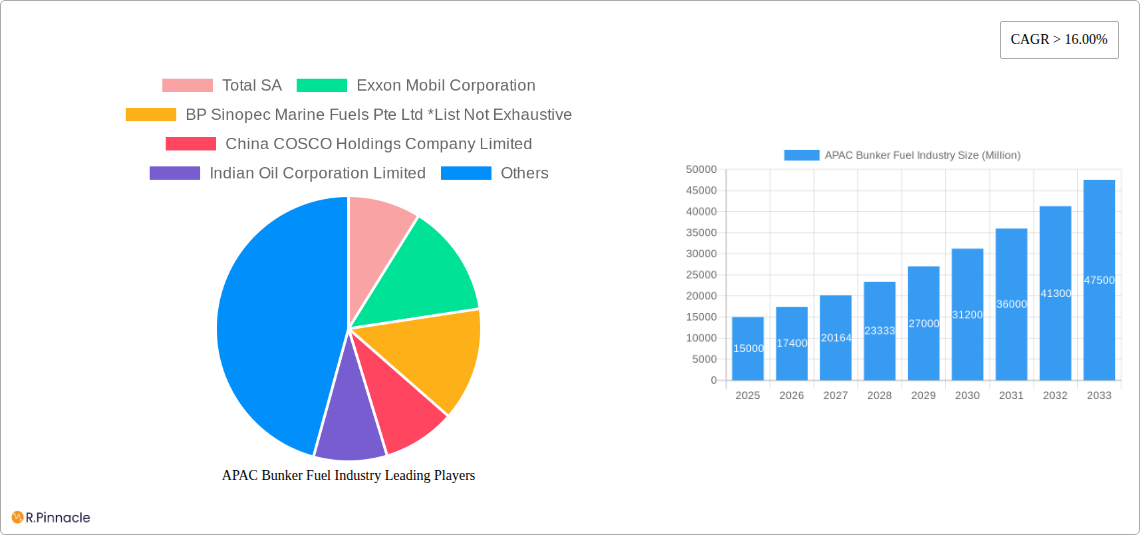
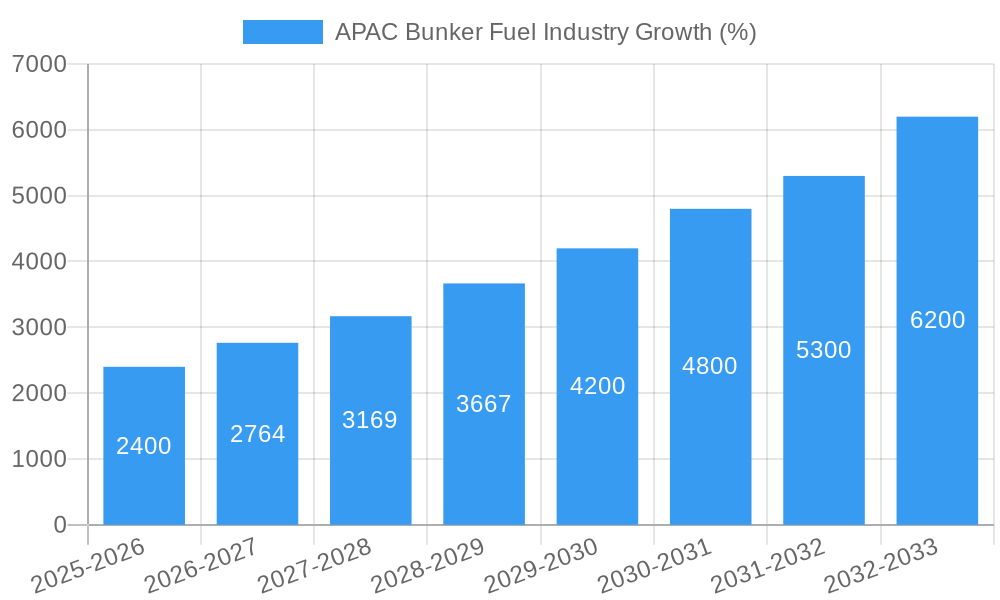
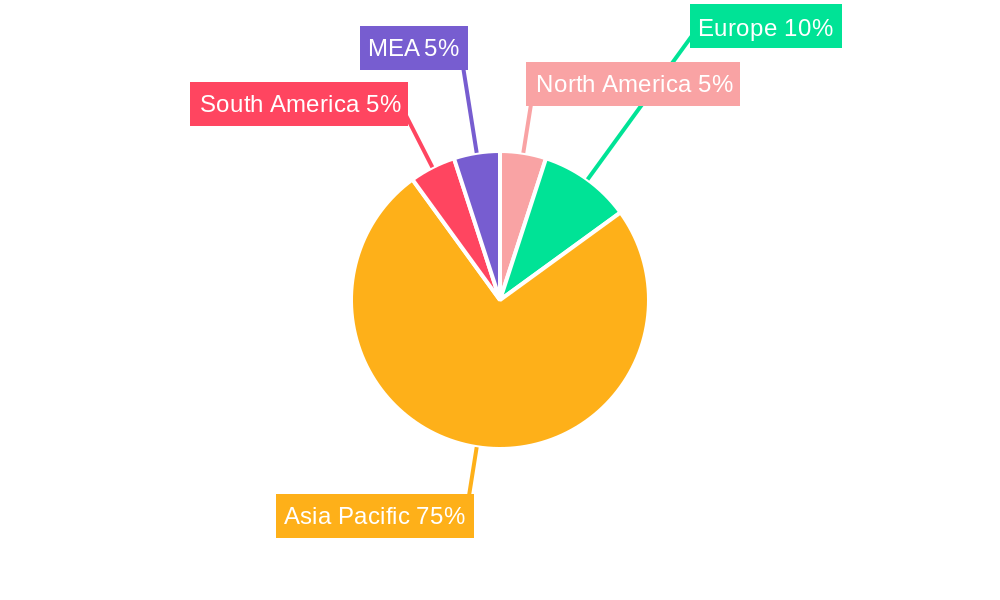
The Asia-Pacific (APAC) bunker fuel market is experiencing robust growth, driven by the region's expanding maritime trade and increasing demand for energy. The market's Compound Annual Growth Rate (CAGR) exceeding 16% indicates significant potential for sustained expansion through 2033. Key drivers include the rising number of container ships and tankers traversing APAC waters, fueled by robust intra-regional trade and burgeoning economies like China and India. The shift towards cleaner fuels, such as Very-Low Sulfur Fuel Oil (VLSFO) and Liquefied Natural Gas (LNG), is a prominent trend, driven by stringent environmental regulations aimed at reducing sulfur emissions and greenhouse gas impacts. While the transition to cleaner fuels presents opportunities, it also poses challenges, as the infrastructure for LNG bunkering is still under development in many APAC ports, leading to higher initial investment costs for shipping companies. Furthermore, price volatility in crude oil and fluctuating demand can act as restraints on market growth. Segmentation within the APAC market shows strong demand across various vessel types, with containers and tankers dominating the consumption landscape. Major players, including Total SA, Exxon Mobil, BP, and several significant Asian players, are actively vying for market share, leading to competitive pricing and service enhancements. The growth trajectory is likely to be influenced by global economic conditions, government policies regarding emission standards, and the continuous expansion of port infrastructure capable of handling diverse bunker fuel types.
The regional breakdown within APAC reveals that China, Japan, India, and South Korea are major contributors to the market, reflecting their significant roles in global trade and shipping. Southeast Asia is also a rapidly growing market, driven by increased economic activity and shipping volumes in the region. The market's future will depend on factors such as the pace of adoption of alternative fuels, the development of LNG bunkering infrastructure, and the overall stability of global shipping trade. Growth in specific fuel types like VLSFO will likely outpace others due to environmental regulations, while MGO will likely retain a significant share owing to its suitability for smaller vessels and specific operational needs. Companies are likely to continue investing in infrastructure and logistics to improve efficiency and respond to evolving demands in the market. Therefore, the APAC bunker fuel market is poised for considerable expansion, albeit with challenges related to fuel transitions, regulatory frameworks, and global economic stability.
APAC Bunker Fuel Industry: A Comprehensive Market Report (2019-2033)
This comprehensive report provides an in-depth analysis of the Asia-Pacific (APAC) bunker fuel industry, offering invaluable insights for industry professionals, investors, and strategic decision-makers. The study covers the period from 2019 to 2033, with a focus on the forecast period of 2025-2033 and a base year of 2025. The report leverages extensive data analysis to provide a clear understanding of market trends, competitive dynamics, and future growth opportunities within the APAC region. Key players such as Total SA, Exxon Mobil Corporation, BP Sinopec Marine Fuels Pte Ltd, China COSCO Holdings Company Limited, Indian Oil Corporation Limited, Royal Dutch Shell PLC, Ocean Network Express PTE Ltd, and Chimbusco Pan Nation Petro-Chemical Co Ltd are analyzed, though the list is not exhaustive. The report segments the market by fuel type (HSFO, VLSFO, MGO, LNG, Others) and vessel type (Containers, Tankers, General Cargo, Bulk Carriers, Others), providing granular insights into market size and growth projections. Expected market value is projected to reach xx Million by 2033.
APAC Bunker Fuel Industry Market Structure & Innovation Trends
This section analyzes the competitive landscape of the APAC bunker fuel market, examining market concentration, innovation drivers, regulatory frameworks, and mergers and acquisitions (M&A) activities. We delve into the market share held by key players like Total SA, ExxonMobil, and Shell, revealing the level of market consolidation. The impact of regulatory changes on the industry, particularly concerning environmental regulations and emission standards (like IMO 2020), is explored. The report also assesses the influence of technological advancements, such as the adoption of alternative fuels (LNG), on market structure. M&A activity, including deal values (xx Million) and their impact on market dynamics are also analyzed. The analysis also covers the influence of product substitutes, end-user demographics, and evolving consumption patterns on the market's structure and innovation dynamics.
APAC Bunker Fuel Industry Market Dynamics & Trends
This section offers a detailed examination of the key factors driving market growth in the APAC bunker fuel industry. We analyze the Compound Annual Growth Rate (CAGR) and market penetration rates for various fuel types and vessel segments throughout the forecast period. Detailed analysis covers market growth drivers such as increasing global trade, the expansion of the maritime industry, and rising demand for efficient and environmentally compliant fuels. We explore technological disruptions, including the shift towards cleaner fuels like LNG and the adoption of digital technologies for fuel management and supply chain optimization. The competitive dynamics are scrutinized, focusing on pricing strategies, market share battles, and the impact of new entrants and strategic alliances. Consumer preferences, specifically the increasing demand for lower-sulfur fuels to meet environmental regulations, are analyzed.
Dominant Regions & Segments in APAP Bunker Fuel Industry
This section identifies the leading regions and segments within the APAC bunker fuel market. The analysis pinpoints the most dominant countries and regions based on consumption volumes and market value across different fuel types and vessel segments.
Key Drivers of Dominance:
- Fuel Type: Strong growth in VLSFO demand driven by stricter emission regulations. HSFO demand is expected to decline. Growth in LNG bunkering is also analyzed, showing a gradual rise in adoption but hampered by infrastructure limitations.
- Vessel Type: The container segment remains the largest consumer of bunker fuels, driven by robust growth in global trade. Tankers and bulk carriers contribute significantly but growth projections vary based on global economic conditions and trade patterns.
- Regional Analysis: [Specific countries/regions and their contributing factors will be detailed here, e.g., China’s significant demand due to its large port infrastructure and maritime activity; Singapore's role as a major bunkering hub; and projected growth in Southeast Asia.] Economic policies, infrastructure investments (port development), and governmental regulations are highlighted as key factors influencing regional dominance.
APAP Bunker Fuel Industry Product Innovations
This section reviews recent product developments and their impact on the competitive landscape. This includes discussion of new fuel blends, advancements in fuel delivery systems, and technological innovations aimed at improving fuel efficiency and reducing environmental impact. The emphasis is on the market fit of new products and their competitive advantages, highlighting technological trends shaping the future of the industry.
Report Scope & Segmentation Analysis
This report segments the APAC bunker fuel market by fuel type (HSFO, VLSFO, MGO, LNG, Others) and vessel type (Containers, Tankers, General Cargo, Bulk Carriers, Others). Each segment's analysis includes growth projections, market size (in Millions), and competitive dynamics, providing detailed breakdowns for each category and forecast for market growth.
Example: The VLSFO segment is expected to show significant growth due to stringent environmental regulations. The container vessel segment shows strong growth projections linked to expanding global trade, while LNG bunkering is expected to witness moderate growth driven by rising environmental concerns and increasing infrastructure development.
Key Drivers of APAC Bunker Fuel Industry Growth
Several factors contribute to the growth of the APAC bunker fuel industry. These include the increasing global trade volume, expansion of the maritime sector, rising demand for efficient and environmentally compliant fuels, and government policies supporting sustainable shipping. Technological advancements in fuel production and delivery systems also contribute significantly. Economic growth in the APAC region further fuels the demand.
Challenges in the APAC Bunker Fuel Industry Sector
The APAC bunker fuel industry faces challenges such as fluctuating crude oil prices, stringent environmental regulations, and supply chain disruptions. Competition among major players and the need for significant infrastructure investment for alternative fuels (like LNG) also pose challenges. These factors can significantly impact the profitability and sustainability of businesses in this sector. The report quantifies these impacts where data permits, referencing specific figures for relevant events.
Emerging Opportunities in APAC Bunker Fuel Industry
Emerging opportunities include the growing demand for LNG as a cleaner fuel, development of biofuels, and digitalization of the bunker fuel supply chain. Expansion into new markets within the APAC region, particularly in developing economies with growing maritime activities, also presents lucrative opportunities. Technological advancements and shifts in consumer preference towards environmentally friendly fuels create new pathways for growth.
Leading Players in the APAP Bunker Fuel Industry Market
- TotalEnergies SE
- ExxonMobil Corporation
- BP
- BP Sinopec Marine Fuels Pte Ltd
- China COSCO Holdings Company Limited
- Indian Oil Corporation Limited
- Royal Dutch Shell PLC
- Ocean Network Express PTE Ltd
- Chimbusco Pan Nation Petro-Chemical Co Ltd
Key Developments in APAC Bunker Fuel Industry
- 2022 Q4: X Company announced a major investment in LNG bunkering infrastructure.
- 2023 Q1: Y Company launched a new low-sulfur fuel blend.
- 2023 Q3: Z Company acquired a significant stake in a competitor. [Further key developments will be listed here with specific dates and their impacts.]
Future Outlook for APAC Bunker Fuel Industry Market
The future of the APAC bunker fuel market is bright, driven by the sustained growth of the maritime industry and increasing adoption of cleaner fuels. Strategic investments in infrastructure development and technological innovation will be crucial for industry players to capitalize on growth opportunities. The market is expected to experience substantial growth over the next decade, particularly in segments driven by stringent environmental regulations and the increasing demand for sustainable fuels.
APAC Bunker Fuel Industry Segmentation
-
1. Fuel Type
- 1.1. High Sulfur Fuel Oil (HSFO)
- 1.2. Very-Low Sulfur Fuel Oil (VLSFO)
- 1.3. Marine Gas Oil (MGO)
- 1.4. Liquefied Natural Gas (MGO)
- 1.5. Others
-
2. Vessel Type
- 2.1. Containers
- 2.2. Tankers
- 2.3. General Cargo
- 2.4. Bulk Carrier
- 2.5. Others
-
3. Geography
- 3.1. China
- 3.2. India
- 3.3. Singapore
- 3.4. Rest of Asia-Pacific
APAC Bunker Fuel Industry Segmentation By Geography
- 1. China
- 2. India
- 3. Singapore
- 4. Rest of Asia Pacific
APAC Bunker Fuel Industry REPORT HIGHLIGHTS
| Aspects | Details |
|---|---|
| Study Period | 2019-2033 |
| Base Year | 2024 |
| Estimated Year | 2025 |
| Forecast Period | 2025-2033 |
| Historical Period | 2019-2024 |
| Growth Rate | CAGR of > 16.00% from 2019-2033 |
| Segmentation |
|
Table of Contents
- 1. Introduction
- 1.1. Research Scope
- 1.2. Market Segmentation
- 1.3. Research Methodology
- 1.4. Definitions and Assumptions
- 2. Executive Summary
- 2.1. Introduction
- 3. Market Dynamics
- 3.1. Introduction
- 3.2. Market Drivers
- 3.2.1. Increasing Demand for Oil and Gas4.; Presence of Proven Oil and Gas Reserves
- 3.3. Market Restrains
- 3.3.1. Volatile Oil and Gas Prices
- 3.4. Market Trends
- 3.4.1. VLSFO to Witness Significant Growth
- 4. Market Factor Analysis
- 4.1. Porters Five Forces
- 4.2. Supply/Value Chain
- 4.3. PESTEL analysis
- 4.4. Market Entropy
- 4.5. Patent/Trademark Analysis
- 5. Global APAC Bunker Fuel Industry Analysis, Insights and Forecast, 2019-2031
- 5.1. Market Analysis, Insights and Forecast - by Fuel Type
- 5.1.1. High Sulfur Fuel Oil (HSFO)
- 5.1.2. Very-Low Sulfur Fuel Oil (VLSFO)
- 5.1.3. Marine Gas Oil (MGO)
- 5.1.4. Liquefied Natural Gas (MGO)
- 5.1.5. Others
- 5.2. Market Analysis, Insights and Forecast - by Vessel Type
- 5.2.1. Containers
- 5.2.2. Tankers
- 5.2.3. General Cargo
- 5.2.4. Bulk Carrier
- 5.2.5. Others
- 5.3. Market Analysis, Insights and Forecast - by Geography
- 5.3.1. China
- 5.3.2. India
- 5.3.3. Singapore
- 5.3.4. Rest of Asia-Pacific
- 5.4. Market Analysis, Insights and Forecast - by Region
- 5.4.1. China
- 5.4.2. India
- 5.4.3. Singapore
- 5.4.4. Rest of Asia Pacific
- 5.1. Market Analysis, Insights and Forecast - by Fuel Type
- 6. China APAC Bunker Fuel Industry Analysis, Insights and Forecast, 2019-2031
- 6.1. Market Analysis, Insights and Forecast - by Fuel Type
- 6.1.1. High Sulfur Fuel Oil (HSFO)
- 6.1.2. Very-Low Sulfur Fuel Oil (VLSFO)
- 6.1.3. Marine Gas Oil (MGO)
- 6.1.4. Liquefied Natural Gas (MGO)
- 6.1.5. Others
- 6.2. Market Analysis, Insights and Forecast - by Vessel Type
- 6.2.1. Containers
- 6.2.2. Tankers
- 6.2.3. General Cargo
- 6.2.4. Bulk Carrier
- 6.2.5. Others
- 6.3. Market Analysis, Insights and Forecast - by Geography
- 6.3.1. China
- 6.3.2. India
- 6.3.3. Singapore
- 6.3.4. Rest of Asia-Pacific
- 6.1. Market Analysis, Insights and Forecast - by Fuel Type
- 7. India APAC Bunker Fuel Industry Analysis, Insights and Forecast, 2019-2031
- 7.1. Market Analysis, Insights and Forecast - by Fuel Type
- 7.1.1. High Sulfur Fuel Oil (HSFO)
- 7.1.2. Very-Low Sulfur Fuel Oil (VLSFO)
- 7.1.3. Marine Gas Oil (MGO)
- 7.1.4. Liquefied Natural Gas (MGO)
- 7.1.5. Others
- 7.2. Market Analysis, Insights and Forecast - by Vessel Type
- 7.2.1. Containers
- 7.2.2. Tankers
- 7.2.3. General Cargo
- 7.2.4. Bulk Carrier
- 7.2.5. Others
- 7.3. Market Analysis, Insights and Forecast - by Geography
- 7.3.1. China
- 7.3.2. India
- 7.3.3. Singapore
- 7.3.4. Rest of Asia-Pacific
- 7.1. Market Analysis, Insights and Forecast - by Fuel Type
- 8. Singapore APAC Bunker Fuel Industry Analysis, Insights and Forecast, 2019-2031
- 8.1. Market Analysis, Insights and Forecast - by Fuel Type
- 8.1.1. High Sulfur Fuel Oil (HSFO)
- 8.1.2. Very-Low Sulfur Fuel Oil (VLSFO)
- 8.1.3. Marine Gas Oil (MGO)
- 8.1.4. Liquefied Natural Gas (MGO)
- 8.1.5. Others
- 8.2. Market Analysis, Insights and Forecast - by Vessel Type
- 8.2.1. Containers
- 8.2.2. Tankers
- 8.2.3. General Cargo
- 8.2.4. Bulk Carrier
- 8.2.5. Others
- 8.3. Market Analysis, Insights and Forecast - by Geography
- 8.3.1. China
- 8.3.2. India
- 8.3.3. Singapore
- 8.3.4. Rest of Asia-Pacific
- 8.1. Market Analysis, Insights and Forecast - by Fuel Type
- 9. Rest of Asia Pacific APAC Bunker Fuel Industry Analysis, Insights and Forecast, 2019-2031
- 9.1. Market Analysis, Insights and Forecast - by Fuel Type
- 9.1.1. High Sulfur Fuel Oil (HSFO)
- 9.1.2. Very-Low Sulfur Fuel Oil (VLSFO)
- 9.1.3. Marine Gas Oil (MGO)
- 9.1.4. Liquefied Natural Gas (MGO)
- 9.1.5. Others
- 9.2. Market Analysis, Insights and Forecast - by Vessel Type
- 9.2.1. Containers
- 9.2.2. Tankers
- 9.2.3. General Cargo
- 9.2.4. Bulk Carrier
- 9.2.5. Others
- 9.3. Market Analysis, Insights and Forecast - by Geography
- 9.3.1. China
- 9.3.2. India
- 9.3.3. Singapore
- 9.3.4. Rest of Asia-Pacific
- 9.1. Market Analysis, Insights and Forecast - by Fuel Type
- 10. North America APAC Bunker Fuel Industry Analysis, Insights and Forecast, 2019-2031
- 10.1. Market Analysis, Insights and Forecast - By Country/Sub-region
- 10.1.1 United States
- 10.1.2 Canada
- 10.1.3 Mexico
- 11. Europe APAC Bunker Fuel Industry Analysis, Insights and Forecast, 2019-2031
- 11.1. Market Analysis, Insights and Forecast - By Country/Sub-region
- 11.1.1 Germany
- 11.1.2 United Kingdom
- 11.1.3 France
- 11.1.4 Spain
- 11.1.5 Italy
- 11.1.6 Spain
- 11.1.7 Belgium
- 11.1.8 Netherland
- 11.1.9 Nordics
- 11.1.10 Rest of Europe
- 12. Asia Pacific APAC Bunker Fuel Industry Analysis, Insights and Forecast, 2019-2031
- 12.1. Market Analysis, Insights and Forecast - By Country/Sub-region
- 12.1.1 China
- 12.1.2 Japan
- 12.1.3 India
- 12.1.4 South Korea
- 12.1.5 Southeast Asia
- 12.1.6 Australia
- 12.1.7 Indonesia
- 12.1.8 Phillipes
- 12.1.9 Singapore
- 12.1.10 Thailandc
- 12.1.11 Rest of Asia Pacific
- 13. South America APAC Bunker Fuel Industry Analysis, Insights and Forecast, 2019-2031
- 13.1. Market Analysis, Insights and Forecast - By Country/Sub-region
- 13.1.1 Brazil
- 13.1.2 Argentina
- 13.1.3 Peru
- 13.1.4 Chile
- 13.1.5 Colombia
- 13.1.6 Ecuador
- 13.1.7 Venezuela
- 13.1.8 Rest of South America
- 14. North America APAC Bunker Fuel Industry Analysis, Insights and Forecast, 2019-2031
- 14.1. Market Analysis, Insights and Forecast - By Country/Sub-region
- 14.1.1 United States
- 14.1.2 Canada
- 14.1.3 Mexico
- 15. MEA APAC Bunker Fuel Industry Analysis, Insights and Forecast, 2019-2031
- 15.1. Market Analysis, Insights and Forecast - By Country/Sub-region
- 15.1.1 United Arab Emirates
- 15.1.2 Saudi Arabia
- 15.1.3 South Africa
- 15.1.4 Rest of Middle East and Africa
- 16. Competitive Analysis
- 16.1. Global Market Share Analysis 2024
- 16.2. Company Profiles
- 16.2.1 Total SA
- 16.2.1.1. Overview
- 16.2.1.2. Products
- 16.2.1.3. SWOT Analysis
- 16.2.1.4. Recent Developments
- 16.2.1.5. Financials (Based on Availability)
- 16.2.2 Exxon Mobil Corporation
- 16.2.2.1. Overview
- 16.2.2.2. Products
- 16.2.2.3. SWOT Analysis
- 16.2.2.4. Recent Developments
- 16.2.2.5. Financials (Based on Availability)
- 16.2.3 BP Sinopec Marine Fuels Pte Ltd *List Not Exhaustive
- 16.2.3.1. Overview
- 16.2.3.2. Products
- 16.2.3.3. SWOT Analysis
- 16.2.3.4. Recent Developments
- 16.2.3.5. Financials (Based on Availability)
- 16.2.4 China COSCO Holdings Company Limited
- 16.2.4.1. Overview
- 16.2.4.2. Products
- 16.2.4.3. SWOT Analysis
- 16.2.4.4. Recent Developments
- 16.2.4.5. Financials (Based on Availability)
- 16.2.5 Indian Oil Corporation Limited
- 16.2.5.1. Overview
- 16.2.5.2. Products
- 16.2.5.3. SWOT Analysis
- 16.2.5.4. Recent Developments
- 16.2.5.5. Financials (Based on Availability)
- 16.2.6 Royal Dutch Shell PLC
- 16.2.6.1. Overview
- 16.2.6.2. Products
- 16.2.6.3. SWOT Analysis
- 16.2.6.4. Recent Developments
- 16.2.6.5. Financials (Based on Availability)
- 16.2.7 Ocean Network Express PTE Ltd
- 16.2.7.1. Overview
- 16.2.7.2. Products
- 16.2.7.3. SWOT Analysis
- 16.2.7.4. Recent Developments
- 16.2.7.5. Financials (Based on Availability)
- 16.2.8 Chimbusco Pan Nation Petro-Chemical Co Ltd
- 16.2.8.1. Overview
- 16.2.8.2. Products
- 16.2.8.3. SWOT Analysis
- 16.2.8.4. Recent Developments
- 16.2.8.5. Financials (Based on Availability)
- 16.2.1 Total SA
List of Figures
- Figure 1: Global APAC Bunker Fuel Industry Revenue Breakdown (Million, %) by Region 2024 & 2032
- Figure 2: North America APAC Bunker Fuel Industry Revenue (Million), by Country 2024 & 2032
- Figure 3: North America APAC Bunker Fuel Industry Revenue Share (%), by Country 2024 & 2032
- Figure 4: Europe APAC Bunker Fuel Industry Revenue (Million), by Country 2024 & 2032
- Figure 5: Europe APAC Bunker Fuel Industry Revenue Share (%), by Country 2024 & 2032
- Figure 6: Asia Pacific APAC Bunker Fuel Industry Revenue (Million), by Country 2024 & 2032
- Figure 7: Asia Pacific APAC Bunker Fuel Industry Revenue Share (%), by Country 2024 & 2032
- Figure 8: South America APAC Bunker Fuel Industry Revenue (Million), by Country 2024 & 2032
- Figure 9: South America APAC Bunker Fuel Industry Revenue Share (%), by Country 2024 & 2032
- Figure 10: North America APAC Bunker Fuel Industry Revenue (Million), by Country 2024 & 2032
- Figure 11: North America APAC Bunker Fuel Industry Revenue Share (%), by Country 2024 & 2032
- Figure 12: MEA APAC Bunker Fuel Industry Revenue (Million), by Country 2024 & 2032
- Figure 13: MEA APAC Bunker Fuel Industry Revenue Share (%), by Country 2024 & 2032
- Figure 14: China APAC Bunker Fuel Industry Revenue (Million), by Fuel Type 2024 & 2032
- Figure 15: China APAC Bunker Fuel Industry Revenue Share (%), by Fuel Type 2024 & 2032
- Figure 16: China APAC Bunker Fuel Industry Revenue (Million), by Vessel Type 2024 & 2032
- Figure 17: China APAC Bunker Fuel Industry Revenue Share (%), by Vessel Type 2024 & 2032
- Figure 18: China APAC Bunker Fuel Industry Revenue (Million), by Geography 2024 & 2032
- Figure 19: China APAC Bunker Fuel Industry Revenue Share (%), by Geography 2024 & 2032
- Figure 20: China APAC Bunker Fuel Industry Revenue (Million), by Country 2024 & 2032
- Figure 21: China APAC Bunker Fuel Industry Revenue Share (%), by Country 2024 & 2032
- Figure 22: India APAC Bunker Fuel Industry Revenue (Million), by Fuel Type 2024 & 2032
- Figure 23: India APAC Bunker Fuel Industry Revenue Share (%), by Fuel Type 2024 & 2032
- Figure 24: India APAC Bunker Fuel Industry Revenue (Million), by Vessel Type 2024 & 2032
- Figure 25: India APAC Bunker Fuel Industry Revenue Share (%), by Vessel Type 2024 & 2032
- Figure 26: India APAC Bunker Fuel Industry Revenue (Million), by Geography 2024 & 2032
- Figure 27: India APAC Bunker Fuel Industry Revenue Share (%), by Geography 2024 & 2032
- Figure 28: India APAC Bunker Fuel Industry Revenue (Million), by Country 2024 & 2032
- Figure 29: India APAC Bunker Fuel Industry Revenue Share (%), by Country 2024 & 2032
- Figure 30: Singapore APAC Bunker Fuel Industry Revenue (Million), by Fuel Type 2024 & 2032
- Figure 31: Singapore APAC Bunker Fuel Industry Revenue Share (%), by Fuel Type 2024 & 2032
- Figure 32: Singapore APAC Bunker Fuel Industry Revenue (Million), by Vessel Type 2024 & 2032
- Figure 33: Singapore APAC Bunker Fuel Industry Revenue Share (%), by Vessel Type 2024 & 2032
- Figure 34: Singapore APAC Bunker Fuel Industry Revenue (Million), by Geography 2024 & 2032
- Figure 35: Singapore APAC Bunker Fuel Industry Revenue Share (%), by Geography 2024 & 2032
- Figure 36: Singapore APAC Bunker Fuel Industry Revenue (Million), by Country 2024 & 2032
- Figure 37: Singapore APAC Bunker Fuel Industry Revenue Share (%), by Country 2024 & 2032
- Figure 38: Rest of Asia Pacific APAC Bunker Fuel Industry Revenue (Million), by Fuel Type 2024 & 2032
- Figure 39: Rest of Asia Pacific APAC Bunker Fuel Industry Revenue Share (%), by Fuel Type 2024 & 2032
- Figure 40: Rest of Asia Pacific APAC Bunker Fuel Industry Revenue (Million), by Vessel Type 2024 & 2032
- Figure 41: Rest of Asia Pacific APAC Bunker Fuel Industry Revenue Share (%), by Vessel Type 2024 & 2032
- Figure 42: Rest of Asia Pacific APAC Bunker Fuel Industry Revenue (Million), by Geography 2024 & 2032
- Figure 43: Rest of Asia Pacific APAC Bunker Fuel Industry Revenue Share (%), by Geography 2024 & 2032
- Figure 44: Rest of Asia Pacific APAC Bunker Fuel Industry Revenue (Million), by Country 2024 & 2032
- Figure 45: Rest of Asia Pacific APAC Bunker Fuel Industry Revenue Share (%), by Country 2024 & 2032
List of Tables
- Table 1: Global APAC Bunker Fuel Industry Revenue Million Forecast, by Region 2019 & 2032
- Table 2: Global APAC Bunker Fuel Industry Revenue Million Forecast, by Fuel Type 2019 & 2032
- Table 3: Global APAC Bunker Fuel Industry Revenue Million Forecast, by Vessel Type 2019 & 2032
- Table 4: Global APAC Bunker Fuel Industry Revenue Million Forecast, by Geography 2019 & 2032
- Table 5: Global APAC Bunker Fuel Industry Revenue Million Forecast, by Region 2019 & 2032
- Table 6: Global APAC Bunker Fuel Industry Revenue Million Forecast, by Country 2019 & 2032
- Table 7: United States APAC Bunker Fuel Industry Revenue (Million) Forecast, by Application 2019 & 2032
- Table 8: Canada APAC Bunker Fuel Industry Revenue (Million) Forecast, by Application 2019 & 2032
- Table 9: Mexico APAC Bunker Fuel Industry Revenue (Million) Forecast, by Application 2019 & 2032
- Table 10: Global APAC Bunker Fuel Industry Revenue Million Forecast, by Country 2019 & 2032
- Table 11: Germany APAC Bunker Fuel Industry Revenue (Million) Forecast, by Application 2019 & 2032
- Table 12: United Kingdom APAC Bunker Fuel Industry Revenue (Million) Forecast, by Application 2019 & 2032
- Table 13: France APAC Bunker Fuel Industry Revenue (Million) Forecast, by Application 2019 & 2032
- Table 14: Spain APAC Bunker Fuel Industry Revenue (Million) Forecast, by Application 2019 & 2032
- Table 15: Italy APAC Bunker Fuel Industry Revenue (Million) Forecast, by Application 2019 & 2032
- Table 16: Spain APAC Bunker Fuel Industry Revenue (Million) Forecast, by Application 2019 & 2032
- Table 17: Belgium APAC Bunker Fuel Industry Revenue (Million) Forecast, by Application 2019 & 2032
- Table 18: Netherland APAC Bunker Fuel Industry Revenue (Million) Forecast, by Application 2019 & 2032
- Table 19: Nordics APAC Bunker Fuel Industry Revenue (Million) Forecast, by Application 2019 & 2032
- Table 20: Rest of Europe APAC Bunker Fuel Industry Revenue (Million) Forecast, by Application 2019 & 2032
- Table 21: Global APAC Bunker Fuel Industry Revenue Million Forecast, by Country 2019 & 2032
- Table 22: China APAC Bunker Fuel Industry Revenue (Million) Forecast, by Application 2019 & 2032
- Table 23: Japan APAC Bunker Fuel Industry Revenue (Million) Forecast, by Application 2019 & 2032
- Table 24: India APAC Bunker Fuel Industry Revenue (Million) Forecast, by Application 2019 & 2032
- Table 25: South Korea APAC Bunker Fuel Industry Revenue (Million) Forecast, by Application 2019 & 2032
- Table 26: Southeast Asia APAC Bunker Fuel Industry Revenue (Million) Forecast, by Application 2019 & 2032
- Table 27: Australia APAC Bunker Fuel Industry Revenue (Million) Forecast, by Application 2019 & 2032
- Table 28: Indonesia APAC Bunker Fuel Industry Revenue (Million) Forecast, by Application 2019 & 2032
- Table 29: Phillipes APAC Bunker Fuel Industry Revenue (Million) Forecast, by Application 2019 & 2032
- Table 30: Singapore APAC Bunker Fuel Industry Revenue (Million) Forecast, by Application 2019 & 2032
- Table 31: Thailandc APAC Bunker Fuel Industry Revenue (Million) Forecast, by Application 2019 & 2032
- Table 32: Rest of Asia Pacific APAC Bunker Fuel Industry Revenue (Million) Forecast, by Application 2019 & 2032
- Table 33: Global APAC Bunker Fuel Industry Revenue Million Forecast, by Country 2019 & 2032
- Table 34: Brazil APAC Bunker Fuel Industry Revenue (Million) Forecast, by Application 2019 & 2032
- Table 35: Argentina APAC Bunker Fuel Industry Revenue (Million) Forecast, by Application 2019 & 2032
- Table 36: Peru APAC Bunker Fuel Industry Revenue (Million) Forecast, by Application 2019 & 2032
- Table 37: Chile APAC Bunker Fuel Industry Revenue (Million) Forecast, by Application 2019 & 2032
- Table 38: Colombia APAC Bunker Fuel Industry Revenue (Million) Forecast, by Application 2019 & 2032
- Table 39: Ecuador APAC Bunker Fuel Industry Revenue (Million) Forecast, by Application 2019 & 2032
- Table 40: Venezuela APAC Bunker Fuel Industry Revenue (Million) Forecast, by Application 2019 & 2032
- Table 41: Rest of South America APAC Bunker Fuel Industry Revenue (Million) Forecast, by Application 2019 & 2032
- Table 42: Global APAC Bunker Fuel Industry Revenue Million Forecast, by Country 2019 & 2032
- Table 43: United States APAC Bunker Fuel Industry Revenue (Million) Forecast, by Application 2019 & 2032
- Table 44: Canada APAC Bunker Fuel Industry Revenue (Million) Forecast, by Application 2019 & 2032
- Table 45: Mexico APAC Bunker Fuel Industry Revenue (Million) Forecast, by Application 2019 & 2032
- Table 46: Global APAC Bunker Fuel Industry Revenue Million Forecast, by Country 2019 & 2032
- Table 47: United Arab Emirates APAC Bunker Fuel Industry Revenue (Million) Forecast, by Application 2019 & 2032
- Table 48: Saudi Arabia APAC Bunker Fuel Industry Revenue (Million) Forecast, by Application 2019 & 2032
- Table 49: South Africa APAC Bunker Fuel Industry Revenue (Million) Forecast, by Application 2019 & 2032
- Table 50: Rest of Middle East and Africa APAC Bunker Fuel Industry Revenue (Million) Forecast, by Application 2019 & 2032
- Table 51: Global APAC Bunker Fuel Industry Revenue Million Forecast, by Fuel Type 2019 & 2032
- Table 52: Global APAC Bunker Fuel Industry Revenue Million Forecast, by Vessel Type 2019 & 2032
- Table 53: Global APAC Bunker Fuel Industry Revenue Million Forecast, by Geography 2019 & 2032
- Table 54: Global APAC Bunker Fuel Industry Revenue Million Forecast, by Country 2019 & 2032
- Table 55: Global APAC Bunker Fuel Industry Revenue Million Forecast, by Fuel Type 2019 & 2032
- Table 56: Global APAC Bunker Fuel Industry Revenue Million Forecast, by Vessel Type 2019 & 2032
- Table 57: Global APAC Bunker Fuel Industry Revenue Million Forecast, by Geography 2019 & 2032
- Table 58: Global APAC Bunker Fuel Industry Revenue Million Forecast, by Country 2019 & 2032
- Table 59: Global APAC Bunker Fuel Industry Revenue Million Forecast, by Fuel Type 2019 & 2032
- Table 60: Global APAC Bunker Fuel Industry Revenue Million Forecast, by Vessel Type 2019 & 2032
- Table 61: Global APAC Bunker Fuel Industry Revenue Million Forecast, by Geography 2019 & 2032
- Table 62: Global APAC Bunker Fuel Industry Revenue Million Forecast, by Country 2019 & 2032
- Table 63: Global APAC Bunker Fuel Industry Revenue Million Forecast, by Fuel Type 2019 & 2032
- Table 64: Global APAC Bunker Fuel Industry Revenue Million Forecast, by Vessel Type 2019 & 2032
- Table 65: Global APAC Bunker Fuel Industry Revenue Million Forecast, by Geography 2019 & 2032
- Table 66: Global APAC Bunker Fuel Industry Revenue Million Forecast, by Country 2019 & 2032
Frequently Asked Questions
1. What is the projected Compound Annual Growth Rate (CAGR) of the APAC Bunker Fuel Industry?
The projected CAGR is approximately > 16.00%.
2. Which companies are prominent players in the APAC Bunker Fuel Industry?
Key companies in the market include Total SA, Exxon Mobil Corporation, BP Sinopec Marine Fuels Pte Ltd *List Not Exhaustive, China COSCO Holdings Company Limited, Indian Oil Corporation Limited, Royal Dutch Shell PLC, Ocean Network Express PTE Ltd, Chimbusco Pan Nation Petro-Chemical Co Ltd.
3. What are the main segments of the APAC Bunker Fuel Industry?
The market segments include Fuel Type, Vessel Type, Geography.
4. Can you provide details about the market size?
The market size is estimated to be USD XX Million as of 2022.
5. What are some drivers contributing to market growth?
Increasing Demand for Oil and Gas4.; Presence of Proven Oil and Gas Reserves.
6. What are the notable trends driving market growth?
VLSFO to Witness Significant Growth.
7. Are there any restraints impacting market growth?
Volatile Oil and Gas Prices.
8. Can you provide examples of recent developments in the market?
N/A
9. What pricing options are available for accessing the report?
Pricing options include single-user, multi-user, and enterprise licenses priced at USD 4750, USD 5250, and USD 8750 respectively.
10. Is the market size provided in terms of value or volume?
The market size is provided in terms of value, measured in Million.
11. Are there any specific market keywords associated with the report?
Yes, the market keyword associated with the report is "APAC Bunker Fuel Industry," which aids in identifying and referencing the specific market segment covered.
12. How do I determine which pricing option suits my needs best?
The pricing options vary based on user requirements and access needs. Individual users may opt for single-user licenses, while businesses requiring broader access may choose multi-user or enterprise licenses for cost-effective access to the report.
13. Are there any additional resources or data provided in the APAC Bunker Fuel Industry report?
While the report offers comprehensive insights, it's advisable to review the specific contents or supplementary materials provided to ascertain if additional resources or data are available.
14. How can I stay updated on further developments or reports in the APAC Bunker Fuel Industry?
To stay informed about further developments, trends, and reports in the APAC Bunker Fuel Industry, consider subscribing to industry newsletters, following relevant companies and organizations, or regularly checking reputable industry news sources and publications.
Methodology
Step 1 - Identification of Relevant Samples Size from Population Database


Step 2 - Approaches for Defining Global Market Size (Value, Volume* & Price*)

Note*: In applicable scenarios
Step 3 - Data Sources
Primary Research
- Web Analytics
- Survey Reports
- Research Institute
- Latest Research Reports
- Opinion Leaders
Secondary Research
- Annual Reports
- White Paper
- Latest Press Release
- Industry Association
- Paid Database
- Investor Presentations

Step 4 - Data Triangulation
Involves using different sources of information in order to increase the validity of a study
These sources are likely to be stakeholders in a program - participants, other researchers, program staff, other community members, and so on.
Then we put all data in single framework & apply various statistical tools to find out the dynamic on the market.
During the analysis stage, feedback from the stakeholder groups would be compared to determine areas of agreement as well as areas of divergence


