
Key Insights
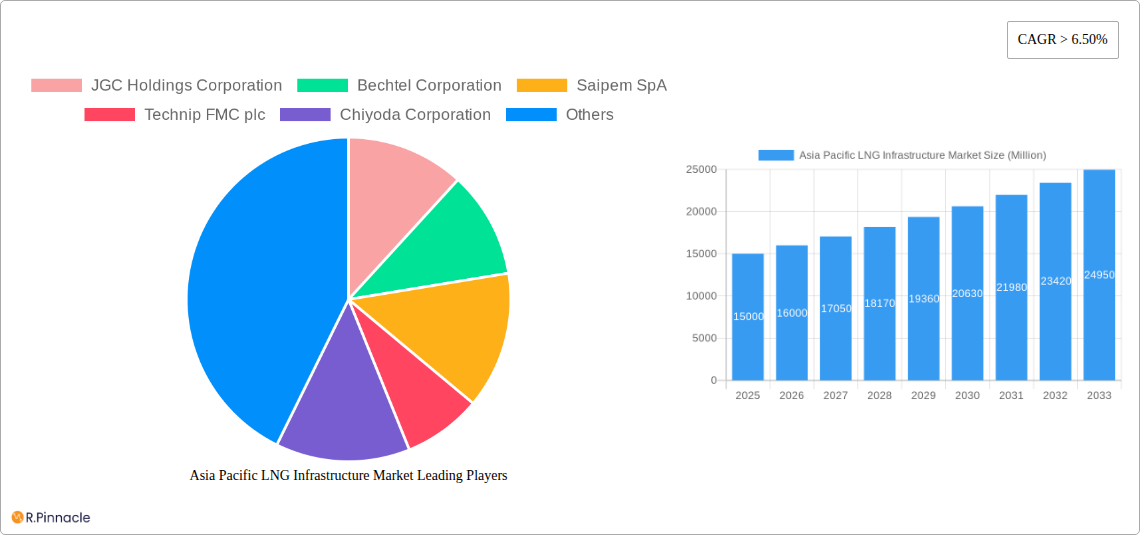
The Asia-Pacific LNG infrastructure market is experiencing robust growth, driven by increasing energy demand, particularly in rapidly developing economies like China, India, and South Korea. The region's reliance on natural gas for power generation and industrial applications, coupled with a commitment to cleaner energy sources, is fueling significant investments in liquefaction and regasification terminals. This expansion is further supported by government initiatives promoting energy security and diversification, alongside ongoing efforts to reduce reliance on coal. The market's compound annual growth rate (CAGR) exceeding 6.50% indicates a sustained period of expansion. While challenges such as fluctuating gas prices and regulatory hurdles exist, the long-term outlook remains positive, with substantial opportunities for major players like JGC Holdings Corporation, Bechtel Corporation, and Saipem SpA. The market segmentation highlights a strong demand for both liquefaction and regasification infrastructure, reflecting the diverse needs across the Asia-Pacific region, with some nations focused on exporting LNG and others concentrating on importing it to meet their energy requirements.
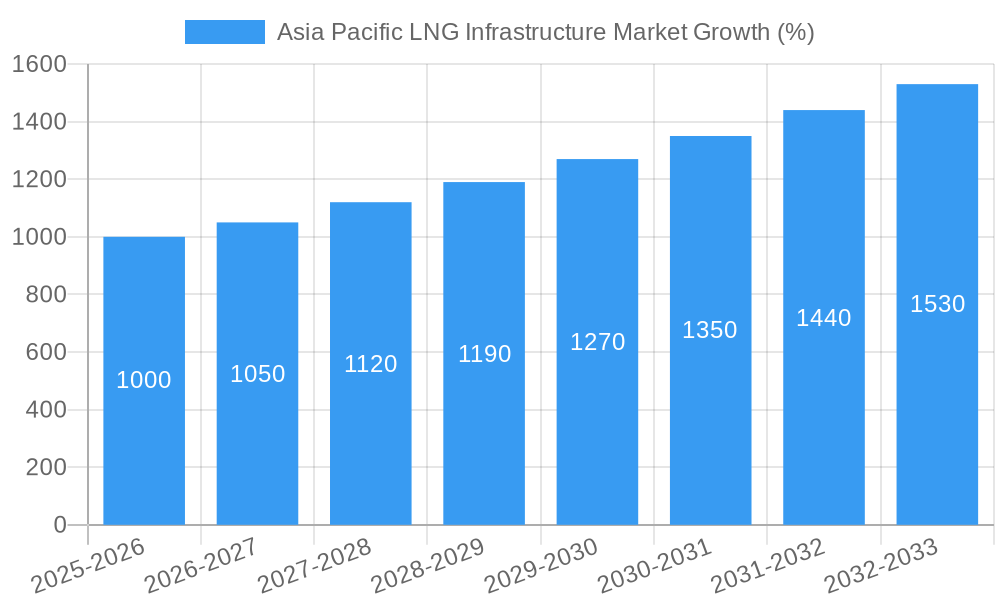
The forecast period (2025-2033) suggests continued expansion, with a projected market size significantly larger than the current figure. This growth will be particularly prominent in countries with burgeoning industrial sectors and growing populations. The competition among leading companies is expected to intensify, driving innovation and efficiency improvements within the LNG infrastructure sector. While geopolitical factors and potential supply chain disruptions pose risks, the underlying drivers of demand in the Asia-Pacific region are expected to continue to propel market growth well into the forecast period, creating lucrative opportunities for investors and industry stakeholders alike. The sustained growth in the sector will likely lead to further expansion of existing infrastructure and the development of new facilities across the region.
Asia Pacific LNG Infrastructure Market: A Comprehensive Report (2019-2033)
This in-depth report provides a comprehensive analysis of the Asia Pacific LNG Infrastructure market, offering invaluable insights for industry professionals, investors, and strategic decision-makers. The study covers the period from 2019 to 2033, with a focus on the forecast period from 2025 to 2033, and utilizes 2025 as the base year. The report's value surpasses xx Million.
Asia Pacific LNG Infrastructure Market Market Structure & Innovation Trends
This section analyzes the market's competitive landscape, highlighting key trends shaping its evolution. We delve into market concentration, identifying dominant players and their respective market shares. Innovation drivers, including technological advancements and regulatory changes, are examined. The analysis also encompasses the impact of product substitutes, end-user demographics, and mergers & acquisitions (M&A) activities on market dynamics. We present quantifiable data on M&A deal values, revealing the level of consolidation and investment in the sector.
- Market Concentration: The Asia Pacific LNG infrastructure market exhibits a moderately concentrated structure, with a few major players holding significant market share. JGC Holdings Corporation, Bechtel Corporation, and Saipem SpA are among the leading players. The combined market share of the top five players is estimated to be xx%.
- Innovation Drivers: Technological advancements in liquefaction and regasification technologies, coupled with increasing demand for cleaner energy sources, are driving innovation. Stringent environmental regulations are also pushing for more efficient and environmentally friendly infrastructure.
- Regulatory Frameworks: Varying regulatory landscapes across the Asia Pacific region influence investment decisions and market entry. Streamlined approval processes and supportive policies are crucial for market expansion.
- Product Substitutes: While LNG remains a dominant energy source, competition exists from other fuels, such as renewable energy sources. The report analyzes the competitive pressures from these substitutes.
- End-User Demographics: The report segments end-users based on their energy consumption patterns, including industrial, commercial, and residential sectors. We analyze the varied demands and preferences of these user segments, influencing infrastructure development.
- M&A Activities: The report analyzes the number and value of M&A deals in the sector. The analysis reveals strategic acquisitions aimed at expanding geographic reach, enhancing technological capabilities, and securing resources. The total value of M&A deals between 2019 and 2024 is estimated to be xx Million.
Asia Pacific LNG Infrastructure Market Market Dynamics & Trends
This section explores the key factors driving market growth, technological disruptions, evolving consumer preferences, and intense competitive dynamics. We provide a detailed analysis of the market's Compound Annual Growth Rate (CAGR) and market penetration across various segments. The total market size in 2025 is estimated at xx Million, with a projected CAGR of xx% from 2025 to 2033.
(This section will contain 600 words detailing market growth drivers, technological disruptions, consumer preferences, and competitive dynamics, with specific CAGR and market penetration metrics).
Dominant Regions & Segments in Asia Pacific LNG Infrastructure Market
This section identifies the leading regions and segments within the Asia Pacific LNG Infrastructure market, focusing on Type: Regasification Terminal and Liquefaction Terminal. We analyze the factors driving their dominance, including economic policies, infrastructure development, and market demand.
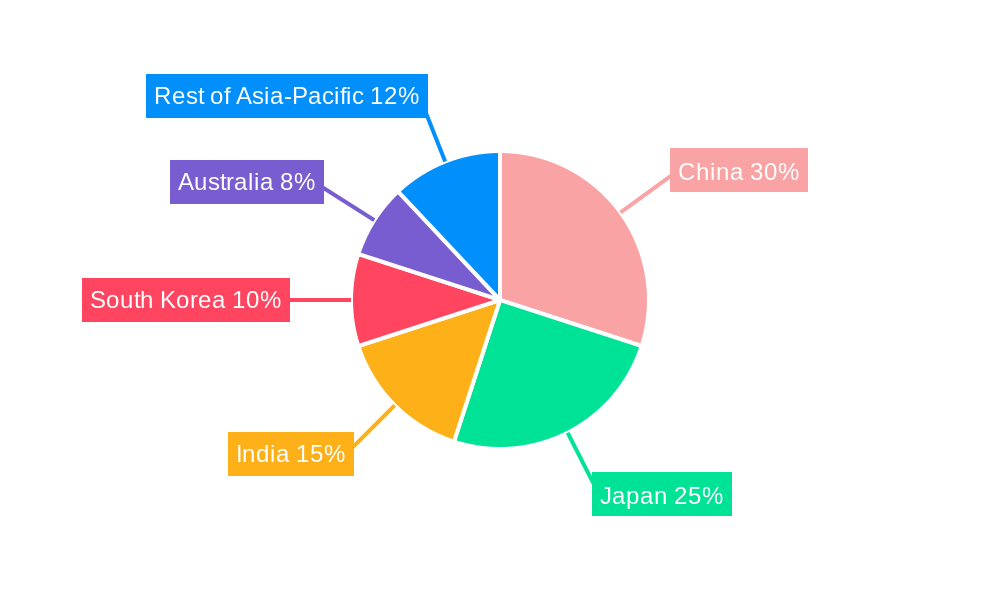
- Dominant Region: (e.g., China, due to its high energy demand and ongoing infrastructure development projects).
- Dominant Segment: (e.g., Regasification Terminals, fueled by growing demand for imported LNG).
(This section will contain 600 words detailing the dominance analysis of leading regions and segments with bullet points outlining key drivers such as economic policies and infrastructure.)
Asia Pacific LNG Infrastructure Market Product Innovations
This section summarizes recent product developments, applications, and competitive advantages within the LNG infrastructure market. The focus is on technological advancements, including the introduction of more efficient liquefaction and regasification technologies, small-scale LNG solutions, and innovative materials for enhanced durability and safety.
Report Scope & Segmentation Analysis
This report segments the Asia Pacific LNG Infrastructure market by type: Regasification Terminal and Liquefaction Terminal.
- Regasification Terminal: This segment analyzes the market size, growth projections, and competitive dynamics of regasification terminals across the Asia Pacific region. The market size in 2025 is estimated to be xx Million.
- Liquefaction Terminal: This segment provides similar analysis for liquefaction terminals, considering factors such as capacity expansions, technological advancements, and regulatory considerations. The market size in 2025 is estimated to be xx Million.
(This section will have approximately 100–150 words total describing the segments, growth projections, market sizes and competitive dynamics.)
Key Drivers of Asia Pacific LNG Infrastructure Market Growth
Several factors are driving the growth of the Asia Pacific LNG infrastructure market. These include increasing energy demand, particularly in developing economies, government support for LNG infrastructure development, and the growing need for cleaner energy sources. Technological advancements, such as the development of more efficient liquefaction and regasification technologies and the rise of small-scale LNG solutions, are also significant contributors to market growth.
Challenges in the Asia Pacific LNG Infrastructure Market Sector
The Asia Pacific LNG infrastructure market faces several challenges, including the high capital costs associated with building new infrastructure and potential regulatory hurdles across different jurisdictions. Supply chain complexities and potential geopolitical risks also pose significant challenges for project development and operation. Competition from other energy sources and the fluctuating price of LNG also impact market growth.
Emerging Opportunities in Asia Pacific LNG Infrastructure Market
Emerging opportunities include the development of small-scale LNG infrastructure to serve remote and off-grid communities, as exemplified by recent partnerships between NOVATEK and Mitsui & Co. The increasing demand for cleaner energy sources will continue to create demand for LNG infrastructure. Moreover, technological advancements, such as improved efficiency and lower emissions, present significant opportunities for innovation and growth.
Leading Players in the Asia Pacific LNG Infrastructure Market Market
- JGC Holdings Corporation
- Bechtel Corporation
- Saipem SpA
- Technip FMC plc
- Chiyoda Corporation
- Fluor Corporation
- McDermott International Inc
- Chevron corporation
Key Developments in Asia Pacific LNG Infrastructure Market Industry
- June 2022: NOVATEK signed small-scale LNG cooperation agreements, focusing on expanding LNG use as motor fuel and for off-grid customers.
- April 2021: INOXCVA and Mitsui & Co. signed an MOU for establishing a virtual pipeline in India and deploying small-scale LNG infrastructure.
Future Outlook for Asia Pacific LNG Infrastructure Market Market
The Asia Pacific LNG infrastructure market is poised for significant growth driven by increasing energy demand, supportive government policies, and ongoing technological advancements. Strategic investments in infrastructure development and the adoption of innovative technologies will further accelerate market expansion. The focus on small-scale LNG solutions will unlock new opportunities in underserved markets, driving overall market growth in the coming years.
Asia Pacific LNG Infrastructure Market Segmentation
-
1. Type
- 1.1. Regasification Terminal
- 1.2. Liquefication Terminal
-
2. Geography
- 2.1. India
- 2.2. China
- 2.3. Japan
- 2.4. Australia
- 2.5. South Korea
- 2.6. Rest of Asia Pacific
Asia Pacific LNG Infrastructure Market Segmentation By Geography
- 1. India
- 2. China
- 3. Japan
- 4. Australia
- 5. South Korea
- 6. Rest of Asia Pacific
Asia Pacific LNG Infrastructure Market REPORT HIGHLIGHTS
| Aspects | Details |
|---|---|
| Study Period | 2019-2033 |
| Base Year | 2024 |
| Estimated Year | 2025 |
| Forecast Period | 2025-2033 |
| Historical Period | 2019-2024 |
| Growth Rate | CAGR of > 6.50% from 2019-2033 |
| Segmentation |
|
Table of Contents
- 1. Introduction
- 1.1. Research Scope
- 1.2. Market Segmentation
- 1.3. Research Methodology
- 1.4. Definitions and Assumptions
- 2. Executive Summary
- 2.1. Introduction
- 3. Market Dynamics
- 3.1. Introduction
- 3.2. Market Drivers
- 3.2.1. 4.; Growing Vehicle Ownership4.; Government Initiatives
- 3.3. Market Restrains
- 3.3.1. 4.; Volatile Crude Oil Prices
- 3.4. Market Trends
- 3.4.1. Regasification terminal Segment to have a Significant Share in the Market
- 4. Market Factor Analysis
- 4.1. Porters Five Forces
- 4.2. Supply/Value Chain
- 4.3. PESTEL analysis
- 4.4. Market Entropy
- 4.5. Patent/Trademark Analysis
- 5. Asia Pacific LNG Infrastructure Market Analysis, Insights and Forecast, 2019-2031
- 5.1. Market Analysis, Insights and Forecast - by Type
- 5.1.1. Regasification Terminal
- 5.1.2. Liquefication Terminal
- 5.2. Market Analysis, Insights and Forecast - by Geography
- 5.2.1. India
- 5.2.2. China
- 5.2.3. Japan
- 5.2.4. Australia
- 5.2.5. South Korea
- 5.2.6. Rest of Asia Pacific
- 5.3. Market Analysis, Insights and Forecast - by Region
- 5.3.1. India
- 5.3.2. China
- 5.3.3. Japan
- 5.3.4. Australia
- 5.3.5. South Korea
- 5.3.6. Rest of Asia Pacific
- 5.1. Market Analysis, Insights and Forecast - by Type
- 6. India Asia Pacific LNG Infrastructure Market Analysis, Insights and Forecast, 2019-2031
- 6.1. Market Analysis, Insights and Forecast - by Type
- 6.1.1. Regasification Terminal
- 6.1.2. Liquefication Terminal
- 6.2. Market Analysis, Insights and Forecast - by Geography
- 6.2.1. India
- 6.2.2. China
- 6.2.3. Japan
- 6.2.4. Australia
- 6.2.5. South Korea
- 6.2.6. Rest of Asia Pacific
- 6.1. Market Analysis, Insights and Forecast - by Type
- 7. China Asia Pacific LNG Infrastructure Market Analysis, Insights and Forecast, 2019-2031
- 7.1. Market Analysis, Insights and Forecast - by Type
- 7.1.1. Regasification Terminal
- 7.1.2. Liquefication Terminal
- 7.2. Market Analysis, Insights and Forecast - by Geography
- 7.2.1. India
- 7.2.2. China
- 7.2.3. Japan
- 7.2.4. Australia
- 7.2.5. South Korea
- 7.2.6. Rest of Asia Pacific
- 7.1. Market Analysis, Insights and Forecast - by Type
- 8. Japan Asia Pacific LNG Infrastructure Market Analysis, Insights and Forecast, 2019-2031
- 8.1. Market Analysis, Insights and Forecast - by Type
- 8.1.1. Regasification Terminal
- 8.1.2. Liquefication Terminal
- 8.2. Market Analysis, Insights and Forecast - by Geography
- 8.2.1. India
- 8.2.2. China
- 8.2.3. Japan
- 8.2.4. Australia
- 8.2.5. South Korea
- 8.2.6. Rest of Asia Pacific
- 8.1. Market Analysis, Insights and Forecast - by Type
- 9. Australia Asia Pacific LNG Infrastructure Market Analysis, Insights and Forecast, 2019-2031
- 9.1. Market Analysis, Insights and Forecast - by Type
- 9.1.1. Regasification Terminal
- 9.1.2. Liquefication Terminal
- 9.2. Market Analysis, Insights and Forecast - by Geography
- 9.2.1. India
- 9.2.2. China
- 9.2.3. Japan
- 9.2.4. Australia
- 9.2.5. South Korea
- 9.2.6. Rest of Asia Pacific
- 9.1. Market Analysis, Insights and Forecast - by Type
- 10. South Korea Asia Pacific LNG Infrastructure Market Analysis, Insights and Forecast, 2019-2031
- 10.1. Market Analysis, Insights and Forecast - by Type
- 10.1.1. Regasification Terminal
- 10.1.2. Liquefication Terminal
- 10.2. Market Analysis, Insights and Forecast - by Geography
- 10.2.1. India
- 10.2.2. China
- 10.2.3. Japan
- 10.2.4. Australia
- 10.2.5. South Korea
- 10.2.6. Rest of Asia Pacific
- 10.1. Market Analysis, Insights and Forecast - by Type
- 11. Rest of Asia Pacific Asia Pacific LNG Infrastructure Market Analysis, Insights and Forecast, 2019-2031
- 11.1. Market Analysis, Insights and Forecast - by Type
- 11.1.1. Regasification Terminal
- 11.1.2. Liquefication Terminal
- 11.2. Market Analysis, Insights and Forecast - by Geography
- 11.2.1. India
- 11.2.2. China
- 11.2.3. Japan
- 11.2.4. Australia
- 11.2.5. South Korea
- 11.2.6. Rest of Asia Pacific
- 11.1. Market Analysis, Insights and Forecast - by Type
- 12. China Asia Pacific LNG Infrastructure Market Analysis, Insights and Forecast, 2019-2031
- 13. Japan Asia Pacific LNG Infrastructure Market Analysis, Insights and Forecast, 2019-2031
- 14. India Asia Pacific LNG Infrastructure Market Analysis, Insights and Forecast, 2019-2031
- 15. South Korea Asia Pacific LNG Infrastructure Market Analysis, Insights and Forecast, 2019-2031
- 16. Taiwan Asia Pacific LNG Infrastructure Market Analysis, Insights and Forecast, 2019-2031
- 17. Australia Asia Pacific LNG Infrastructure Market Analysis, Insights and Forecast, 2019-2031
- 18. Rest of Asia-Pacific Asia Pacific LNG Infrastructure Market Analysis, Insights and Forecast, 2019-2031
- 19. Competitive Analysis
- 19.1. Market Share Analysis 2024
- 19.2. Company Profiles
- 19.2.1 JGC Holdings Corporation
- 19.2.1.1. Overview
- 19.2.1.2. Products
- 19.2.1.3. SWOT Analysis
- 19.2.1.4. Recent Developments
- 19.2.1.5. Financials (Based on Availability)
- 19.2.2 Bechtel Corporation
- 19.2.2.1. Overview
- 19.2.2.2. Products
- 19.2.2.3. SWOT Analysis
- 19.2.2.4. Recent Developments
- 19.2.2.5. Financials (Based on Availability)
- 19.2.3 Saipem SpA
- 19.2.3.1. Overview
- 19.2.3.2. Products
- 19.2.3.3. SWOT Analysis
- 19.2.3.4. Recent Developments
- 19.2.3.5. Financials (Based on Availability)
- 19.2.4 Technip FMC plc
- 19.2.4.1. Overview
- 19.2.4.2. Products
- 19.2.4.3. SWOT Analysis
- 19.2.4.4. Recent Developments
- 19.2.4.5. Financials (Based on Availability)
- 19.2.5 Chiyoda Corporation
- 19.2.5.1. Overview
- 19.2.5.2. Products
- 19.2.5.3. SWOT Analysis
- 19.2.5.4. Recent Developments
- 19.2.5.5. Financials (Based on Availability)
- 19.2.6 Fluor Corporation
- 19.2.6.1. Overview
- 19.2.6.2. Products
- 19.2.6.3. SWOT Analysis
- 19.2.6.4. Recent Developments
- 19.2.6.5. Financials (Based on Availability)
- 19.2.7 McDermott International Inc
- 19.2.7.1. Overview
- 19.2.7.2. Products
- 19.2.7.3. SWOT Analysis
- 19.2.7.4. Recent Developments
- 19.2.7.5. Financials (Based on Availability)
- 19.2.8 Chevron corporation
- 19.2.8.1. Overview
- 19.2.8.2. Products
- 19.2.8.3. SWOT Analysis
- 19.2.8.4. Recent Developments
- 19.2.8.5. Financials (Based on Availability)
- 19.2.1 JGC Holdings Corporation
List of Figures
- Figure 1: Asia Pacific LNG Infrastructure Market Revenue Breakdown (Million, %) by Product 2024 & 2032
- Figure 2: Asia Pacific LNG Infrastructure Market Share (%) by Company 2024
List of Tables
- Table 1: Asia Pacific LNG Infrastructure Market Revenue Million Forecast, by Region 2019 & 2032
- Table 2: Asia Pacific LNG Infrastructure Market Revenue Million Forecast, by Type 2019 & 2032
- Table 3: Asia Pacific LNG Infrastructure Market Revenue Million Forecast, by Geography 2019 & 2032
- Table 4: Asia Pacific LNG Infrastructure Market Revenue Million Forecast, by Region 2019 & 2032
- Table 5: Asia Pacific LNG Infrastructure Market Revenue Million Forecast, by Country 2019 & 2032
- Table 6: China Asia Pacific LNG Infrastructure Market Revenue (Million) Forecast, by Application 2019 & 2032
- Table 7: Japan Asia Pacific LNG Infrastructure Market Revenue (Million) Forecast, by Application 2019 & 2032
- Table 8: India Asia Pacific LNG Infrastructure Market Revenue (Million) Forecast, by Application 2019 & 2032
- Table 9: South Korea Asia Pacific LNG Infrastructure Market Revenue (Million) Forecast, by Application 2019 & 2032
- Table 10: Taiwan Asia Pacific LNG Infrastructure Market Revenue (Million) Forecast, by Application 2019 & 2032
- Table 11: Australia Asia Pacific LNG Infrastructure Market Revenue (Million) Forecast, by Application 2019 & 2032
- Table 12: Rest of Asia-Pacific Asia Pacific LNG Infrastructure Market Revenue (Million) Forecast, by Application 2019 & 2032
- Table 13: Asia Pacific LNG Infrastructure Market Revenue Million Forecast, by Type 2019 & 2032
- Table 14: Asia Pacific LNG Infrastructure Market Revenue Million Forecast, by Geography 2019 & 2032
- Table 15: Asia Pacific LNG Infrastructure Market Revenue Million Forecast, by Country 2019 & 2032
- Table 16: Asia Pacific LNG Infrastructure Market Revenue Million Forecast, by Type 2019 & 2032
- Table 17: Asia Pacific LNG Infrastructure Market Revenue Million Forecast, by Geography 2019 & 2032
- Table 18: Asia Pacific LNG Infrastructure Market Revenue Million Forecast, by Country 2019 & 2032
- Table 19: Asia Pacific LNG Infrastructure Market Revenue Million Forecast, by Type 2019 & 2032
- Table 20: Asia Pacific LNG Infrastructure Market Revenue Million Forecast, by Geography 2019 & 2032
- Table 21: Asia Pacific LNG Infrastructure Market Revenue Million Forecast, by Country 2019 & 2032
- Table 22: Asia Pacific LNG Infrastructure Market Revenue Million Forecast, by Type 2019 & 2032
- Table 23: Asia Pacific LNG Infrastructure Market Revenue Million Forecast, by Geography 2019 & 2032
- Table 24: Asia Pacific LNG Infrastructure Market Revenue Million Forecast, by Country 2019 & 2032
- Table 25: Asia Pacific LNG Infrastructure Market Revenue Million Forecast, by Type 2019 & 2032
- Table 26: Asia Pacific LNG Infrastructure Market Revenue Million Forecast, by Geography 2019 & 2032
- Table 27: Asia Pacific LNG Infrastructure Market Revenue Million Forecast, by Country 2019 & 2032
- Table 28: Asia Pacific LNG Infrastructure Market Revenue Million Forecast, by Type 2019 & 2032
- Table 29: Asia Pacific LNG Infrastructure Market Revenue Million Forecast, by Geography 2019 & 2032
- Table 30: Asia Pacific LNG Infrastructure Market Revenue Million Forecast, by Country 2019 & 2032
Frequently Asked Questions
1. What is the projected Compound Annual Growth Rate (CAGR) of the Asia Pacific LNG Infrastructure Market?
The projected CAGR is approximately > 6.50%.
2. Which companies are prominent players in the Asia Pacific LNG Infrastructure Market?
Key companies in the market include JGC Holdings Corporation, Bechtel Corporation, Saipem SpA, Technip FMC plc, Chiyoda Corporation, Fluor Corporation, McDermott International Inc, Chevron corporation.
3. What are the main segments of the Asia Pacific LNG Infrastructure Market?
The market segments include Type, Geography.
4. Can you provide details about the market size?
The market size is estimated to be USD XX Million as of 2022.
5. What are some drivers contributing to market growth?
4.; Growing Vehicle Ownership4.; Government Initiatives.
6. What are the notable trends driving market growth?
Regasification terminal Segment to have a Significant Share in the Market.
7. Are there any restraints impacting market growth?
4.; Volatile Crude Oil Prices.
8. Can you provide examples of recent developments in the market?
In June 2022, NOVATEK signed small-scale LNG cooperation agreements with the Moscow and Samara region's government, as part of the St. Petersburg International Economic Forum. The parties are looking to expand the use of LNG as motor fuel and for gas supply to off-grid customers, including the construction of small-scale LNG plants and relevant sales infrastructure.
9. What pricing options are available for accessing the report?
Pricing options include single-user, multi-user, and enterprise licenses priced at USD 3800, USD 4500, and USD 5800 respectively.
10. Is the market size provided in terms of value or volume?
The market size is provided in terms of value, measured in Million.
11. Are there any specific market keywords associated with the report?
Yes, the market keyword associated with the report is "Asia Pacific LNG Infrastructure Market," which aids in identifying and referencing the specific market segment covered.
12. How do I determine which pricing option suits my needs best?
The pricing options vary based on user requirements and access needs. Individual users may opt for single-user licenses, while businesses requiring broader access may choose multi-user or enterprise licenses for cost-effective access to the report.
13. Are there any additional resources or data provided in the Asia Pacific LNG Infrastructure Market report?
While the report offers comprehensive insights, it's advisable to review the specific contents or supplementary materials provided to ascertain if additional resources or data are available.
14. How can I stay updated on further developments or reports in the Asia Pacific LNG Infrastructure Market?
To stay informed about further developments, trends, and reports in the Asia Pacific LNG Infrastructure Market, consider subscribing to industry newsletters, following relevant companies and organizations, or regularly checking reputable industry news sources and publications.
Methodology
Step 1 - Identification of Relevant Samples Size from Population Database


Step 2 - Approaches for Defining Global Market Size (Value, Volume* & Price*)

Note*: In applicable scenarios
Step 3 - Data Sources
Primary Research
- Web Analytics
- Survey Reports
- Research Institute
- Latest Research Reports
- Opinion Leaders
Secondary Research
- Annual Reports
- White Paper
- Latest Press Release
- Industry Association
- Paid Database
- Investor Presentations

Step 4 - Data Triangulation
Involves using different sources of information in order to increase the validity of a study
These sources are likely to be stakeholders in a program - participants, other researchers, program staff, other community members, and so on.
Then we put all data in single framework & apply various statistical tools to find out the dynamic on the market.
During the analysis stage, feedback from the stakeholder groups would be compared to determine areas of agreement as well as areas of divergence


