
Key Insights
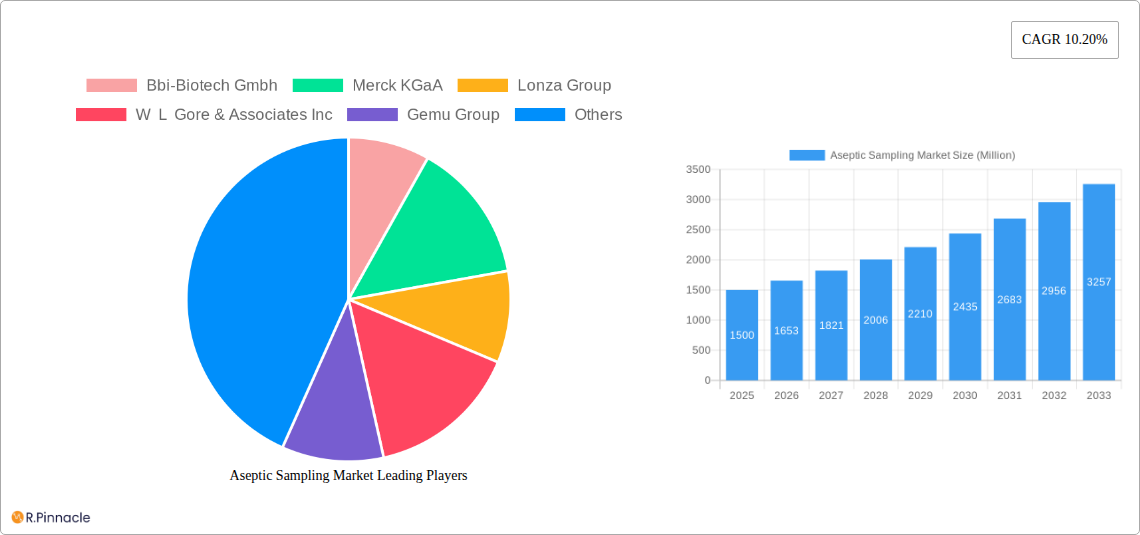
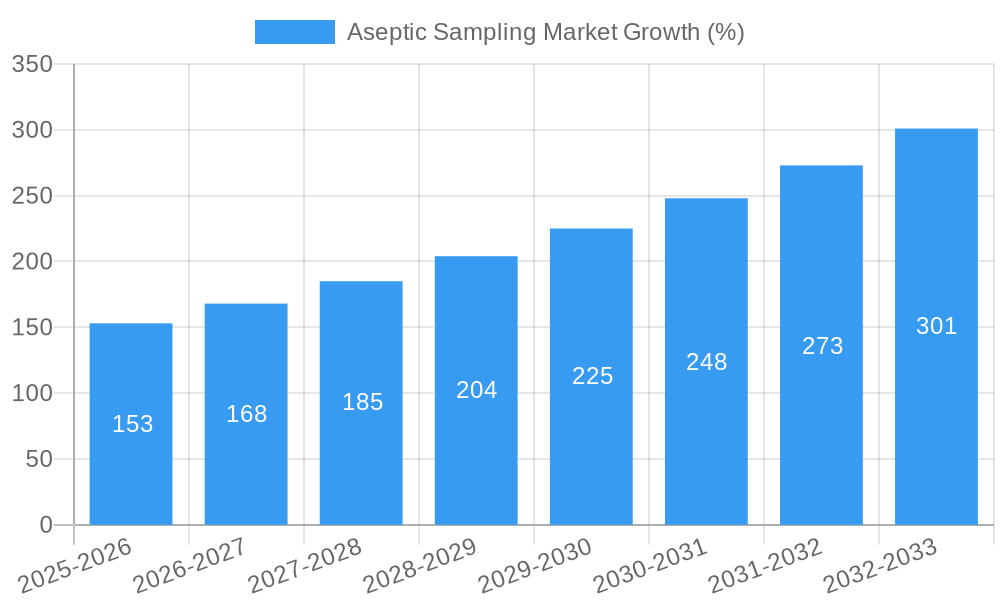
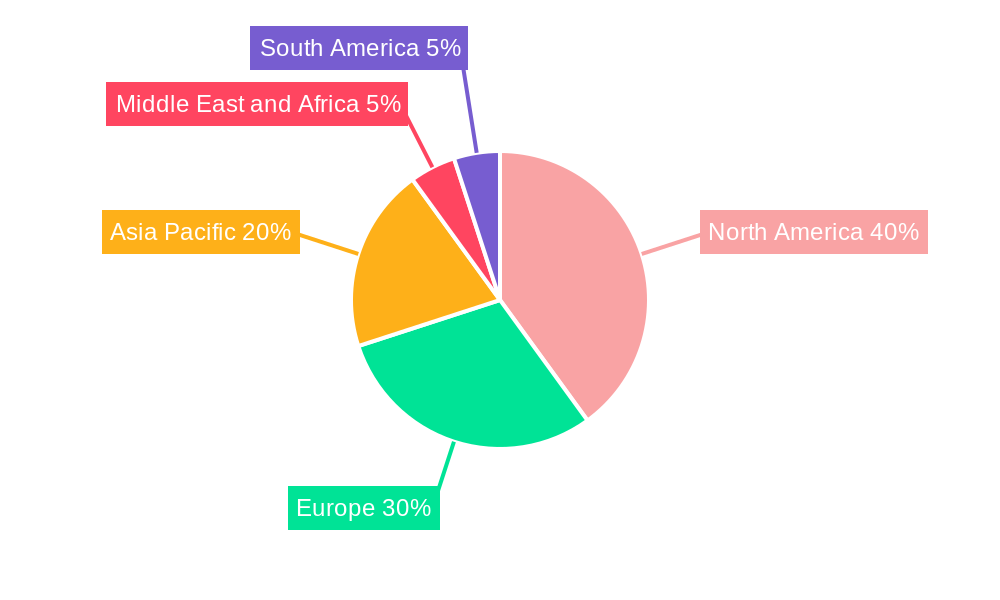
The aseptic sampling market, valued at approximately $XX million in 2025, is projected to experience robust growth, exhibiting a Compound Annual Growth Rate (CAGR) of 10.2% from 2025 to 2033. This expansion is primarily driven by the burgeoning pharmaceutical and biotechnology sectors, necessitating stringent quality control measures throughout the drug manufacturing process. Increased demand for sterile products, coupled with stringent regulatory compliance requirements, fuels the adoption of advanced aseptic sampling technologies. The market is segmented by end-user (biotechnology and pharmaceutical manufacturers, contract research organizations, others), sampling type (manual aseptic sampling, automated aseptic sampling), and application (upstream and downstream processes). Automated aseptic sampling systems are gaining traction due to their improved accuracy, reduced contamination risk, and enhanced efficiency compared to manual methods. The North American market currently holds a significant share, driven by robust R&D investments and stringent regulatory frameworks. However, Asia Pacific is poised for significant growth, fueled by expanding manufacturing capacities and rising healthcare expenditure in emerging economies like China and India. Growth is further spurred by the increasing prevalence of chronic diseases and the resulting demand for sterile injectable drugs and biologics.
Competitive landscape analysis reveals a mix of established players like Sartorius AG, Thermo Fisher Scientific, and Merck KGaA, alongside specialized providers like Qualitru Sampling Systems and Keofitt A/S. These companies are strategically focusing on product innovation, partnerships, and geographical expansion to consolidate their market positions. Restraints to market growth include the high initial investment costs associated with automated systems and the potential for technological complexities. Nevertheless, the long-term benefits of improved sterility assurance, reduced operational costs, and enhanced data management are expected to outweigh these challenges, propelling sustained market growth throughout the forecast period. The increasing adoption of single-use technologies and the demand for integrated solutions are likely to shape future market dynamics.
Aseptic Sampling Market Report: 2019-2033
This comprehensive report provides a detailed analysis of the Aseptic Sampling Market, offering actionable insights for industry professionals and stakeholders. With a focus on market structure, dynamics, and future trends, this report covers the period from 2019 to 2033, with a base year of 2025. The report projects a xx Million USD market value by 2033, exhibiting a CAGR of xx% during the forecast period (2025-2033).
Aseptic Sampling Market Structure & Innovation Trends
The Aseptic Sampling Market is characterized by a moderately concentrated landscape, with key players like Sartorius AG, Merck KGaA, Lonza Group, and Thermo Fisher Scientific holding significant market share. The exact market share for each company is unavailable but a breakdown would reveal the relative dominance of these firms. Innovation is driven by the increasing demand for automated and efficient sampling systems in the biopharmaceutical industry, coupled with stringent regulatory requirements for sterility and accuracy. Product substitutes include manual sampling techniques, but these are often less efficient and prone to contamination risks. The end-user demographics are primarily focused on biotechnology and pharmaceutical manufacturers, with a growing segment of contract research and manufacturing organizations (CRO/CMOs). Mergers and acquisitions (M&A) activities are frequent, as evidenced by recent deals such as the acquisition of TRACE Analytics GmbH by 908 Devices and the acquisition of the MAST platform by MilliporeSigma. The total value of M&A deals in the past 5 years is estimated at xx Million USD.
- Market Concentration: Moderately Concentrated
- Key Innovation Drivers: Automation, Regulatory Compliance, Efficiency Improvements
- M&A Activity: Significant, with deal values estimated at xx Million USD in the past 5 years.
Aseptic Sampling Market Dynamics & Trends
The Aseptic Sampling Market is experiencing robust growth, driven by several key factors. The rising prevalence of chronic diseases and the consequent increase in demand for biologics are significantly impacting the market's trajectory. Technological advancements, such as the development of automated aseptic sampling systems, are streamlining processes and reducing contamination risks, further fueling market expansion. The growing preference for single-use systems, designed to eliminate cross-contamination and reduce cleaning validation, is another major growth driver. Competitive dynamics are intense, with leading players investing heavily in R&D and strategic acquisitions to maintain their market positions. The market penetration of automated systems is steadily increasing, anticipated to reach xx% by 2033. The market is projected to expand at a CAGR of xx% during the forecast period.
Dominant Regions & Segments in Aseptic Sampling Market
North America currently holds the largest market share, driven by the presence of major pharmaceutical and biotechnology companies, advanced infrastructure, and favorable regulatory environments. Key factors driving growth in this region include substantial government investments in research and development, and a strong focus on innovation. Within the segment breakdown:
- By End-User: Biotechnology and pharmaceutical manufacturers constitute the largest segment, followed by CRO/CMOs. The Others segment is projected to experience substantial growth driven by increasing demand from smaller biotech firms.
- By Type of Sampling: Automated aseptic sampling is witnessing higher adoption rates due to its efficiency and reduced contamination risks, but Manual aseptic sampling still accounts for a substantial portion of the market.
- By Application: The Upstream process segment dominates due to the high volume of sampling required in bioreactor operations. However, the Downstream process is projected to see increased growth as companies move towards more efficient and advanced downstream processing techniques.
Europe and Asia Pacific are also expected to demonstrate significant growth, driven by increasing investments in the pharmaceutical and biotechnology sectors.
Aseptic Sampling Market Product Innovations
Recent product developments focus on automated, single-use systems that reduce contamination risks and improve efficiency. These systems often incorporate advanced sensors and data analytics to provide real-time monitoring and control of the sampling process. The integration of advanced technologies, such as artificial intelligence and machine learning, further enhances accuracy and precision. These innovations cater to the growing demand for faster, more efficient, and more reliable aseptic sampling solutions within the industry.
Report Scope & Segmentation Analysis
This report segments the Aseptic Sampling Market by:
- End-User: Biotechnology and Pharmaceutical Manufacturers, Contract Research and Manufacturing Organizations, Others. Each segment is analyzed in terms of market size, growth rate and competitive dynamics. The Biotechnology and Pharmaceutical Manufacturers segment is expected to hold the largest market share throughout the forecast period.
- Type of Sampling: Manual Aseptic Sampling and Automated Aseptic Sampling. Automated Aseptic Sampling is expected to demonstrate the highest growth rate due to increasing demand for higher efficiency and reduced contamination.
- Application: Upstream Process and Downstream Process. The Upstream process segment currently dominates due to the volume of sampling needed, but Downstream process sampling is expected to grow significantly.
Key Drivers of Aseptic Sampling Market Growth
Several factors contribute to the growth of the Aseptic Sampling Market:
- Technological advancements: Automation and single-use systems enhance efficiency and reduce contamination.
- Stringent regulatory requirements: These drive the adoption of advanced aseptic sampling techniques.
- Growing demand for biologics: The increasing prevalence of chronic diseases fuels the need for efficient bioprocessing.
Challenges in the Aseptic Sampling Market Sector
Challenges faced by the Aseptic Sampling Market include:
- High initial investment costs: Automated systems can be expensive, hindering adoption by smaller companies.
- Supply chain disruptions: Global events can impact the availability of critical components.
- Intense competition: Market participants are vying for market share through innovation and cost reduction strategies.
Emerging Opportunities in Aseptic Sampling Market
Emerging opportunities include:
- Development of innovative single-use systems: These are expected to gain further market share.
- Integration of advanced analytics: Real-time data monitoring will optimize sampling processes.
- Expansion into emerging markets: Growth is anticipated in regions with developing pharmaceutical industries.
Leading Players in the Aseptic Sampling Market Market
- Bbi-Biotech Gmbh
- Merck KGaA
- Lonza Group
- W L Gore & Associates Inc
- Gemu Group
- GEA Group
- Qualitru Sampling Systems
- Keofitt A/S
- Advanced Microdevices Pvt Ltd
- Sartorius AG (Sartorius Stedim Biotech)
- Saint Gobain
- Thermo Fisher Scientific
Key Developments in Aseptic Sampling Market Industry
- April 2022: MilliporeSigma acquired the MAST platform from Lonza, enhancing its automated aseptic sampling capabilities.
- August 2022: 908 Devices acquired TRACE Analytics GmbH, expanding its online analysis and sampling systems for biotech applications.
Future Outlook for Aseptic Sampling Market Market
The Aseptic Sampling Market is poised for continued growth, driven by ongoing technological advancements, increasing demand for biologics, and stringent regulatory requirements. Strategic partnerships, acquisitions, and investments in R&D will further shape market dynamics. The market’s future potential is significant, especially in the automation and single-use segments.
Aseptic Sampling Market Segmentation
-
1. Type of Sampling
- 1.1. Manual Aseptic Sampling
- 1.2. Automated Aseptic Sampling
-
2. Application
- 2.1. Upstream Process
- 2.2. Downstream Process
-
3. End-User
- 3.1. Biotechnology and Pharmaceutical Manufacturers
- 3.2. Contract Research and Manufacturing Organizations
- 3.3. Others
Aseptic Sampling Market Segmentation By Geography
-
1. North America
- 1.1. United States
- 1.2. Canada
- 1.3. Mexico
-
2. Europe
- 2.1. Germany
- 2.2. United Kingdom
- 2.3. France
- 2.4. Italy
- 2.5. Spain
- 2.6. Rest of Europe
-
3. Asia Pacific
- 3.1. China
- 3.2. Japan
- 3.3. India
- 3.4. Australia
- 3.5. South Korea
- 3.6. Rest of Asia Pacific
-
4. Middle East and Africa
- 4.1. GCC
- 4.2. South Africa
- 4.3. Rest of Middle East and Africa
-
5. South America
- 5.1. Brazil
- 5.2. Argentina
- 5.3. Rest of South America
Aseptic Sampling Market REPORT HIGHLIGHTS
| Aspects | Details |
|---|---|
| Study Period | 2019-2033 |
| Base Year | 2024 |
| Estimated Year | 2025 |
| Forecast Period | 2025-2033 |
| Historical Period | 2019-2024 |
| Growth Rate | CAGR of 10.20% from 2019-2033 |
| Segmentation |
|
Table of Contents
- 1. Introduction
- 1.1. Research Scope
- 1.2. Market Segmentation
- 1.3. Research Methodology
- 1.4. Definitions and Assumptions
- 2. Executive Summary
- 2.1. Introduction
- 3. Market Dynamics
- 3.1. Introduction
- 3.2. Market Drivers
- 3.2.1. Stringent Government Regulations for Ensuring Drug Safety; Increasing Demand for Biopharmaceuticals to Eliminate the Risk of Contamination
- 3.3. Market Restrains
- 3.3.1 Issues Related to Leachable
- 3.3.2 Extractables and Impurities During Sampling Procedure
- 3.4. Market Trends
- 3.4.1. Biotechnology and Pharmaceutical Manufacturers Segment is Expected to Have a Significant Share Over the Forecast Period
- 4. Market Factor Analysis
- 4.1. Porters Five Forces
- 4.2. Supply/Value Chain
- 4.3. PESTEL analysis
- 4.4. Market Entropy
- 4.5. Patent/Trademark Analysis
- 5. Global Aseptic Sampling Market Analysis, Insights and Forecast, 2019-2031
- 5.1. Market Analysis, Insights and Forecast - by Type of Sampling
- 5.1.1. Manual Aseptic Sampling
- 5.1.2. Automated Aseptic Sampling
- 5.2. Market Analysis, Insights and Forecast - by Application
- 5.2.1. Upstream Process
- 5.2.2. Downstream Process
- 5.3. Market Analysis, Insights and Forecast - by End-User
- 5.3.1. Biotechnology and Pharmaceutical Manufacturers
- 5.3.2. Contract Research and Manufacturing Organizations
- 5.3.3. Others
- 5.4. Market Analysis, Insights and Forecast - by Region
- 5.4.1. North America
- 5.4.2. Europe
- 5.4.3. Asia Pacific
- 5.4.4. Middle East and Africa
- 5.4.5. South America
- 5.1. Market Analysis, Insights and Forecast - by Type of Sampling
- 6. North America Aseptic Sampling Market Analysis, Insights and Forecast, 2019-2031
- 6.1. Market Analysis, Insights and Forecast - by Type of Sampling
- 6.1.1. Manual Aseptic Sampling
- 6.1.2. Automated Aseptic Sampling
- 6.2. Market Analysis, Insights and Forecast - by Application
- 6.2.1. Upstream Process
- 6.2.2. Downstream Process
- 6.3. Market Analysis, Insights and Forecast - by End-User
- 6.3.1. Biotechnology and Pharmaceutical Manufacturers
- 6.3.2. Contract Research and Manufacturing Organizations
- 6.3.3. Others
- 6.1. Market Analysis, Insights and Forecast - by Type of Sampling
- 7. Europe Aseptic Sampling Market Analysis, Insights and Forecast, 2019-2031
- 7.1. Market Analysis, Insights and Forecast - by Type of Sampling
- 7.1.1. Manual Aseptic Sampling
- 7.1.2. Automated Aseptic Sampling
- 7.2. Market Analysis, Insights and Forecast - by Application
- 7.2.1. Upstream Process
- 7.2.2. Downstream Process
- 7.3. Market Analysis, Insights and Forecast - by End-User
- 7.3.1. Biotechnology and Pharmaceutical Manufacturers
- 7.3.2. Contract Research and Manufacturing Organizations
- 7.3.3. Others
- 7.1. Market Analysis, Insights and Forecast - by Type of Sampling
- 8. Asia Pacific Aseptic Sampling Market Analysis, Insights and Forecast, 2019-2031
- 8.1. Market Analysis, Insights and Forecast - by Type of Sampling
- 8.1.1. Manual Aseptic Sampling
- 8.1.2. Automated Aseptic Sampling
- 8.2. Market Analysis, Insights and Forecast - by Application
- 8.2.1. Upstream Process
- 8.2.2. Downstream Process
- 8.3. Market Analysis, Insights and Forecast - by End-User
- 8.3.1. Biotechnology and Pharmaceutical Manufacturers
- 8.3.2. Contract Research and Manufacturing Organizations
- 8.3.3. Others
- 8.1. Market Analysis, Insights and Forecast - by Type of Sampling
- 9. Middle East and Africa Aseptic Sampling Market Analysis, Insights and Forecast, 2019-2031
- 9.1. Market Analysis, Insights and Forecast - by Type of Sampling
- 9.1.1. Manual Aseptic Sampling
- 9.1.2. Automated Aseptic Sampling
- 9.2. Market Analysis, Insights and Forecast - by Application
- 9.2.1. Upstream Process
- 9.2.2. Downstream Process
- 9.3. Market Analysis, Insights and Forecast - by End-User
- 9.3.1. Biotechnology and Pharmaceutical Manufacturers
- 9.3.2. Contract Research and Manufacturing Organizations
- 9.3.3. Others
- 9.1. Market Analysis, Insights and Forecast - by Type of Sampling
- 10. South America Aseptic Sampling Market Analysis, Insights and Forecast, 2019-2031
- 10.1. Market Analysis, Insights and Forecast - by Type of Sampling
- 10.1.1. Manual Aseptic Sampling
- 10.1.2. Automated Aseptic Sampling
- 10.2. Market Analysis, Insights and Forecast - by Application
- 10.2.1. Upstream Process
- 10.2.2. Downstream Process
- 10.3. Market Analysis, Insights and Forecast - by End-User
- 10.3.1. Biotechnology and Pharmaceutical Manufacturers
- 10.3.2. Contract Research and Manufacturing Organizations
- 10.3.3. Others
- 10.1. Market Analysis, Insights and Forecast - by Type of Sampling
- 11. North America Aseptic Sampling Market Analysis, Insights and Forecast, 2019-2031
- 11.1. Market Analysis, Insights and Forecast - By Country/Sub-region
- 11.1.1 United States
- 11.1.2 Canada
- 11.1.3 Mexico
- 12. Europe Aseptic Sampling Market Analysis, Insights and Forecast, 2019-2031
- 12.1. Market Analysis, Insights and Forecast - By Country/Sub-region
- 12.1.1 Germany
- 12.1.2 United Kingdom
- 12.1.3 France
- 12.1.4 Italy
- 12.1.5 Spain
- 12.1.6 Rest of Europe
- 13. Asia Pacific Aseptic Sampling Market Analysis, Insights and Forecast, 2019-2031
- 13.1. Market Analysis, Insights and Forecast - By Country/Sub-region
- 13.1.1 China
- 13.1.2 Japan
- 13.1.3 India
- 13.1.4 Australia
- 13.1.5 South Korea
- 13.1.6 Rest of Asia Pacific
- 14. Middle East and Africa Aseptic Sampling Market Analysis, Insights and Forecast, 2019-2031
- 14.1. Market Analysis, Insights and Forecast - By Country/Sub-region
- 14.1.1 GCC
- 14.1.2 South Africa
- 14.1.3 Rest of Middle East and Africa
- 15. South America Aseptic Sampling Market Analysis, Insights and Forecast, 2019-2031
- 15.1. Market Analysis, Insights and Forecast - By Country/Sub-region
- 15.1.1 Brazil
- 15.1.2 Argentina
- 15.1.3 Rest of South America
- 16. Competitive Analysis
- 16.1. Global Market Share Analysis 2024
- 16.2. Company Profiles
- 16.2.1 Bbi-Biotech Gmbh
- 16.2.1.1. Overview
- 16.2.1.2. Products
- 16.2.1.3. SWOT Analysis
- 16.2.1.4. Recent Developments
- 16.2.1.5. Financials (Based on Availability)
- 16.2.2 Merck KGaA
- 16.2.2.1. Overview
- 16.2.2.2. Products
- 16.2.2.3. SWOT Analysis
- 16.2.2.4. Recent Developments
- 16.2.2.5. Financials (Based on Availability)
- 16.2.3 Lonza Group
- 16.2.3.1. Overview
- 16.2.3.2. Products
- 16.2.3.3. SWOT Analysis
- 16.2.3.4. Recent Developments
- 16.2.3.5. Financials (Based on Availability)
- 16.2.4 W L Gore & Associates Inc
- 16.2.4.1. Overview
- 16.2.4.2. Products
- 16.2.4.3. SWOT Analysis
- 16.2.4.4. Recent Developments
- 16.2.4.5. Financials (Based on Availability)
- 16.2.5 Gemu Group
- 16.2.5.1. Overview
- 16.2.5.2. Products
- 16.2.5.3. SWOT Analysis
- 16.2.5.4. Recent Developments
- 16.2.5.5. Financials (Based on Availability)
- 16.2.6 GEA Group
- 16.2.6.1. Overview
- 16.2.6.2. Products
- 16.2.6.3. SWOT Analysis
- 16.2.6.4. Recent Developments
- 16.2.6.5. Financials (Based on Availability)
- 16.2.7 Qualitru Sampling Systems
- 16.2.7.1. Overview
- 16.2.7.2. Products
- 16.2.7.3. SWOT Analysis
- 16.2.7.4. Recent Developments
- 16.2.7.5. Financials (Based on Availability)
- 16.2.8 Keofitt A/S
- 16.2.8.1. Overview
- 16.2.8.2. Products
- 16.2.8.3. SWOT Analysis
- 16.2.8.4. Recent Developments
- 16.2.8.5. Financials (Based on Availability)
- 16.2.9 Advanced Microdevices Pvt Ltd
- 16.2.9.1. Overview
- 16.2.9.2. Products
- 16.2.9.3. SWOT Analysis
- 16.2.9.4. Recent Developments
- 16.2.9.5. Financials (Based on Availability)
- 16.2.10 Sartorius AG (Sartorius Stedim Biotech)
- 16.2.10.1. Overview
- 16.2.10.2. Products
- 16.2.10.3. SWOT Analysis
- 16.2.10.4. Recent Developments
- 16.2.10.5. Financials (Based on Availability)
- 16.2.11 Saint Gobain
- 16.2.11.1. Overview
- 16.2.11.2. Products
- 16.2.11.3. SWOT Analysis
- 16.2.11.4. Recent Developments
- 16.2.11.5. Financials (Based on Availability)
- 16.2.12 Thermo Fisher Scientific
- 16.2.12.1. Overview
- 16.2.12.2. Products
- 16.2.12.3. SWOT Analysis
- 16.2.12.4. Recent Developments
- 16.2.12.5. Financials (Based on Availability)
- 16.2.1 Bbi-Biotech Gmbh
List of Figures
- Figure 1: Global Aseptic Sampling Market Revenue Breakdown (Million, %) by Region 2024 & 2032
- Figure 2: Global Aseptic Sampling Market Volume Breakdown (K Unit, %) by Region 2024 & 2032
- Figure 3: North America Aseptic Sampling Market Revenue (Million), by Country 2024 & 2032
- Figure 4: North America Aseptic Sampling Market Volume (K Unit), by Country 2024 & 2032
- Figure 5: North America Aseptic Sampling Market Revenue Share (%), by Country 2024 & 2032
- Figure 6: North America Aseptic Sampling Market Volume Share (%), by Country 2024 & 2032
- Figure 7: Europe Aseptic Sampling Market Revenue (Million), by Country 2024 & 2032
- Figure 8: Europe Aseptic Sampling Market Volume (K Unit), by Country 2024 & 2032
- Figure 9: Europe Aseptic Sampling Market Revenue Share (%), by Country 2024 & 2032
- Figure 10: Europe Aseptic Sampling Market Volume Share (%), by Country 2024 & 2032
- Figure 11: Asia Pacific Aseptic Sampling Market Revenue (Million), by Country 2024 & 2032
- Figure 12: Asia Pacific Aseptic Sampling Market Volume (K Unit), by Country 2024 & 2032
- Figure 13: Asia Pacific Aseptic Sampling Market Revenue Share (%), by Country 2024 & 2032
- Figure 14: Asia Pacific Aseptic Sampling Market Volume Share (%), by Country 2024 & 2032
- Figure 15: Middle East and Africa Aseptic Sampling Market Revenue (Million), by Country 2024 & 2032
- Figure 16: Middle East and Africa Aseptic Sampling Market Volume (K Unit), by Country 2024 & 2032
- Figure 17: Middle East and Africa Aseptic Sampling Market Revenue Share (%), by Country 2024 & 2032
- Figure 18: Middle East and Africa Aseptic Sampling Market Volume Share (%), by Country 2024 & 2032
- Figure 19: South America Aseptic Sampling Market Revenue (Million), by Country 2024 & 2032
- Figure 20: South America Aseptic Sampling Market Volume (K Unit), by Country 2024 & 2032
- Figure 21: South America Aseptic Sampling Market Revenue Share (%), by Country 2024 & 2032
- Figure 22: South America Aseptic Sampling Market Volume Share (%), by Country 2024 & 2032
- Figure 23: North America Aseptic Sampling Market Revenue (Million), by Type of Sampling 2024 & 2032
- Figure 24: North America Aseptic Sampling Market Volume (K Unit), by Type of Sampling 2024 & 2032
- Figure 25: North America Aseptic Sampling Market Revenue Share (%), by Type of Sampling 2024 & 2032
- Figure 26: North America Aseptic Sampling Market Volume Share (%), by Type of Sampling 2024 & 2032
- Figure 27: North America Aseptic Sampling Market Revenue (Million), by Application 2024 & 2032
- Figure 28: North America Aseptic Sampling Market Volume (K Unit), by Application 2024 & 2032
- Figure 29: North America Aseptic Sampling Market Revenue Share (%), by Application 2024 & 2032
- Figure 30: North America Aseptic Sampling Market Volume Share (%), by Application 2024 & 2032
- Figure 31: North America Aseptic Sampling Market Revenue (Million), by End-User 2024 & 2032
- Figure 32: North America Aseptic Sampling Market Volume (K Unit), by End-User 2024 & 2032
- Figure 33: North America Aseptic Sampling Market Revenue Share (%), by End-User 2024 & 2032
- Figure 34: North America Aseptic Sampling Market Volume Share (%), by End-User 2024 & 2032
- Figure 35: North America Aseptic Sampling Market Revenue (Million), by Country 2024 & 2032
- Figure 36: North America Aseptic Sampling Market Volume (K Unit), by Country 2024 & 2032
- Figure 37: North America Aseptic Sampling Market Revenue Share (%), by Country 2024 & 2032
- Figure 38: North America Aseptic Sampling Market Volume Share (%), by Country 2024 & 2032
- Figure 39: Europe Aseptic Sampling Market Revenue (Million), by Type of Sampling 2024 & 2032
- Figure 40: Europe Aseptic Sampling Market Volume (K Unit), by Type of Sampling 2024 & 2032
- Figure 41: Europe Aseptic Sampling Market Revenue Share (%), by Type of Sampling 2024 & 2032
- Figure 42: Europe Aseptic Sampling Market Volume Share (%), by Type of Sampling 2024 & 2032
- Figure 43: Europe Aseptic Sampling Market Revenue (Million), by Application 2024 & 2032
- Figure 44: Europe Aseptic Sampling Market Volume (K Unit), by Application 2024 & 2032
- Figure 45: Europe Aseptic Sampling Market Revenue Share (%), by Application 2024 & 2032
- Figure 46: Europe Aseptic Sampling Market Volume Share (%), by Application 2024 & 2032
- Figure 47: Europe Aseptic Sampling Market Revenue (Million), by End-User 2024 & 2032
- Figure 48: Europe Aseptic Sampling Market Volume (K Unit), by End-User 2024 & 2032
- Figure 49: Europe Aseptic Sampling Market Revenue Share (%), by End-User 2024 & 2032
- Figure 50: Europe Aseptic Sampling Market Volume Share (%), by End-User 2024 & 2032
- Figure 51: Europe Aseptic Sampling Market Revenue (Million), by Country 2024 & 2032
- Figure 52: Europe Aseptic Sampling Market Volume (K Unit), by Country 2024 & 2032
- Figure 53: Europe Aseptic Sampling Market Revenue Share (%), by Country 2024 & 2032
- Figure 54: Europe Aseptic Sampling Market Volume Share (%), by Country 2024 & 2032
- Figure 55: Asia Pacific Aseptic Sampling Market Revenue (Million), by Type of Sampling 2024 & 2032
- Figure 56: Asia Pacific Aseptic Sampling Market Volume (K Unit), by Type of Sampling 2024 & 2032
- Figure 57: Asia Pacific Aseptic Sampling Market Revenue Share (%), by Type of Sampling 2024 & 2032
- Figure 58: Asia Pacific Aseptic Sampling Market Volume Share (%), by Type of Sampling 2024 & 2032
- Figure 59: Asia Pacific Aseptic Sampling Market Revenue (Million), by Application 2024 & 2032
- Figure 60: Asia Pacific Aseptic Sampling Market Volume (K Unit), by Application 2024 & 2032
- Figure 61: Asia Pacific Aseptic Sampling Market Revenue Share (%), by Application 2024 & 2032
- Figure 62: Asia Pacific Aseptic Sampling Market Volume Share (%), by Application 2024 & 2032
- Figure 63: Asia Pacific Aseptic Sampling Market Revenue (Million), by End-User 2024 & 2032
- Figure 64: Asia Pacific Aseptic Sampling Market Volume (K Unit), by End-User 2024 & 2032
- Figure 65: Asia Pacific Aseptic Sampling Market Revenue Share (%), by End-User 2024 & 2032
- Figure 66: Asia Pacific Aseptic Sampling Market Volume Share (%), by End-User 2024 & 2032
- Figure 67: Asia Pacific Aseptic Sampling Market Revenue (Million), by Country 2024 & 2032
- Figure 68: Asia Pacific Aseptic Sampling Market Volume (K Unit), by Country 2024 & 2032
- Figure 69: Asia Pacific Aseptic Sampling Market Revenue Share (%), by Country 2024 & 2032
- Figure 70: Asia Pacific Aseptic Sampling Market Volume Share (%), by Country 2024 & 2032
- Figure 71: Middle East and Africa Aseptic Sampling Market Revenue (Million), by Type of Sampling 2024 & 2032
- Figure 72: Middle East and Africa Aseptic Sampling Market Volume (K Unit), by Type of Sampling 2024 & 2032
- Figure 73: Middle East and Africa Aseptic Sampling Market Revenue Share (%), by Type of Sampling 2024 & 2032
- Figure 74: Middle East and Africa Aseptic Sampling Market Volume Share (%), by Type of Sampling 2024 & 2032
- Figure 75: Middle East and Africa Aseptic Sampling Market Revenue (Million), by Application 2024 & 2032
- Figure 76: Middle East and Africa Aseptic Sampling Market Volume (K Unit), by Application 2024 & 2032
- Figure 77: Middle East and Africa Aseptic Sampling Market Revenue Share (%), by Application 2024 & 2032
- Figure 78: Middle East and Africa Aseptic Sampling Market Volume Share (%), by Application 2024 & 2032
- Figure 79: Middle East and Africa Aseptic Sampling Market Revenue (Million), by End-User 2024 & 2032
- Figure 80: Middle East and Africa Aseptic Sampling Market Volume (K Unit), by End-User 2024 & 2032
- Figure 81: Middle East and Africa Aseptic Sampling Market Revenue Share (%), by End-User 2024 & 2032
- Figure 82: Middle East and Africa Aseptic Sampling Market Volume Share (%), by End-User 2024 & 2032
- Figure 83: Middle East and Africa Aseptic Sampling Market Revenue (Million), by Country 2024 & 2032
- Figure 84: Middle East and Africa Aseptic Sampling Market Volume (K Unit), by Country 2024 & 2032
- Figure 85: Middle East and Africa Aseptic Sampling Market Revenue Share (%), by Country 2024 & 2032
- Figure 86: Middle East and Africa Aseptic Sampling Market Volume Share (%), by Country 2024 & 2032
- Figure 87: South America Aseptic Sampling Market Revenue (Million), by Type of Sampling 2024 & 2032
- Figure 88: South America Aseptic Sampling Market Volume (K Unit), by Type of Sampling 2024 & 2032
- Figure 89: South America Aseptic Sampling Market Revenue Share (%), by Type of Sampling 2024 & 2032
- Figure 90: South America Aseptic Sampling Market Volume Share (%), by Type of Sampling 2024 & 2032
- Figure 91: South America Aseptic Sampling Market Revenue (Million), by Application 2024 & 2032
- Figure 92: South America Aseptic Sampling Market Volume (K Unit), by Application 2024 & 2032
- Figure 93: South America Aseptic Sampling Market Revenue Share (%), by Application 2024 & 2032
- Figure 94: South America Aseptic Sampling Market Volume Share (%), by Application 2024 & 2032
- Figure 95: South America Aseptic Sampling Market Revenue (Million), by End-User 2024 & 2032
- Figure 96: South America Aseptic Sampling Market Volume (K Unit), by End-User 2024 & 2032
- Figure 97: South America Aseptic Sampling Market Revenue Share (%), by End-User 2024 & 2032
- Figure 98: South America Aseptic Sampling Market Volume Share (%), by End-User 2024 & 2032
- Figure 99: South America Aseptic Sampling Market Revenue (Million), by Country 2024 & 2032
- Figure 100: South America Aseptic Sampling Market Volume (K Unit), by Country 2024 & 2032
- Figure 101: South America Aseptic Sampling Market Revenue Share (%), by Country 2024 & 2032
- Figure 102: South America Aseptic Sampling Market Volume Share (%), by Country 2024 & 2032
List of Tables
- Table 1: Global Aseptic Sampling Market Revenue Million Forecast, by Region 2019 & 2032
- Table 2: Global Aseptic Sampling Market Volume K Unit Forecast, by Region 2019 & 2032
- Table 3: Global Aseptic Sampling Market Revenue Million Forecast, by Type of Sampling 2019 & 2032
- Table 4: Global Aseptic Sampling Market Volume K Unit Forecast, by Type of Sampling 2019 & 2032
- Table 5: Global Aseptic Sampling Market Revenue Million Forecast, by Application 2019 & 2032
- Table 6: Global Aseptic Sampling Market Volume K Unit Forecast, by Application 2019 & 2032
- Table 7: Global Aseptic Sampling Market Revenue Million Forecast, by End-User 2019 & 2032
- Table 8: Global Aseptic Sampling Market Volume K Unit Forecast, by End-User 2019 & 2032
- Table 9: Global Aseptic Sampling Market Revenue Million Forecast, by Region 2019 & 2032
- Table 10: Global Aseptic Sampling Market Volume K Unit Forecast, by Region 2019 & 2032
- Table 11: Global Aseptic Sampling Market Revenue Million Forecast, by Country 2019 & 2032
- Table 12: Global Aseptic Sampling Market Volume K Unit Forecast, by Country 2019 & 2032
- Table 13: United States Aseptic Sampling Market Revenue (Million) Forecast, by Application 2019 & 2032
- Table 14: United States Aseptic Sampling Market Volume (K Unit) Forecast, by Application 2019 & 2032
- Table 15: Canada Aseptic Sampling Market Revenue (Million) Forecast, by Application 2019 & 2032
- Table 16: Canada Aseptic Sampling Market Volume (K Unit) Forecast, by Application 2019 & 2032
- Table 17: Mexico Aseptic Sampling Market Revenue (Million) Forecast, by Application 2019 & 2032
- Table 18: Mexico Aseptic Sampling Market Volume (K Unit) Forecast, by Application 2019 & 2032
- Table 19: Global Aseptic Sampling Market Revenue Million Forecast, by Country 2019 & 2032
- Table 20: Global Aseptic Sampling Market Volume K Unit Forecast, by Country 2019 & 2032
- Table 21: Germany Aseptic Sampling Market Revenue (Million) Forecast, by Application 2019 & 2032
- Table 22: Germany Aseptic Sampling Market Volume (K Unit) Forecast, by Application 2019 & 2032
- Table 23: United Kingdom Aseptic Sampling Market Revenue (Million) Forecast, by Application 2019 & 2032
- Table 24: United Kingdom Aseptic Sampling Market Volume (K Unit) Forecast, by Application 2019 & 2032
- Table 25: France Aseptic Sampling Market Revenue (Million) Forecast, by Application 2019 & 2032
- Table 26: France Aseptic Sampling Market Volume (K Unit) Forecast, by Application 2019 & 2032
- Table 27: Italy Aseptic Sampling Market Revenue (Million) Forecast, by Application 2019 & 2032
- Table 28: Italy Aseptic Sampling Market Volume (K Unit) Forecast, by Application 2019 & 2032
- Table 29: Spain Aseptic Sampling Market Revenue (Million) Forecast, by Application 2019 & 2032
- Table 30: Spain Aseptic Sampling Market Volume (K Unit) Forecast, by Application 2019 & 2032
- Table 31: Rest of Europe Aseptic Sampling Market Revenue (Million) Forecast, by Application 2019 & 2032
- Table 32: Rest of Europe Aseptic Sampling Market Volume (K Unit) Forecast, by Application 2019 & 2032
- Table 33: Global Aseptic Sampling Market Revenue Million Forecast, by Country 2019 & 2032
- Table 34: Global Aseptic Sampling Market Volume K Unit Forecast, by Country 2019 & 2032
- Table 35: China Aseptic Sampling Market Revenue (Million) Forecast, by Application 2019 & 2032
- Table 36: China Aseptic Sampling Market Volume (K Unit) Forecast, by Application 2019 & 2032
- Table 37: Japan Aseptic Sampling Market Revenue (Million) Forecast, by Application 2019 & 2032
- Table 38: Japan Aseptic Sampling Market Volume (K Unit) Forecast, by Application 2019 & 2032
- Table 39: India Aseptic Sampling Market Revenue (Million) Forecast, by Application 2019 & 2032
- Table 40: India Aseptic Sampling Market Volume (K Unit) Forecast, by Application 2019 & 2032
- Table 41: Australia Aseptic Sampling Market Revenue (Million) Forecast, by Application 2019 & 2032
- Table 42: Australia Aseptic Sampling Market Volume (K Unit) Forecast, by Application 2019 & 2032
- Table 43: South Korea Aseptic Sampling Market Revenue (Million) Forecast, by Application 2019 & 2032
- Table 44: South Korea Aseptic Sampling Market Volume (K Unit) Forecast, by Application 2019 & 2032
- Table 45: Rest of Asia Pacific Aseptic Sampling Market Revenue (Million) Forecast, by Application 2019 & 2032
- Table 46: Rest of Asia Pacific Aseptic Sampling Market Volume (K Unit) Forecast, by Application 2019 & 2032
- Table 47: Global Aseptic Sampling Market Revenue Million Forecast, by Country 2019 & 2032
- Table 48: Global Aseptic Sampling Market Volume K Unit Forecast, by Country 2019 & 2032
- Table 49: GCC Aseptic Sampling Market Revenue (Million) Forecast, by Application 2019 & 2032
- Table 50: GCC Aseptic Sampling Market Volume (K Unit) Forecast, by Application 2019 & 2032
- Table 51: South Africa Aseptic Sampling Market Revenue (Million) Forecast, by Application 2019 & 2032
- Table 52: South Africa Aseptic Sampling Market Volume (K Unit) Forecast, by Application 2019 & 2032
- Table 53: Rest of Middle East and Africa Aseptic Sampling Market Revenue (Million) Forecast, by Application 2019 & 2032
- Table 54: Rest of Middle East and Africa Aseptic Sampling Market Volume (K Unit) Forecast, by Application 2019 & 2032
- Table 55: Global Aseptic Sampling Market Revenue Million Forecast, by Country 2019 & 2032
- Table 56: Global Aseptic Sampling Market Volume K Unit Forecast, by Country 2019 & 2032
- Table 57: Brazil Aseptic Sampling Market Revenue (Million) Forecast, by Application 2019 & 2032
- Table 58: Brazil Aseptic Sampling Market Volume (K Unit) Forecast, by Application 2019 & 2032
- Table 59: Argentina Aseptic Sampling Market Revenue (Million) Forecast, by Application 2019 & 2032
- Table 60: Argentina Aseptic Sampling Market Volume (K Unit) Forecast, by Application 2019 & 2032
- Table 61: Rest of South America Aseptic Sampling Market Revenue (Million) Forecast, by Application 2019 & 2032
- Table 62: Rest of South America Aseptic Sampling Market Volume (K Unit) Forecast, by Application 2019 & 2032
- Table 63: Global Aseptic Sampling Market Revenue Million Forecast, by Type of Sampling 2019 & 2032
- Table 64: Global Aseptic Sampling Market Volume K Unit Forecast, by Type of Sampling 2019 & 2032
- Table 65: Global Aseptic Sampling Market Revenue Million Forecast, by Application 2019 & 2032
- Table 66: Global Aseptic Sampling Market Volume K Unit Forecast, by Application 2019 & 2032
- Table 67: Global Aseptic Sampling Market Revenue Million Forecast, by End-User 2019 & 2032
- Table 68: Global Aseptic Sampling Market Volume K Unit Forecast, by End-User 2019 & 2032
- Table 69: Global Aseptic Sampling Market Revenue Million Forecast, by Country 2019 & 2032
- Table 70: Global Aseptic Sampling Market Volume K Unit Forecast, by Country 2019 & 2032
- Table 71: United States Aseptic Sampling Market Revenue (Million) Forecast, by Application 2019 & 2032
- Table 72: United States Aseptic Sampling Market Volume (K Unit) Forecast, by Application 2019 & 2032
- Table 73: Canada Aseptic Sampling Market Revenue (Million) Forecast, by Application 2019 & 2032
- Table 74: Canada Aseptic Sampling Market Volume (K Unit) Forecast, by Application 2019 & 2032
- Table 75: Mexico Aseptic Sampling Market Revenue (Million) Forecast, by Application 2019 & 2032
- Table 76: Mexico Aseptic Sampling Market Volume (K Unit) Forecast, by Application 2019 & 2032
- Table 77: Global Aseptic Sampling Market Revenue Million Forecast, by Type of Sampling 2019 & 2032
- Table 78: Global Aseptic Sampling Market Volume K Unit Forecast, by Type of Sampling 2019 & 2032
- Table 79: Global Aseptic Sampling Market Revenue Million Forecast, by Application 2019 & 2032
- Table 80: Global Aseptic Sampling Market Volume K Unit Forecast, by Application 2019 & 2032
- Table 81: Global Aseptic Sampling Market Revenue Million Forecast, by End-User 2019 & 2032
- Table 82: Global Aseptic Sampling Market Volume K Unit Forecast, by End-User 2019 & 2032
- Table 83: Global Aseptic Sampling Market Revenue Million Forecast, by Country 2019 & 2032
- Table 84: Global Aseptic Sampling Market Volume K Unit Forecast, by Country 2019 & 2032
- Table 85: Germany Aseptic Sampling Market Revenue (Million) Forecast, by Application 2019 & 2032
- Table 86: Germany Aseptic Sampling Market Volume (K Unit) Forecast, by Application 2019 & 2032
- Table 87: United Kingdom Aseptic Sampling Market Revenue (Million) Forecast, by Application 2019 & 2032
- Table 88: United Kingdom Aseptic Sampling Market Volume (K Unit) Forecast, by Application 2019 & 2032
- Table 89: France Aseptic Sampling Market Revenue (Million) Forecast, by Application 2019 & 2032
- Table 90: France Aseptic Sampling Market Volume (K Unit) Forecast, by Application 2019 & 2032
- Table 91: Italy Aseptic Sampling Market Revenue (Million) Forecast, by Application 2019 & 2032
- Table 92: Italy Aseptic Sampling Market Volume (K Unit) Forecast, by Application 2019 & 2032
- Table 93: Spain Aseptic Sampling Market Revenue (Million) Forecast, by Application 2019 & 2032
- Table 94: Spain Aseptic Sampling Market Volume (K Unit) Forecast, by Application 2019 & 2032
- Table 95: Rest of Europe Aseptic Sampling Market Revenue (Million) Forecast, by Application 2019 & 2032
- Table 96: Rest of Europe Aseptic Sampling Market Volume (K Unit) Forecast, by Application 2019 & 2032
- Table 97: Global Aseptic Sampling Market Revenue Million Forecast, by Type of Sampling 2019 & 2032
- Table 98: Global Aseptic Sampling Market Volume K Unit Forecast, by Type of Sampling 2019 & 2032
- Table 99: Global Aseptic Sampling Market Revenue Million Forecast, by Application 2019 & 2032
- Table 100: Global Aseptic Sampling Market Volume K Unit Forecast, by Application 2019 & 2032
- Table 101: Global Aseptic Sampling Market Revenue Million Forecast, by End-User 2019 & 2032
- Table 102: Global Aseptic Sampling Market Volume K Unit Forecast, by End-User 2019 & 2032
- Table 103: Global Aseptic Sampling Market Revenue Million Forecast, by Country 2019 & 2032
- Table 104: Global Aseptic Sampling Market Volume K Unit Forecast, by Country 2019 & 2032
- Table 105: China Aseptic Sampling Market Revenue (Million) Forecast, by Application 2019 & 2032
- Table 106: China Aseptic Sampling Market Volume (K Unit) Forecast, by Application 2019 & 2032
- Table 107: Japan Aseptic Sampling Market Revenue (Million) Forecast, by Application 2019 & 2032
- Table 108: Japan Aseptic Sampling Market Volume (K Unit) Forecast, by Application 2019 & 2032
- Table 109: India Aseptic Sampling Market Revenue (Million) Forecast, by Application 2019 & 2032
- Table 110: India Aseptic Sampling Market Volume (K Unit) Forecast, by Application 2019 & 2032
- Table 111: Australia Aseptic Sampling Market Revenue (Million) Forecast, by Application 2019 & 2032
- Table 112: Australia Aseptic Sampling Market Volume (K Unit) Forecast, by Application 2019 & 2032
- Table 113: South Korea Aseptic Sampling Market Revenue (Million) Forecast, by Application 2019 & 2032
- Table 114: South Korea Aseptic Sampling Market Volume (K Unit) Forecast, by Application 2019 & 2032
- Table 115: Rest of Asia Pacific Aseptic Sampling Market Revenue (Million) Forecast, by Application 2019 & 2032
- Table 116: Rest of Asia Pacific Aseptic Sampling Market Volume (K Unit) Forecast, by Application 2019 & 2032
- Table 117: Global Aseptic Sampling Market Revenue Million Forecast, by Type of Sampling 2019 & 2032
- Table 118: Global Aseptic Sampling Market Volume K Unit Forecast, by Type of Sampling 2019 & 2032
- Table 119: Global Aseptic Sampling Market Revenue Million Forecast, by Application 2019 & 2032
- Table 120: Global Aseptic Sampling Market Volume K Unit Forecast, by Application 2019 & 2032
- Table 121: Global Aseptic Sampling Market Revenue Million Forecast, by End-User 2019 & 2032
- Table 122: Global Aseptic Sampling Market Volume K Unit Forecast, by End-User 2019 & 2032
- Table 123: Global Aseptic Sampling Market Revenue Million Forecast, by Country 2019 & 2032
- Table 124: Global Aseptic Sampling Market Volume K Unit Forecast, by Country 2019 & 2032
- Table 125: GCC Aseptic Sampling Market Revenue (Million) Forecast, by Application 2019 & 2032
- Table 126: GCC Aseptic Sampling Market Volume (K Unit) Forecast, by Application 2019 & 2032
- Table 127: South Africa Aseptic Sampling Market Revenue (Million) Forecast, by Application 2019 & 2032
- Table 128: South Africa Aseptic Sampling Market Volume (K Unit) Forecast, by Application 2019 & 2032
- Table 129: Rest of Middle East and Africa Aseptic Sampling Market Revenue (Million) Forecast, by Application 2019 & 2032
- Table 130: Rest of Middle East and Africa Aseptic Sampling Market Volume (K Unit) Forecast, by Application 2019 & 2032
- Table 131: Global Aseptic Sampling Market Revenue Million Forecast, by Type of Sampling 2019 & 2032
- Table 132: Global Aseptic Sampling Market Volume K Unit Forecast, by Type of Sampling 2019 & 2032
- Table 133: Global Aseptic Sampling Market Revenue Million Forecast, by Application 2019 & 2032
- Table 134: Global Aseptic Sampling Market Volume K Unit Forecast, by Application 2019 & 2032
- Table 135: Global Aseptic Sampling Market Revenue Million Forecast, by End-User 2019 & 2032
- Table 136: Global Aseptic Sampling Market Volume K Unit Forecast, by End-User 2019 & 2032
- Table 137: Global Aseptic Sampling Market Revenue Million Forecast, by Country 2019 & 2032
- Table 138: Global Aseptic Sampling Market Volume K Unit Forecast, by Country 2019 & 2032
- Table 139: Brazil Aseptic Sampling Market Revenue (Million) Forecast, by Application 2019 & 2032
- Table 140: Brazil Aseptic Sampling Market Volume (K Unit) Forecast, by Application 2019 & 2032
- Table 141: Argentina Aseptic Sampling Market Revenue (Million) Forecast, by Application 2019 & 2032
- Table 142: Argentina Aseptic Sampling Market Volume (K Unit) Forecast, by Application 2019 & 2032
- Table 143: Rest of South America Aseptic Sampling Market Revenue (Million) Forecast, by Application 2019 & 2032
- Table 144: Rest of South America Aseptic Sampling Market Volume (K Unit) Forecast, by Application 2019 & 2032
Frequently Asked Questions
1. What is the projected Compound Annual Growth Rate (CAGR) of the Aseptic Sampling Market?
The projected CAGR is approximately 10.20%.
2. Which companies are prominent players in the Aseptic Sampling Market?
Key companies in the market include Bbi-Biotech Gmbh, Merck KGaA, Lonza Group, W L Gore & Associates Inc, Gemu Group, GEA Group, Qualitru Sampling Systems, Keofitt A/S, Advanced Microdevices Pvt Ltd, Sartorius AG (Sartorius Stedim Biotech), Saint Gobain, Thermo Fisher Scientific.
3. What are the main segments of the Aseptic Sampling Market?
The market segments include Type of Sampling, Application, End-User.
4. Can you provide details about the market size?
The market size is estimated to be USD XX Million as of 2022.
5. What are some drivers contributing to market growth?
Stringent Government Regulations for Ensuring Drug Safety; Increasing Demand for Biopharmaceuticals to Eliminate the Risk of Contamination.
6. What are the notable trends driving market growth?
Biotechnology and Pharmaceutical Manufacturers Segment is Expected to Have a Significant Share Over the Forecast Period.
7. Are there any restraints impacting market growth?
Issues Related to Leachable. Extractables and Impurities During Sampling Procedure.
8. Can you provide examples of recent developments in the market?
August 2022: 908 Devices completed the acquisition of privately-held TRACE Analytics GmbH, a provider of online analysis and sampling systems for biotech applications. 908 Devices expects the acquired technology to enable its mass-spec devices as online bioprocess monitors. TRACE Analytics develops online aseptic sampling systems and novel biosensors for bioreactor monitoring and control.
9. What pricing options are available for accessing the report?
Pricing options include single-user, multi-user, and enterprise licenses priced at USD 4750, USD 5250, and USD 8750 respectively.
10. Is the market size provided in terms of value or volume?
The market size is provided in terms of value, measured in Million and volume, measured in K Unit.
11. Are there any specific market keywords associated with the report?
Yes, the market keyword associated with the report is "Aseptic Sampling Market," which aids in identifying and referencing the specific market segment covered.
12. How do I determine which pricing option suits my needs best?
The pricing options vary based on user requirements and access needs. Individual users may opt for single-user licenses, while businesses requiring broader access may choose multi-user or enterprise licenses for cost-effective access to the report.
13. Are there any additional resources or data provided in the Aseptic Sampling Market report?
While the report offers comprehensive insights, it's advisable to review the specific contents or supplementary materials provided to ascertain if additional resources or data are available.
14. How can I stay updated on further developments or reports in the Aseptic Sampling Market?
To stay informed about further developments, trends, and reports in the Aseptic Sampling Market, consider subscribing to industry newsletters, following relevant companies and organizations, or regularly checking reputable industry news sources and publications.
Methodology
Step 1 - Identification of Relevant Samples Size from Population Database


Step 2 - Approaches for Defining Global Market Size (Value, Volume* & Price*)

Note*: In applicable scenarios
Step 3 - Data Sources
Primary Research
- Web Analytics
- Survey Reports
- Research Institute
- Latest Research Reports
- Opinion Leaders
Secondary Research
- Annual Reports
- White Paper
- Latest Press Release
- Industry Association
- Paid Database
- Investor Presentations

Step 4 - Data Triangulation
Involves using different sources of information in order to increase the validity of a study
These sources are likely to be stakeholders in a program - participants, other researchers, program staff, other community members, and so on.
Then we put all data in single framework & apply various statistical tools to find out the dynamic on the market.
During the analysis stage, feedback from the stakeholder groups would be compared to determine areas of agreement as well as areas of divergence


