
Key Insights
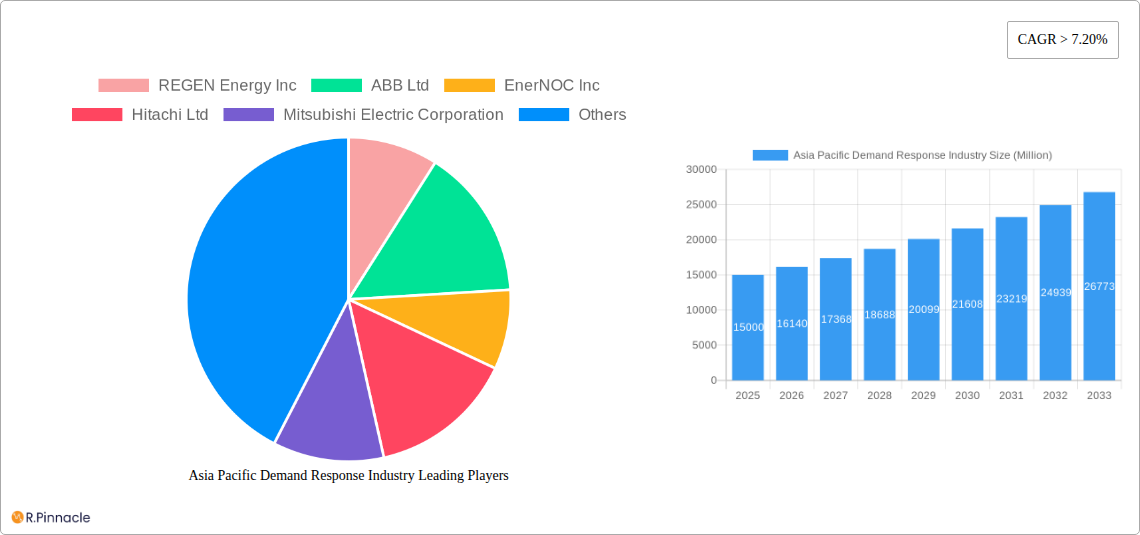
The Asia-Pacific Demand Response (DR) market is experiencing robust growth, driven by increasing electricity demand, rising energy costs, and a growing focus on grid stability and renewable energy integration. The region's diverse energy landscape, coupled with government initiatives promoting energy efficiency and smart grid technologies, is fueling the adoption of both conventional and automated DR programs. China, Japan, India, and South Korea are key market drivers, exhibiting significant investments in smart meters, advanced metering infrastructure (AMI), and DR platforms. The residential sector is currently the largest segment, benefiting from increasing awareness of energy conservation and the availability of smart home devices. However, significant growth potential exists within the commercial and industrial sectors, particularly as businesses seek to optimize energy consumption and reduce operational costs. The shift towards automated DR solutions is a notable trend, offering greater efficiency and scalability compared to conventional methods. This automation, combined with the proliferation of IoT devices and advanced analytics, enables more precise load management and enhanced grid responsiveness. While regulatory frameworks and technological complexities present some challenges, the overall market outlook remains positive, with a projected Compound Annual Growth Rate (CAGR) exceeding 7.2% from 2025 to 2033.
Factors such as grid modernization initiatives, growing adoption of renewable energy sources (requiring better grid management), and increasing electricity prices in many Asian countries are further propelling market growth. However, challenges like initial investment costs for DR technologies, lack of consumer awareness in certain regions, and cybersecurity concerns related to interconnected smart grids need to be addressed. The success of DR initiatives will also hinge on effective collaboration between utilities, energy service providers, and consumers. The increasing integration of DR solutions with broader energy management systems and the development of more sophisticated algorithms for optimizing energy usage patterns will further shape the market landscape in the coming years. The ongoing expansion of smart grid infrastructure across the Asia-Pacific region will be a key determinant of the market's future trajectory.
Asia Pacific Demand Response Industry: A Comprehensive Market Report (2019-2033)
This in-depth report provides a comprehensive analysis of the Asia Pacific Demand Response industry, offering invaluable insights for industry professionals, investors, and strategic decision-makers. With a meticulous study period spanning 2019-2033, a base year of 2025, and a forecast period of 2025-2033, this report delivers actionable intelligence on market size, growth drivers, challenges, and future opportunities. The report leverages extensive data analysis to provide a granular understanding of the market dynamics across various segments and regions.
Asia Pacific Demand Response Industry Market Structure & Innovation Trends
The Asia Pacific Demand Response market exhibits a moderately concentrated structure, with key players like ABB Ltd, General Electric Company, and Siemens AG holding significant market share (estimated at xx% collectively in 2025). Innovation is driven by advancements in smart grid technologies, AI-powered energy management systems, and the increasing integration of renewable energy sources. Regulatory frameworks, while evolving, vary across different countries, impacting market penetration. The market witnesses consistent M&A activity, with deal values exceeding $xx Million in the past five years. Product substitutes, such as traditional energy storage solutions, pose a competitive threat, albeit a limited one due to the inherent advantages of demand response in optimizing grid stability and reducing costs. End-user demographics show a strong uptake in commercial and industrial sectors, driven by cost-saving incentives and sustainability goals.
- Market Concentration: Moderately concentrated, with top 5 players holding xx% market share in 2025.
- Innovation Drivers: Smart grid technologies, AI, renewable energy integration.
- Regulatory Landscape: Evolving, varies significantly across the region.
- M&A Activity: Significant, with over $xx Million in deal value (2020-2024).
- Product Substitutes: Traditional energy storage solutions, limited impact.
- End-User Demographics: High adoption in commercial and industrial segments.
Asia Pacific Demand Response Industry Market Dynamics & Trends
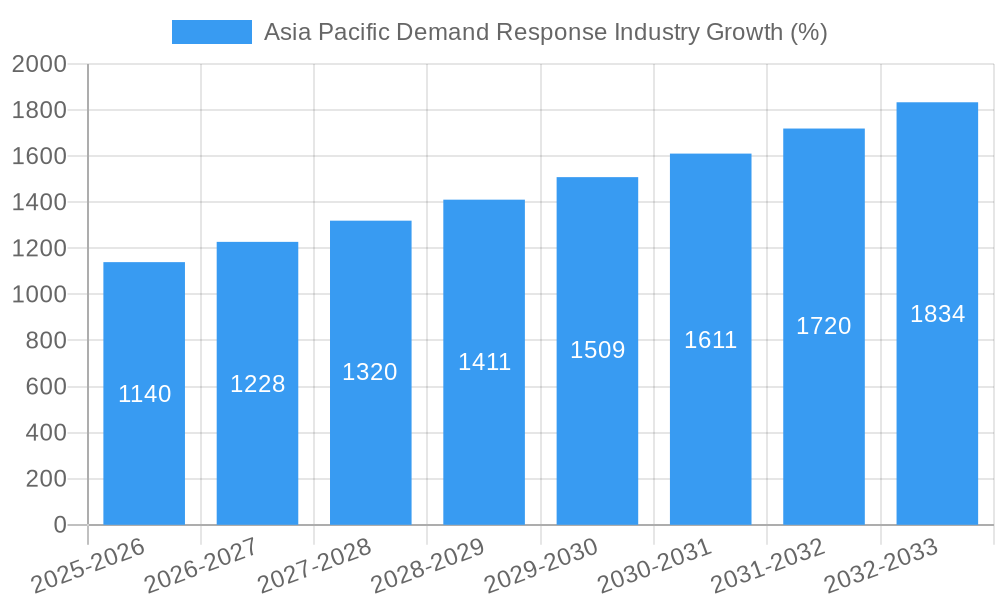
The Asia Pacific Demand Response market is experiencing robust growth, fueled by rising electricity demand, increasing electricity prices, growing adoption of renewable energy, stringent government regulations promoting energy efficiency, and supportive government policies. The market is witnessing significant technological disruptions, with the widespread adoption of smart meters, advanced analytics, and IoT-enabled devices transforming the landscape. Consumer preferences are shifting towards sustainable energy practices, which are further driving demand for demand response solutions. Competitive dynamics are characterized by intense competition among established players and the emergence of new entrants with innovative solutions. The CAGR for the forecast period (2025-2033) is estimated at xx%, with market penetration reaching xx% by 2033.
Dominant Regions & Segments in Asia Pacific Demand Response Industry
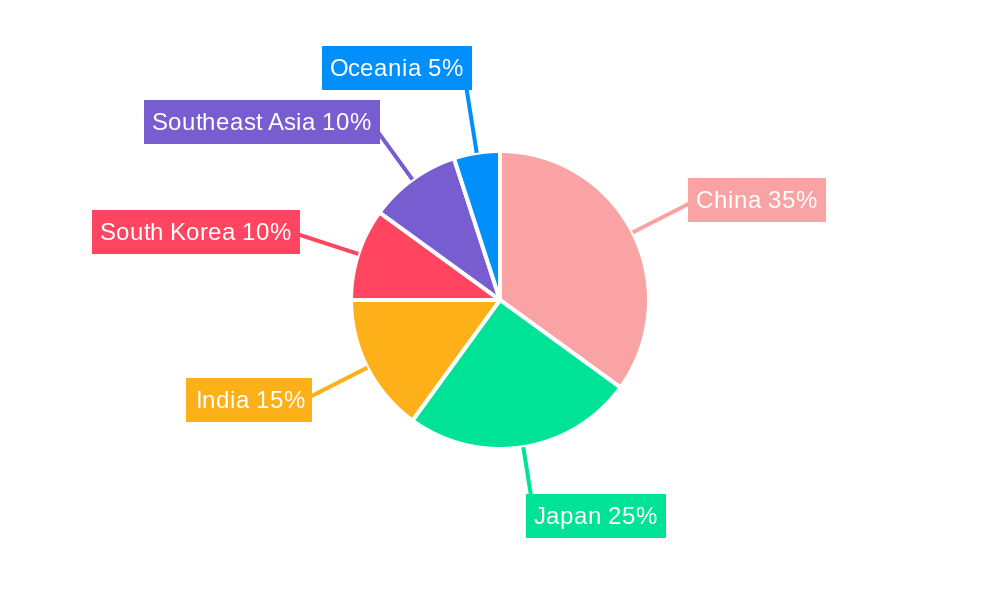
China holds the largest market share in the Asia Pacific Demand Response industry, driven by its massive energy consumption, rapid urbanization, and strong government support for renewable energy integration. Japan and South Korea follow closely, with advanced grid infrastructure and a focus on energy efficiency. Within segments, the Automated Demand Response segment is experiencing faster growth compared to Conventional Demand Response, owing to its enhanced efficiency and scalability. The Commercial and Industrial sectors dominate end-use applications due to their higher energy consumption and willingness to invest in energy optimization strategies.
- Leading Region: China, driven by high energy consumption and supportive policies.
- Key Drivers in China: Massive energy consumption, urbanization, government support.
- Key Drivers in Japan: Advanced grid infrastructure, energy efficiency focus.
- Key Drivers in India: Growing energy demand, government initiatives.
- Dominant Segment (Type): Automated Demand Response, higher efficiency and scalability.
- Dominant Segment (End-Use): Commercial and Industrial sectors, high energy consumption.
Asia Pacific Demand Response Industry Product Innovations
Recent product innovations focus on AI-powered predictive analytics for optimized demand response programs, improved energy storage integration, and advanced communication protocols for seamless grid integration. These innovations enhance the efficiency, reliability, and scalability of demand response systems, resulting in significant cost savings for end-users and improved grid stability. The market is witnessing a trend towards cloud-based platforms and modular designs to facilitate easy deployment and customization.
Report Scope & Segmentation Analysis
This report segments the Asia Pacific Demand Response market by type (Conventional and Automated Demand Response) and end-use (Residential, Commercial, and Industrial). It further categorizes the market by region (China, Japan, India, South Korea, Southeast Asia, and Oceania). Each segment's market size, growth projections, and competitive dynamics are comprehensively analyzed within the report. Significant growth is projected for the Automated Demand Response segment and the Commercial and Industrial end-use segments across all regions.
Key Drivers of Asia Pacific Demand Response Industry Growth
The growth of the Asia Pacific Demand Response industry is fueled by several key factors: increasing electricity demand and prices, growing adoption of renewable energy, government regulations promoting energy efficiency, and technological advancements in smart grid technologies and data analytics. Supportive government policies, including financial incentives and regulatory frameworks, further stimulate market growth.
Challenges in the Asia Pacific Demand Response Industry Sector
Challenges include the high initial investment costs associated with implementing demand response systems, interoperability issues across different platforms and technologies, and regulatory uncertainties in some markets. Concerns regarding data security and privacy also pose significant challenges. The lack of awareness and understanding among residential customers presents a hurdle in some regions.
Emerging Opportunities in Asia Pacific Demand Response Industry
Significant opportunities exist in expanding demand response programs to residential consumers, integrating demand response with electric vehicle charging infrastructure, developing innovative pricing models and business models, and exploring the potential of blockchain technology for enhanced transparency and security. The integration of AI and machine learning for advanced analytics presents a significant opportunity for improved energy management.
Leading Players in the Asia Pacific Demand Response Industry Market
- REGEN Energy Inc
- ABB Ltd
- EnerNOC Inc
- Hitachi Ltd
- Mitsubishi Electric Corporation
- Siemens AG
- Schneider Electric SE
- Eaton Corporation PLC
- Alstom Inc
- General Electric Company
- Silver Spring Networks
- Autogrid Systems Inc
Key Developments in Asia Pacific Demand Response Industry
- 2022 Q4: ABB Ltd launched a new AI-powered demand response platform.
- 2023 Q1: Siemens AG announced a strategic partnership with a major energy provider in China to deploy demand response solutions.
- 2023 Q2: Significant investments were made in automated demand response solutions by several leading players. (Specific examples and funding amounts unavailable for this prediction)
Future Outlook for Asia Pacific Demand Response Industry Market
The Asia Pacific Demand Response market is poised for substantial growth over the next decade, driven by supportive government policies, technological advancements, and increasing consumer awareness. Strategic partnerships, innovative business models, and technological breakthroughs will further propel market expansion. The integration of demand response solutions within a broader smart city framework is expected to create substantial growth opportunities.
Asia Pacific Demand Response Industry Segmentation
-
1. Type
- 1.1. Conventional Demand Response
- 1.2. Automated Demand Response
-
2. Geography
- 2.1. Australia
- 2.2. China
- 2.3. India
- 2.4. Japan
- 2.5. Rest of Asia-Pacific
Asia Pacific Demand Response Industry Segmentation By Geography
- 1. Australia
- 2. China
- 3. India
- 4. Japan
- 5. Rest of Asia Pacific
Asia Pacific Demand Response Industry REPORT HIGHLIGHTS
| Aspects | Details |
|---|---|
| Study Period | 2019-2033 |
| Base Year | 2024 |
| Estimated Year | 2025 |
| Forecast Period | 2025-2033 |
| Historical Period | 2019-2024 |
| Growth Rate | CAGR of > 7.20% from 2019-2033 |
| Segmentation |
|
Table of Contents
- 1. Introduction
- 1.1. Research Scope
- 1.2. Market Segmentation
- 1.3. Research Methodology
- 1.4. Definitions and Assumptions
- 2. Executive Summary
- 2.1. Introduction
- 3. Market Dynamics
- 3.1. Introduction
- 3.2. Market Drivers
- 3.2.1. 4.; Growing Demand for Energy As A Service4.; Increasing Adoption of Distributed Energy Generation in Commercial and Industrial Sectors
- 3.3. Market Restrains
- 3.3.1. 4.; Lack of Awareness in Developing Economies and High Technological Costs
- 3.4. Market Trends
- 3.4.1. Automated Demand Response System Likely To Drive The Market
- 4. Market Factor Analysis
- 4.1. Porters Five Forces
- 4.2. Supply/Value Chain
- 4.3. PESTEL analysis
- 4.4. Market Entropy
- 4.5. Patent/Trademark Analysis
- 5. Asia Pacific Demand Response Industry Analysis, Insights and Forecast, 2019-2031
- 5.1. Market Analysis, Insights and Forecast - by Type
- 5.1.1. Conventional Demand Response
- 5.1.2. Automated Demand Response
- 5.2. Market Analysis, Insights and Forecast - by Geography
- 5.2.1. Australia
- 5.2.2. China
- 5.2.3. India
- 5.2.4. Japan
- 5.2.5. Rest of Asia-Pacific
- 5.3. Market Analysis, Insights and Forecast - by Region
- 5.3.1. Australia
- 5.3.2. China
- 5.3.3. India
- 5.3.4. Japan
- 5.3.5. Rest of Asia Pacific
- 5.1. Market Analysis, Insights and Forecast - by Type
- 6. Australia Asia Pacific Demand Response Industry Analysis, Insights and Forecast, 2019-2031
- 6.1. Market Analysis, Insights and Forecast - by Type
- 6.1.1. Conventional Demand Response
- 6.1.2. Automated Demand Response
- 6.2. Market Analysis, Insights and Forecast - by Geography
- 6.2.1. Australia
- 6.2.2. China
- 6.2.3. India
- 6.2.4. Japan
- 6.2.5. Rest of Asia-Pacific
- 6.1. Market Analysis, Insights and Forecast - by Type
- 7. China Asia Pacific Demand Response Industry Analysis, Insights and Forecast, 2019-2031
- 7.1. Market Analysis, Insights and Forecast - by Type
- 7.1.1. Conventional Demand Response
- 7.1.2. Automated Demand Response
- 7.2. Market Analysis, Insights and Forecast - by Geography
- 7.2.1. Australia
- 7.2.2. China
- 7.2.3. India
- 7.2.4. Japan
- 7.2.5. Rest of Asia-Pacific
- 7.1. Market Analysis, Insights and Forecast - by Type
- 8. India Asia Pacific Demand Response Industry Analysis, Insights and Forecast, 2019-2031
- 8.1. Market Analysis, Insights and Forecast - by Type
- 8.1.1. Conventional Demand Response
- 8.1.2. Automated Demand Response
- 8.2. Market Analysis, Insights and Forecast - by Geography
- 8.2.1. Australia
- 8.2.2. China
- 8.2.3. India
- 8.2.4. Japan
- 8.2.5. Rest of Asia-Pacific
- 8.1. Market Analysis, Insights and Forecast - by Type
- 9. Japan Asia Pacific Demand Response Industry Analysis, Insights and Forecast, 2019-2031
- 9.1. Market Analysis, Insights and Forecast - by Type
- 9.1.1. Conventional Demand Response
- 9.1.2. Automated Demand Response
- 9.2. Market Analysis, Insights and Forecast - by Geography
- 9.2.1. Australia
- 9.2.2. China
- 9.2.3. India
- 9.2.4. Japan
- 9.2.5. Rest of Asia-Pacific
- 9.1. Market Analysis, Insights and Forecast - by Type
- 10. Rest of Asia Pacific Asia Pacific Demand Response Industry Analysis, Insights and Forecast, 2019-2031
- 10.1. Market Analysis, Insights and Forecast - by Type
- 10.1.1. Conventional Demand Response
- 10.1.2. Automated Demand Response
- 10.2. Market Analysis, Insights and Forecast - by Geography
- 10.2.1. Australia
- 10.2.2. China
- 10.2.3. India
- 10.2.4. Japan
- 10.2.5. Rest of Asia-Pacific
- 10.1. Market Analysis, Insights and Forecast - by Type
- 11. China Asia Pacific Demand Response Industry Analysis, Insights and Forecast, 2019-2031
- 12. Japan Asia Pacific Demand Response Industry Analysis, Insights and Forecast, 2019-2031
- 13. India Asia Pacific Demand Response Industry Analysis, Insights and Forecast, 2019-2031
- 14. South Korea Asia Pacific Demand Response Industry Analysis, Insights and Forecast, 2019-2031
- 15. Taiwan Asia Pacific Demand Response Industry Analysis, Insights and Forecast, 2019-2031
- 16. Australia Asia Pacific Demand Response Industry Analysis, Insights and Forecast, 2019-2031
- 17. Rest of Asia-Pacific Asia Pacific Demand Response Industry Analysis, Insights and Forecast, 2019-2031
- 18. Competitive Analysis
- 18.1. Market Share Analysis 2024
- 18.2. Company Profiles
- 18.2.1 REGEN Energy Inc
- 18.2.1.1. Overview
- 18.2.1.2. Products
- 18.2.1.3. SWOT Analysis
- 18.2.1.4. Recent Developments
- 18.2.1.5. Financials (Based on Availability)
- 18.2.2 ABB Ltd
- 18.2.2.1. Overview
- 18.2.2.2. Products
- 18.2.2.3. SWOT Analysis
- 18.2.2.4. Recent Developments
- 18.2.2.5. Financials (Based on Availability)
- 18.2.3 EnerNOC Inc
- 18.2.3.1. Overview
- 18.2.3.2. Products
- 18.2.3.3. SWOT Analysis
- 18.2.3.4. Recent Developments
- 18.2.3.5. Financials (Based on Availability)
- 18.2.4 Hitachi Ltd
- 18.2.4.1. Overview
- 18.2.4.2. Products
- 18.2.4.3. SWOT Analysis
- 18.2.4.4. Recent Developments
- 18.2.4.5. Financials (Based on Availability)
- 18.2.5 Mitsubishi Electric Corporation
- 18.2.5.1. Overview
- 18.2.5.2. Products
- 18.2.5.3. SWOT Analysis
- 18.2.5.4. Recent Developments
- 18.2.5.5. Financials (Based on Availability)
- 18.2.6 Siemens AG
- 18.2.6.1. Overview
- 18.2.6.2. Products
- 18.2.6.3. SWOT Analysis
- 18.2.6.4. Recent Developments
- 18.2.6.5. Financials (Based on Availability)
- 18.2.7 Schneider Electric SE
- 18.2.7.1. Overview
- 18.2.7.2. Products
- 18.2.7.3. SWOT Analysis
- 18.2.7.4. Recent Developments
- 18.2.7.5. Financials (Based on Availability)
- 18.2.8 Eaton Corporation PLC
- 18.2.8.1. Overview
- 18.2.8.2. Products
- 18.2.8.3. SWOT Analysis
- 18.2.8.4. Recent Developments
- 18.2.8.5. Financials (Based on Availability)
- 18.2.9 Alstom Inc
- 18.2.9.1. Overview
- 18.2.9.2. Products
- 18.2.9.3. SWOT Analysis
- 18.2.9.4. Recent Developments
- 18.2.9.5. Financials (Based on Availability)
- 18.2.10 General Electric Company
- 18.2.10.1. Overview
- 18.2.10.2. Products
- 18.2.10.3. SWOT Analysis
- 18.2.10.4. Recent Developments
- 18.2.10.5. Financials (Based on Availability)
- 18.2.11 Silver Spring Networks
- 18.2.11.1. Overview
- 18.2.11.2. Products
- 18.2.11.3. SWOT Analysis
- 18.2.11.4. Recent Developments
- 18.2.11.5. Financials (Based on Availability)
- 18.2.12 Autogrid Systems Inc
- 18.2.12.1. Overview
- 18.2.12.2. Products
- 18.2.12.3. SWOT Analysis
- 18.2.12.4. Recent Developments
- 18.2.12.5. Financials (Based on Availability)
- 18.2.1 REGEN Energy Inc
List of Figures
- Figure 1: Asia Pacific Demand Response Industry Revenue Breakdown (Million, %) by Product 2024 & 2032
- Figure 2: Asia Pacific Demand Response Industry Share (%) by Company 2024
List of Tables
- Table 1: Asia Pacific Demand Response Industry Revenue Million Forecast, by Region 2019 & 2032
- Table 2: Asia Pacific Demand Response Industry Revenue Million Forecast, by Type 2019 & 2032
- Table 3: Asia Pacific Demand Response Industry Revenue Million Forecast, by Geography 2019 & 2032
- Table 4: Asia Pacific Demand Response Industry Revenue Million Forecast, by Region 2019 & 2032
- Table 5: Asia Pacific Demand Response Industry Revenue Million Forecast, by Country 2019 & 2032
- Table 6: China Asia Pacific Demand Response Industry Revenue (Million) Forecast, by Application 2019 & 2032
- Table 7: Japan Asia Pacific Demand Response Industry Revenue (Million) Forecast, by Application 2019 & 2032
- Table 8: India Asia Pacific Demand Response Industry Revenue (Million) Forecast, by Application 2019 & 2032
- Table 9: South Korea Asia Pacific Demand Response Industry Revenue (Million) Forecast, by Application 2019 & 2032
- Table 10: Taiwan Asia Pacific Demand Response Industry Revenue (Million) Forecast, by Application 2019 & 2032
- Table 11: Australia Asia Pacific Demand Response Industry Revenue (Million) Forecast, by Application 2019 & 2032
- Table 12: Rest of Asia-Pacific Asia Pacific Demand Response Industry Revenue (Million) Forecast, by Application 2019 & 2032
- Table 13: Asia Pacific Demand Response Industry Revenue Million Forecast, by Type 2019 & 2032
- Table 14: Asia Pacific Demand Response Industry Revenue Million Forecast, by Geography 2019 & 2032
- Table 15: Asia Pacific Demand Response Industry Revenue Million Forecast, by Country 2019 & 2032
- Table 16: Asia Pacific Demand Response Industry Revenue Million Forecast, by Type 2019 & 2032
- Table 17: Asia Pacific Demand Response Industry Revenue Million Forecast, by Geography 2019 & 2032
- Table 18: Asia Pacific Demand Response Industry Revenue Million Forecast, by Country 2019 & 2032
- Table 19: Asia Pacific Demand Response Industry Revenue Million Forecast, by Type 2019 & 2032
- Table 20: Asia Pacific Demand Response Industry Revenue Million Forecast, by Geography 2019 & 2032
- Table 21: Asia Pacific Demand Response Industry Revenue Million Forecast, by Country 2019 & 2032
- Table 22: Asia Pacific Demand Response Industry Revenue Million Forecast, by Type 2019 & 2032
- Table 23: Asia Pacific Demand Response Industry Revenue Million Forecast, by Geography 2019 & 2032
- Table 24: Asia Pacific Demand Response Industry Revenue Million Forecast, by Country 2019 & 2032
- Table 25: Asia Pacific Demand Response Industry Revenue Million Forecast, by Type 2019 & 2032
- Table 26: Asia Pacific Demand Response Industry Revenue Million Forecast, by Geography 2019 & 2032
- Table 27: Asia Pacific Demand Response Industry Revenue Million Forecast, by Country 2019 & 2032
Frequently Asked Questions
1. What is the projected Compound Annual Growth Rate (CAGR) of the Asia Pacific Demand Response Industry?
The projected CAGR is approximately > 7.20%.
2. Which companies are prominent players in the Asia Pacific Demand Response Industry?
Key companies in the market include REGEN Energy Inc, ABB Ltd, EnerNOC Inc, Hitachi Ltd, Mitsubishi Electric Corporation, Siemens AG, Schneider Electric SE, Eaton Corporation PLC, Alstom Inc, General Electric Company, Silver Spring Networks, Autogrid Systems Inc.
3. What are the main segments of the Asia Pacific Demand Response Industry?
The market segments include Type, Geography.
4. Can you provide details about the market size?
The market size is estimated to be USD XX Million as of 2022.
5. What are some drivers contributing to market growth?
4.; Growing Demand for Energy As A Service4.; Increasing Adoption of Distributed Energy Generation in Commercial and Industrial Sectors.
6. What are the notable trends driving market growth?
Automated Demand Response System Likely To Drive The Market.
7. Are there any restraints impacting market growth?
4.; Lack of Awareness in Developing Economies and High Technological Costs.
8. Can you provide examples of recent developments in the market?
N/A
9. What pricing options are available for accessing the report?
Pricing options include single-user, multi-user, and enterprise licenses priced at USD 4750, USD 5250, and USD 8750 respectively.
10. Is the market size provided in terms of value or volume?
The market size is provided in terms of value, measured in Million.
11. Are there any specific market keywords associated with the report?
Yes, the market keyword associated with the report is "Asia Pacific Demand Response Industry," which aids in identifying and referencing the specific market segment covered.
12. How do I determine which pricing option suits my needs best?
The pricing options vary based on user requirements and access needs. Individual users may opt for single-user licenses, while businesses requiring broader access may choose multi-user or enterprise licenses for cost-effective access to the report.
13. Are there any additional resources or data provided in the Asia Pacific Demand Response Industry report?
While the report offers comprehensive insights, it's advisable to review the specific contents or supplementary materials provided to ascertain if additional resources or data are available.
14. How can I stay updated on further developments or reports in the Asia Pacific Demand Response Industry?
To stay informed about further developments, trends, and reports in the Asia Pacific Demand Response Industry, consider subscribing to industry newsletters, following relevant companies and organizations, or regularly checking reputable industry news sources and publications.
Methodology
Step 1 - Identification of Relevant Samples Size from Population Database


Step 2 - Approaches for Defining Global Market Size (Value, Volume* & Price*)

Note*: In applicable scenarios
Step 3 - Data Sources
Primary Research
- Web Analytics
- Survey Reports
- Research Institute
- Latest Research Reports
- Opinion Leaders
Secondary Research
- Annual Reports
- White Paper
- Latest Press Release
- Industry Association
- Paid Database
- Investor Presentations

Step 4 - Data Triangulation
Involves using different sources of information in order to increase the validity of a study
These sources are likely to be stakeholders in a program - participants, other researchers, program staff, other community members, and so on.
Then we put all data in single framework & apply various statistical tools to find out the dynamic on the market.
During the analysis stage, feedback from the stakeholder groups would be compared to determine areas of agreement as well as areas of divergence


