
Key Insights
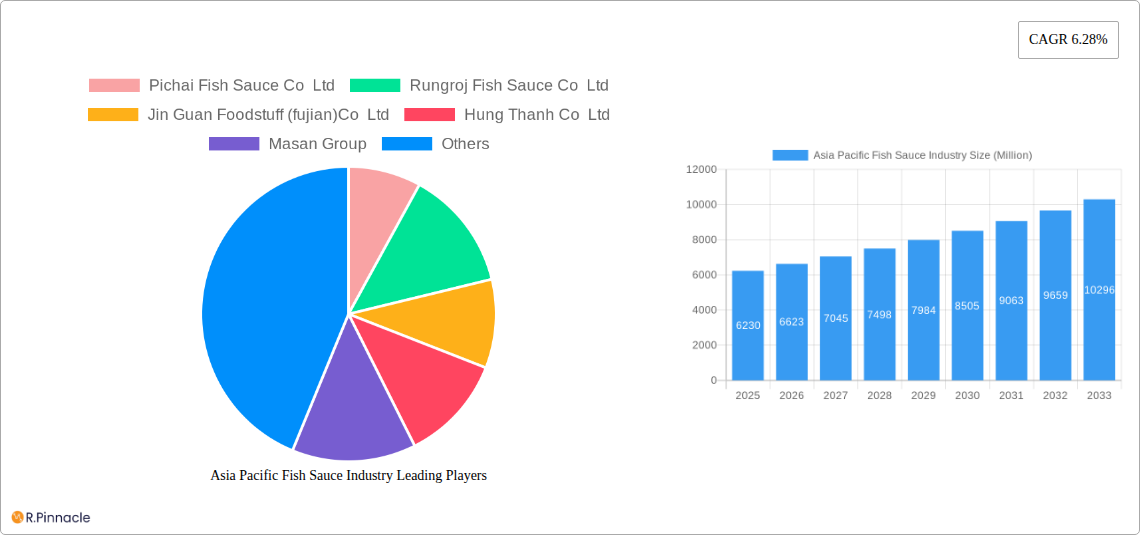
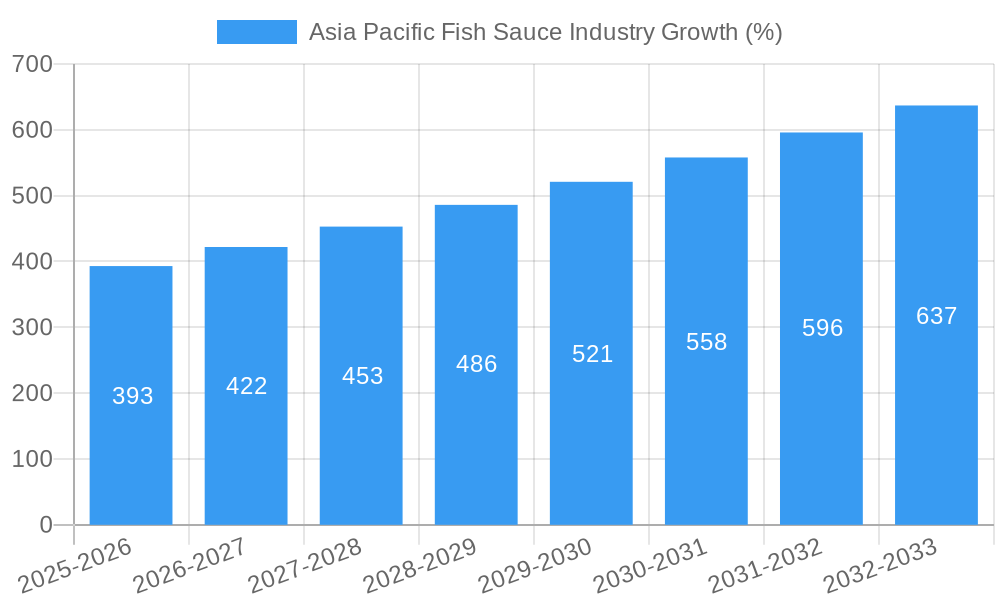
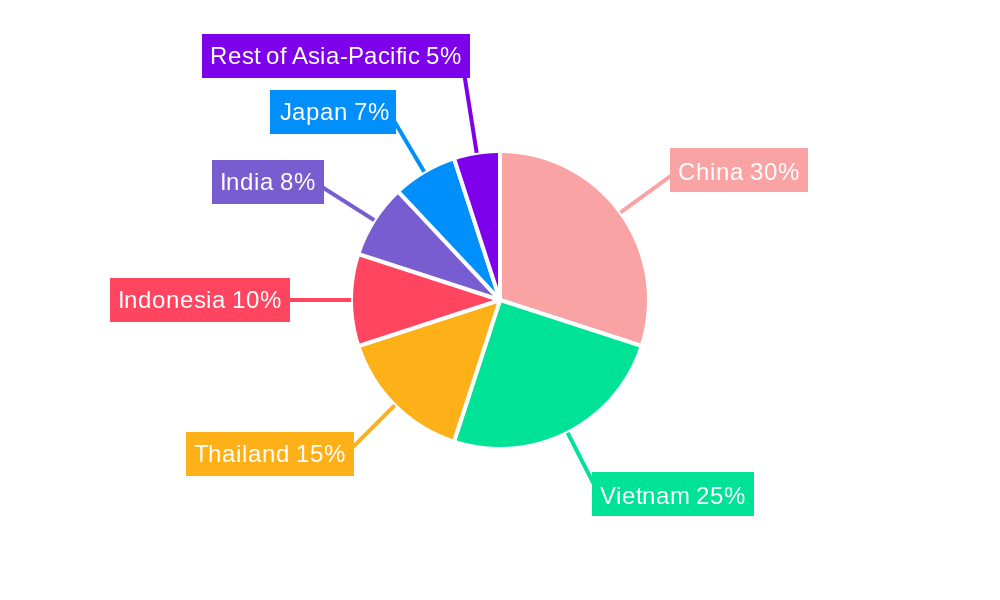
The Asia-Pacific fish sauce market, valued at $6.23 billion in 2025, is projected to experience robust growth, exhibiting a Compound Annual Growth Rate (CAGR) of 6.28% from 2025 to 2033. This expansion is driven by several key factors. Rising consumer demand for authentic Asian cuisine globally fuels increased fish sauce consumption. The increasing popularity of healthy and flavorful food options, particularly in developed economies within the region, further boosts market growth. The versatility of fish sauce in various culinary applications, from marinades and dipping sauces to flavoring agents in stir-fries and soups, contributes to its widespread use. Furthermore, the growing food processing and restaurant industries in the region contribute to the higher demand for this essential condiment. The market is segmented by composition (basic and premium), end-user (food manufacturers, retail, and food service), and geography (China, Japan, India, Vietnam, Thailand, Indonesia, and the Rest of Asia-Pacific). Premium fish sauce segments are expected to witness significant growth driven by increasing consumer preference for high-quality, naturally produced condiments. The dominance of specific countries within the region, such as Vietnam and Thailand, known for their established fish sauce production, shapes the competitive landscape. However, factors such as fluctuating raw material prices and stringent regulations concerning food safety can pose challenges to market expansion.
The competitive landscape is characterized by a mix of established players and emerging brands. Key players like Pichai Fish Sauce Co Ltd, Rungroj Fish Sauce Co Ltd, and Masan Group are consolidating their market positions through product diversification, expansion into new markets, and strategic partnerships. The increasing adoption of innovative packaging and marketing strategies enhances brand visibility and consumer preference. The market is witnessing a shift toward sustainable and ethically sourced fish sauce, with consumers demanding transparency in the production process. This trend is pushing producers to adopt eco-friendly practices and utilize sustainable sourcing methods. The forecast period, 2025-2033, anticipates continued growth, driven by evolving consumer preferences and increasing disposable incomes across the Asia-Pacific region. The market's future trajectory will be largely shaped by the effectiveness of these companies in adapting to consumer demands and navigating regulatory landscapes.
This comprehensive report provides an in-depth analysis of the Asia Pacific fish sauce industry, offering valuable insights for industry professionals, investors, and stakeholders. Covering the period 2019-2033, with a focus on 2025, this report analyzes market dynamics, key players, and future growth opportunities across various segments. The report leverages extensive data and analysis to deliver actionable intelligence for strategic decision-making.
Asia Pacific Fish Sauce Industry Market Structure & Innovation Trends
This section analyzes the competitive landscape of the Asia Pacific fish sauce market, examining market concentration, innovation drivers, regulatory frameworks, and key industry trends. The market is characterized by a mix of large established players and smaller regional producers. Market share is highly fragmented, with no single company dominating. However, companies like Masan Group and Red Boat Fish Sauce hold significant regional influence.
- Market Concentration: Moderately fragmented, with top 5 players holding approximately xx% market share (2025 estimate).
- Innovation Drivers: Increasing consumer demand for premium and specialized fish sauces, coupled with technological advancements in production and processing.
- Regulatory Frameworks: Varying regulations across countries impacting labeling, production, and distribution. Harmonization efforts are underway but remain fragmented.
- Product Substitutes: Soy sauce, other condiments, and flavor enhancers pose competitive pressure.
- End-User Demographics: Growing middle class and changing consumption patterns drive demand, particularly in emerging economies.
- M&A Activities: Moderate M&A activity observed in the historical period (2019-2024), with deal values averaging approximately xx Million USD. Increased consolidation is expected in the forecast period. Examples include potential acquisitions to expand geographical reach or product portfolios.
Asia Pacific Fish Sauce Industry Market Dynamics & Trends
The Asia Pacific fish sauce market is witnessing robust growth driven by several factors. Rising disposable incomes, especially in developing economies like India and Indonesia, are significantly contributing to increased consumption. The rising popularity of Asian cuisine globally further fuels demand. However, fluctuating raw material prices and supply chain disruptions pose challenges.
- Market Growth Drivers: Increased consumption of Asian cuisine, rising disposable incomes, expanding food service sector, and increasing product diversification (e.g., premium and specialized fish sauces).
- Technological Disruptions: Automation in production and processing improving efficiency and consistency.
- Consumer Preferences: Growing demand for premium, organic, and sustainably sourced fish sauces. Healthier alternatives with reduced sodium content are gaining traction.
- Competitive Dynamics: Intense competition, both among established players and new entrants. Innovation, branding, and distribution network are critical for success.
- CAGR: The market is projected to register a CAGR of xx% during the forecast period (2025-2033).
- Market Penetration: Market penetration varies significantly across countries, with higher penetration in established markets like Vietnam and Thailand compared to emerging markets.
Dominant Regions & Segments in Asia Pacific Fish Sauce Industry
Vietnam and Thailand remain the dominant regions due to established production bases and cultural significance of fish sauce. However, China and Indonesia are emerging as significant markets with substantial growth potential.
Dominant Regions:
- Vietnam: Strong historical production base, significant export volumes, and established industry players. Key drivers include favorable climatic conditions, experienced workforce, and government support.
- Thailand: Similar to Vietnam, with a long-standing tradition of fish sauce production and strong export capabilities.
- China: Rapid economic growth and evolving consumer preferences are fueling market expansion.
- Indonesia: Large population and growing middle class provide significant growth opportunities.
Dominant Segments:
- Product Type: Traditional fish sauce holds the largest market share due to its established popularity and wide acceptance. However, the industrial segment is growing steadily, driven by the demands of large food manufacturers.
- Composition: Basic fish sauce maintains a significant share; however, the premium segment is experiencing rapid growth due to increasing consumer preference for higher quality and specialized products.
- End-User: Food manufacturers and the food service sector drive substantial demand, followed by retail sales.
Asia Pacific Fish Sauce Industry Product Innovations
Recent innovations focus on premiumization, diversification, and convenience. Companies are introducing specialized fish sauces catering to specific culinary needs (e.g., Kho sauce by Red Boat) and offering varied packaging sizes for broader consumer reach (e.g., Hoang Gia). Technological advancements are improving production efficiency, enhancing quality and consistency.
Report Scope & Segmentation Analysis
This report segments the Asia Pacific fish sauce market based on composition (basic, premium), product type (industrial, traditional), end-user (food manufacturers, retail, food service), and country (China, Japan, India, Vietnam, Thailand, Indonesia, Rest of Asia-Pacific). Each segment's growth projections, market size, and competitive dynamics are analyzed in detail. Specific market sizes and growth projections for each segment are available in the full report.
Key Drivers of Asia Pacific Fish Sauce Industry Growth
The Asia Pacific fish sauce industry is driven by rising disposable incomes in emerging economies, increased adoption of Asian cuisine globally, and expansion of the food service sector. Government initiatives promoting local industries also play a crucial role. Technological advancements in production processes and packaging enhance efficiency and product quality.
Challenges in the Asia Pacific Fish Sauce Industry Sector
Challenges include fluctuating raw material prices (fish and salt), potential supply chain disruptions, and the rising cost of labor. Stringent food safety regulations and concerns about sustainability are also prominent factors that impact profitability.
Emerging Opportunities in Asia Pacific Fish Sauce Industry
Emerging opportunities lie in expanding into new markets, focusing on premium and specialized products, and leveraging digital marketing strategies. Sustainable sourcing and eco-friendly packaging are key areas to address growing consumer concerns. Exploring new applications of fish sauce in various food products and cuisines presents additional opportunities.
Leading Players in the Asia Pacific Fish Sauce Industry Market
- Pichai Fish Sauce Co Ltd
- Rungroj Fish Sauce Co Ltd
- Jin Guan Foodstuff (fujian)Co Ltd
- Hung Thanh Co Ltd
- Masan Group
- Rayong Fish Sauce Industry co ltd
- Nam Phuong Food (Barona Vietnam)
- Sin Guo Co (Pte) Ltd
- Red Boat Fish Sauce
- Tang Sang Hah Co Ltd
Key Developments in Asia Pacific Fish Sauce Industry
- September 2021: Red Boat Fish Sauce launched Kho Sauce, expanding its product portfolio.
- January 2023: Hoang Gia Fish Sauce introduced new product sizes in the Australian market, boosting sales through promotional activities.
Future Outlook for Asia Pacific Fish Sauce Industry Market
The Asia Pacific fish sauce market is poised for continued growth, driven by rising consumer demand, product innovation, and increasing market penetration in emerging economies. Strategic partnerships, expansion into new geographical markets, and investments in sustainable practices will be critical success factors for players in the coming years. The market is expected to experience substantial expansion, with opportunities for both established players and new entrants.
Asia Pacific Fish Sauce Industry Segmentation
-
1. Product Type
- 1.1. Industrial
- 1.2. Traditional
-
2. Composition
- 2.1. Basic
- 2.2. Premium
-
3. End-User
- 3.1. Food Manufacturers
- 3.2. Retail
- 3.3. Food Service
Asia Pacific Fish Sauce Industry Segmentation By Geography
-
1. Asia Pacific
- 1.1. China
- 1.2. Japan
- 1.3. South Korea
- 1.4. India
- 1.5. Australia
- 1.6. New Zealand
- 1.7. Indonesia
- 1.8. Malaysia
- 1.9. Singapore
- 1.10. Thailand
- 1.11. Vietnam
- 1.12. Philippines
Asia Pacific Fish Sauce Industry REPORT HIGHLIGHTS
| Aspects | Details |
|---|---|
| Study Period | 2019-2033 |
| Base Year | 2024 |
| Estimated Year | 2025 |
| Forecast Period | 2025-2033 |
| Historical Period | 2019-2024 |
| Growth Rate | CAGR of 6.28% from 2019-2033 |
| Segmentation |
|
Table of Contents
- 1. Introduction
- 1.1. Research Scope
- 1.2. Market Segmentation
- 1.3. Research Methodology
- 1.4. Definitions and Assumptions
- 2. Executive Summary
- 2.1. Introduction
- 3. Market Dynamics
- 3.1. Introduction
- 3.2. Market Drivers
- 3.2.1. Health Benefits Promoting Apple Cider Vinegar Demand; Unfiltered Apple Cider Vinegar Being Popular
- 3.3. Market Restrains
- 3.3.1. Rising Demand for Other Vinegar Types
- 3.4. Market Trends
- 3.4.1. Rise in the Demand for Fortified Fish Sauce
- 4. Market Factor Analysis
- 4.1. Porters Five Forces
- 4.2. Supply/Value Chain
- 4.3. PESTEL analysis
- 4.4. Market Entropy
- 4.5. Patent/Trademark Analysis
- 5. Asia Pacific Fish Sauce Industry Analysis, Insights and Forecast, 2019-2031
- 5.1. Market Analysis, Insights and Forecast - by Product Type
- 5.1.1. Industrial
- 5.1.2. Traditional
- 5.2. Market Analysis, Insights and Forecast - by Composition
- 5.2.1. Basic
- 5.2.2. Premium
- 5.3. Market Analysis, Insights and Forecast - by End-User
- 5.3.1. Food Manufacturers
- 5.3.2. Retail
- 5.3.3. Food Service
- 5.4. Market Analysis, Insights and Forecast - by Region
- 5.4.1. Asia Pacific
- 5.1. Market Analysis, Insights and Forecast - by Product Type
- 6. China Asia Pacific Fish Sauce Industry Analysis, Insights and Forecast, 2019-2031
- 7. Japan Asia Pacific Fish Sauce Industry Analysis, Insights and Forecast, 2019-2031
- 8. India Asia Pacific Fish Sauce Industry Analysis, Insights and Forecast, 2019-2031
- 9. South Korea Asia Pacific Fish Sauce Industry Analysis, Insights and Forecast, 2019-2031
- 10. Taiwan Asia Pacific Fish Sauce Industry Analysis, Insights and Forecast, 2019-2031
- 11. Australia Asia Pacific Fish Sauce Industry Analysis, Insights and Forecast, 2019-2031
- 12. Rest of Asia-Pacific Asia Pacific Fish Sauce Industry Analysis, Insights and Forecast, 2019-2031
- 13. Competitive Analysis
- 13.1. Market Share Analysis 2024
- 13.2. Company Profiles
- 13.2.1 Pichai Fish Sauce Co Ltd
- 13.2.1.1. Overview
- 13.2.1.2. Products
- 13.2.1.3. SWOT Analysis
- 13.2.1.4. Recent Developments
- 13.2.1.5. Financials (Based on Availability)
- 13.2.2 Rungroj Fish Sauce Co Ltd
- 13.2.2.1. Overview
- 13.2.2.2. Products
- 13.2.2.3. SWOT Analysis
- 13.2.2.4. Recent Developments
- 13.2.2.5. Financials (Based on Availability)
- 13.2.3 Jin Guan Foodstuff (fujian)Co Ltd
- 13.2.3.1. Overview
- 13.2.3.2. Products
- 13.2.3.3. SWOT Analysis
- 13.2.3.4. Recent Developments
- 13.2.3.5. Financials (Based on Availability)
- 13.2.4 Hung Thanh Co Ltd
- 13.2.4.1. Overview
- 13.2.4.2. Products
- 13.2.4.3. SWOT Analysis
- 13.2.4.4. Recent Developments
- 13.2.4.5. Financials (Based on Availability)
- 13.2.5 Masan Group
- 13.2.5.1. Overview
- 13.2.5.2. Products
- 13.2.5.3. SWOT Analysis
- 13.2.5.4. Recent Developments
- 13.2.5.5. Financials (Based on Availability)
- 13.2.6 Rayong Fish Sauce Industry co ltd
- 13.2.6.1. Overview
- 13.2.6.2. Products
- 13.2.6.3. SWOT Analysis
- 13.2.6.4. Recent Developments
- 13.2.6.5. Financials (Based on Availability)
- 13.2.7 Nam Phuong Food (Barona Vietnam)*List Not Exhaustive
- 13.2.7.1. Overview
- 13.2.7.2. Products
- 13.2.7.3. SWOT Analysis
- 13.2.7.4. Recent Developments
- 13.2.7.5. Financials (Based on Availability)
- 13.2.8 Sin Guo Co (Pte) Ltd
- 13.2.8.1. Overview
- 13.2.8.2. Products
- 13.2.8.3. SWOT Analysis
- 13.2.8.4. Recent Developments
- 13.2.8.5. Financials (Based on Availability)
- 13.2.9 Red Boat Fish Sauce
- 13.2.9.1. Overview
- 13.2.9.2. Products
- 13.2.9.3. SWOT Analysis
- 13.2.9.4. Recent Developments
- 13.2.9.5. Financials (Based on Availability)
- 13.2.10 Tang Sang Hah Co Ltd
- 13.2.10.1. Overview
- 13.2.10.2. Products
- 13.2.10.3. SWOT Analysis
- 13.2.10.4. Recent Developments
- 13.2.10.5. Financials (Based on Availability)
- 13.2.1 Pichai Fish Sauce Co Ltd
List of Figures
- Figure 1: Asia Pacific Fish Sauce Industry Revenue Breakdown (Million, %) by Product 2024 & 2032
- Figure 2: Asia Pacific Fish Sauce Industry Share (%) by Company 2024
List of Tables
- Table 1: Asia Pacific Fish Sauce Industry Revenue Million Forecast, by Region 2019 & 2032
- Table 2: Asia Pacific Fish Sauce Industry Revenue Million Forecast, by Product Type 2019 & 2032
- Table 3: Asia Pacific Fish Sauce Industry Revenue Million Forecast, by Composition 2019 & 2032
- Table 4: Asia Pacific Fish Sauce Industry Revenue Million Forecast, by End-User 2019 & 2032
- Table 5: Asia Pacific Fish Sauce Industry Revenue Million Forecast, by Region 2019 & 2032
- Table 6: Asia Pacific Fish Sauce Industry Revenue Million Forecast, by Country 2019 & 2032
- Table 7: China Asia Pacific Fish Sauce Industry Revenue (Million) Forecast, by Application 2019 & 2032
- Table 8: Japan Asia Pacific Fish Sauce Industry Revenue (Million) Forecast, by Application 2019 & 2032
- Table 9: India Asia Pacific Fish Sauce Industry Revenue (Million) Forecast, by Application 2019 & 2032
- Table 10: South Korea Asia Pacific Fish Sauce Industry Revenue (Million) Forecast, by Application 2019 & 2032
- Table 11: Taiwan Asia Pacific Fish Sauce Industry Revenue (Million) Forecast, by Application 2019 & 2032
- Table 12: Australia Asia Pacific Fish Sauce Industry Revenue (Million) Forecast, by Application 2019 & 2032
- Table 13: Rest of Asia-Pacific Asia Pacific Fish Sauce Industry Revenue (Million) Forecast, by Application 2019 & 2032
- Table 14: Asia Pacific Fish Sauce Industry Revenue Million Forecast, by Product Type 2019 & 2032
- Table 15: Asia Pacific Fish Sauce Industry Revenue Million Forecast, by Composition 2019 & 2032
- Table 16: Asia Pacific Fish Sauce Industry Revenue Million Forecast, by End-User 2019 & 2032
- Table 17: Asia Pacific Fish Sauce Industry Revenue Million Forecast, by Country 2019 & 2032
- Table 18: China Asia Pacific Fish Sauce Industry Revenue (Million) Forecast, by Application 2019 & 2032
- Table 19: Japan Asia Pacific Fish Sauce Industry Revenue (Million) Forecast, by Application 2019 & 2032
- Table 20: South Korea Asia Pacific Fish Sauce Industry Revenue (Million) Forecast, by Application 2019 & 2032
- Table 21: India Asia Pacific Fish Sauce Industry Revenue (Million) Forecast, by Application 2019 & 2032
- Table 22: Australia Asia Pacific Fish Sauce Industry Revenue (Million) Forecast, by Application 2019 & 2032
- Table 23: New Zealand Asia Pacific Fish Sauce Industry Revenue (Million) Forecast, by Application 2019 & 2032
- Table 24: Indonesia Asia Pacific Fish Sauce Industry Revenue (Million) Forecast, by Application 2019 & 2032
- Table 25: Malaysia Asia Pacific Fish Sauce Industry Revenue (Million) Forecast, by Application 2019 & 2032
- Table 26: Singapore Asia Pacific Fish Sauce Industry Revenue (Million) Forecast, by Application 2019 & 2032
- Table 27: Thailand Asia Pacific Fish Sauce Industry Revenue (Million) Forecast, by Application 2019 & 2032
- Table 28: Vietnam Asia Pacific Fish Sauce Industry Revenue (Million) Forecast, by Application 2019 & 2032
- Table 29: Philippines Asia Pacific Fish Sauce Industry Revenue (Million) Forecast, by Application 2019 & 2032
Frequently Asked Questions
1. What is the projected Compound Annual Growth Rate (CAGR) of the Asia Pacific Fish Sauce Industry?
The projected CAGR is approximately 6.28%.
2. Which companies are prominent players in the Asia Pacific Fish Sauce Industry?
Key companies in the market include Pichai Fish Sauce Co Ltd, Rungroj Fish Sauce Co Ltd, Jin Guan Foodstuff (fujian)Co Ltd, Hung Thanh Co Ltd, Masan Group, Rayong Fish Sauce Industry co ltd, Nam Phuong Food (Barona Vietnam)*List Not Exhaustive, Sin Guo Co (Pte) Ltd, Red Boat Fish Sauce, Tang Sang Hah Co Ltd.
3. What are the main segments of the Asia Pacific Fish Sauce Industry?
The market segments include Product Type, Composition, End-User.
4. Can you provide details about the market size?
The market size is estimated to be USD 6.23 Million as of 2022.
5. What are some drivers contributing to market growth?
Health Benefits Promoting Apple Cider Vinegar Demand; Unfiltered Apple Cider Vinegar Being Popular.
6. What are the notable trends driving market growth?
Rise in the Demand for Fortified Fish Sauce.
7. Are there any restraints impacting market growth?
Rising Demand for Other Vinegar Types.
8. Can you provide examples of recent developments in the market?
January 2023: Hoang Gia Fish Sauce launched new product sizes in the Australian market just in time for Lunar New Year 2023. In addition, the company has implemented several promotional strategies to increase sales and brand awareness, such as buy two get one free and combo offers. By introducing different product sizes, Hoang Gia fish sauce can cater to a broader range of customers who may have varying needs or preferences.
9. What pricing options are available for accessing the report?
Pricing options include single-user, multi-user, and enterprise licenses priced at USD 4750, USD 5250, and USD 8750 respectively.
10. Is the market size provided in terms of value or volume?
The market size is provided in terms of value, measured in Million.
11. Are there any specific market keywords associated with the report?
Yes, the market keyword associated with the report is "Asia Pacific Fish Sauce Industry," which aids in identifying and referencing the specific market segment covered.
12. How do I determine which pricing option suits my needs best?
The pricing options vary based on user requirements and access needs. Individual users may opt for single-user licenses, while businesses requiring broader access may choose multi-user or enterprise licenses for cost-effective access to the report.
13. Are there any additional resources or data provided in the Asia Pacific Fish Sauce Industry report?
While the report offers comprehensive insights, it's advisable to review the specific contents or supplementary materials provided to ascertain if additional resources or data are available.
14. How can I stay updated on further developments or reports in the Asia Pacific Fish Sauce Industry?
To stay informed about further developments, trends, and reports in the Asia Pacific Fish Sauce Industry, consider subscribing to industry newsletters, following relevant companies and organizations, or regularly checking reputable industry news sources and publications.
Methodology
Step 1 - Identification of Relevant Samples Size from Population Database


Step 2 - Approaches for Defining Global Market Size (Value, Volume* & Price*)

Note*: In applicable scenarios
Step 3 - Data Sources
Primary Research
- Web Analytics
- Survey Reports
- Research Institute
- Latest Research Reports
- Opinion Leaders
Secondary Research
- Annual Reports
- White Paper
- Latest Press Release
- Industry Association
- Paid Database
- Investor Presentations

Step 4 - Data Triangulation
Involves using different sources of information in order to increase the validity of a study
These sources are likely to be stakeholders in a program - participants, other researchers, program staff, other community members, and so on.
Then we put all data in single framework & apply various statistical tools to find out the dynamic on the market.
During the analysis stage, feedback from the stakeholder groups would be compared to determine areas of agreement as well as areas of divergence


