
Key Insights
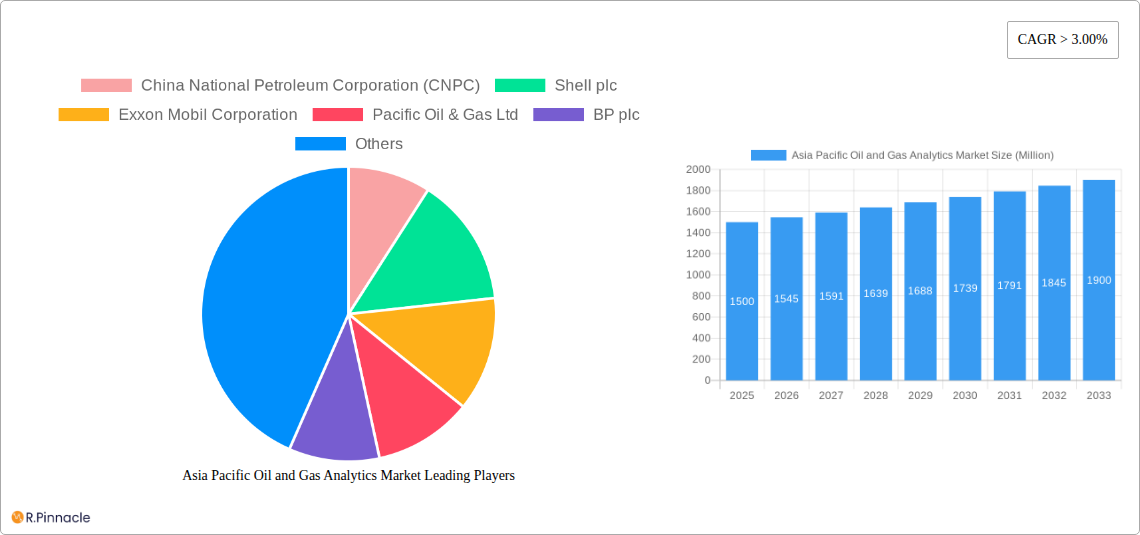
The Asia Pacific Oil and Gas Analytics market is experiencing robust growth, driven by increasing demand for efficient resource management, stringent environmental regulations, and the need for enhanced operational safety. The market's Compound Annual Growth Rate (CAGR) exceeding 3% indicates a consistent upward trajectory projected through 2033. Significant investments in digitalization across the upstream, midstream, and downstream sectors are fueling the adoption of advanced analytics solutions. This includes predictive maintenance, reservoir modeling, and optimized production planning, all aimed at improving operational efficiency and reducing costs. The onshore segment currently holds a larger market share compared to the offshore sector, reflecting the higher concentration of oil and gas activities on land within the region. However, the offshore segment is expected to witness significant growth driven by exploration and production activities in deepwater areas. Key players like China National Petroleum Corporation (CNPC), Shell, ExxonMobil, and others are actively investing in and deploying analytics solutions to gain a competitive edge. Growth is particularly strong in countries such as China, India, and Australia, reflecting their substantial oil and gas reserves and production levels. Challenges include data security concerns, the high cost of implementation, and the need for skilled professionals to operate and interpret complex analytics platforms.
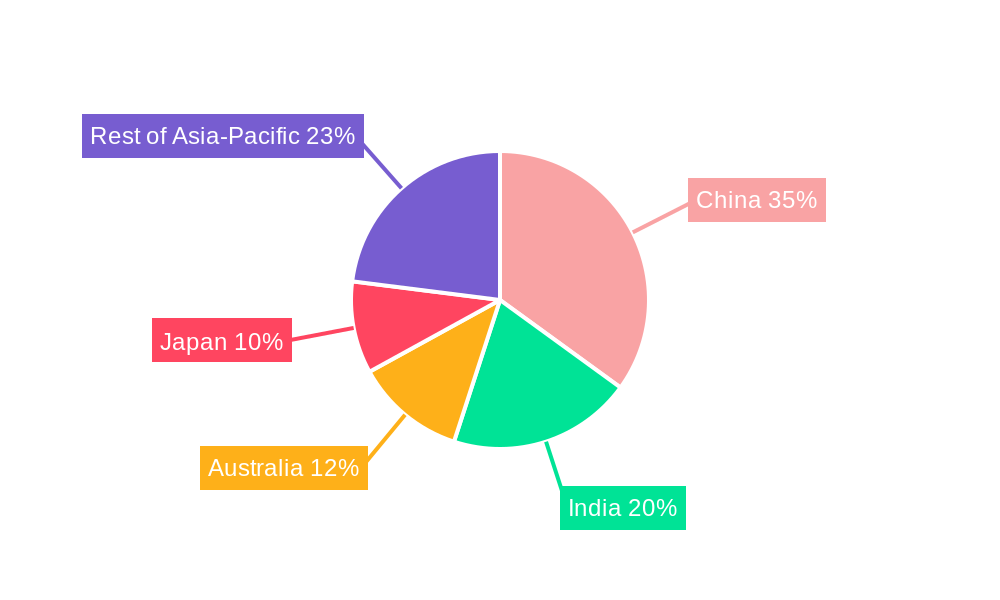
The market segmentation offers various opportunities for specialized vendors. Upstream analytics, focusing on exploration, production optimization, and reservoir management, is a major segment. Midstream solutions concentrate on pipeline monitoring, logistics optimization, and risk management, while downstream applications target refinery optimization, supply chain management, and retail sales forecasting. The regional distribution reflects the varying levels of oil and gas activity across the Asia-Pacific region. China, with its substantial domestic production and energy consumption, accounts for a significant market share, followed by India, Japan, and Australia. The continued growth in this market hinges on the success of technological advancements, favorable government policies supporting digitalization, and the ongoing need for increased operational efficiency and sustainability within the oil and gas industry.
Asia Pacific Oil & Gas Analytics Market Report: 2019-2033
This comprehensive report provides an in-depth analysis of the Asia Pacific Oil & Gas Analytics Market, offering invaluable insights for industry professionals, investors, and strategic decision-makers. The study covers the period from 2019 to 2033, with a base year of 2025 and a forecast period from 2025 to 2033. The market is segmented by sector (Upstream, Midstream, Downstream), location (Onshore, Offshore), and key players, including China National Petroleum Corporation (CNPC), Shell plc, Exxon Mobil Corporation, Pacific Oil & Gas Ltd, BP plc, Oil and Natural Gas Corporation (ONGC), Cairn Oil & Gas, Chevron Corporation, Equinor ASA, TotalEnergies SE, and others. The report projects a xx Million market value by 2033.
Asia Pacific Oil & Gas Analytics Market Structure & Innovation Trends
The Asia Pacific Oil & Gas Analytics market exhibits a moderately concentrated structure, with a few major players holding significant market share. The market share of CNPC is estimated at xx%, followed by Shell plc at xx%, and Exxon Mobil Corporation at xx%. However, numerous smaller players also contribute to market activity. Innovation is driven by the need for improved operational efficiency, enhanced safety measures, and sustainable practices within the oil and gas sector. Stringent regulatory frameworks, particularly concerning environmental protection and data security, significantly influence market dynamics. The increasing adoption of digital technologies, including AI, machine learning, and cloud computing, is creating new opportunities for innovation and efficiency gains. Substitute products, such as renewable energy sources, present a challenge, but the market remains robust due to persistent global demand.
- Market Concentration: Moderately concentrated, with top 3 players holding approximately xx% combined market share (estimated).
- Innovation Drivers: Improved efficiency, safety enhancement, sustainable practices, and digital technology adoption (AI, ML, Cloud).
- Regulatory Framework: Stringent environmental and data security regulations.
- Product Substitutes: Renewable energy sources pose a long-term challenge.
- M&A Activity: The market has witnessed xx major M&A deals in the past five years, with a total estimated value of xx Million. These deals largely focused on enhancing technological capabilities and expanding market reach.
Asia Pacific Oil & Gas Analytics Market Dynamics & Trends
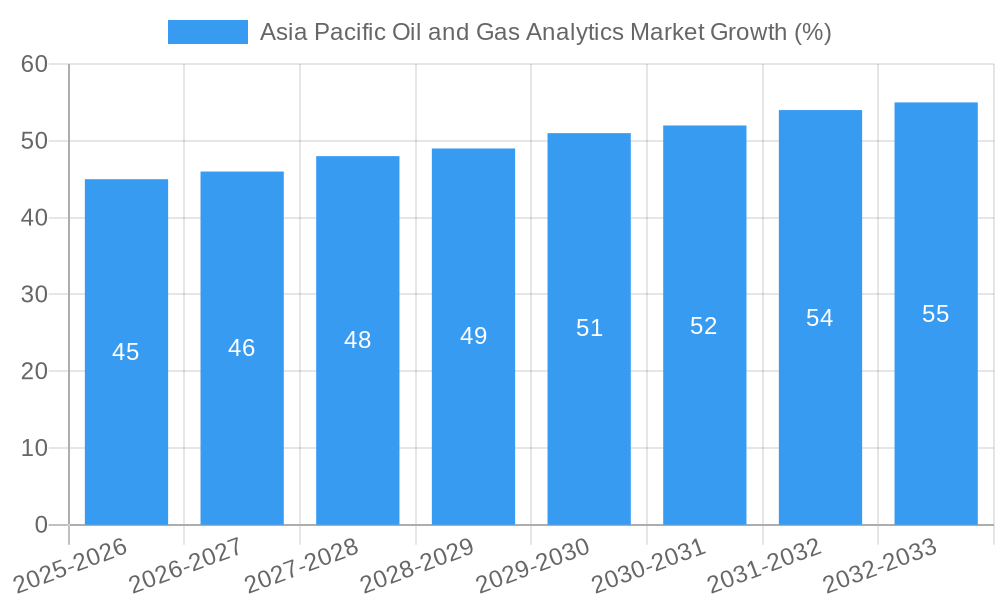
The Asia Pacific Oil & Gas Analytics market is experiencing robust growth, driven by factors such as rising energy demand, increasing investments in upstream and downstream operations, and the adoption of advanced analytics to optimize production and reduce costs. The market is projected to witness a CAGR of xx% during the forecast period (2025-2033). This growth is further fueled by technological disruptions, such as the implementation of the Internet of Things (IoT) and advanced data processing techniques. These technologies allow for real-time monitoring and analysis of operational data, leading to improved decision-making and operational efficiency. Consumer preferences are shifting towards sustainable practices, creating pressure on the oil and gas industry to adopt environment-friendly methods and improve transparency. This trend is driving the demand for analytics solutions that support these goals. Competitive dynamics are largely shaped by technological advancements and the ability to provide timely and insightful data analysis. Market penetration of analytics solutions is increasing steadily, with xx% of major oil and gas companies currently utilizing such solutions.
Dominant Regions & Segments in Asia Pacific Oil & Gas Analytics Market
The Upstream sector is currently the most dominant segment within the Asia Pacific Oil & Gas Analytics market, driven by the high investment in exploration and production activities across the region. China and Australia represent the leading countries in this segment. The Offshore segment demonstrates stronger growth than onshore, due to the increasing exploration and production activities in deepwater areas.
- Key Drivers for Upstream Dominance: High capital expenditure in exploration and production, increasing discoveries, and the need for sophisticated analytical tools for reservoir management.
- Key Drivers for Offshore Dominance: Deepwater discoveries, technological advancements in offshore operations, and increasing investment in offshore infrastructure.
- Key Drivers for China's dominance: Significant investment in domestic oil and gas exploration and production. Rapid economic growth driving energy demand.
- Key Drivers for Australia's dominance: Abundant natural gas resources, and strong government support for energy infrastructure development.
Asia Pacific Oil & Gas Analytics Market Product Innovations
Recent product innovations in the Asia Pacific Oil & Gas Analytics market focus on integrating advanced technologies such as artificial intelligence (AI), machine learning (ML), and cloud computing into existing analytical platforms. These innovations enable faster and more accurate data processing, predictive modeling, and real-time decision-making. The integration of these technologies provides significant competitive advantages, including improved operational efficiency, enhanced risk management, and optimized resource allocation. The market increasingly embraces solutions tailored for specific applications, such as reservoir modeling, production optimization, and pipeline monitoring, thus demonstrating strong market fit.
Report Scope & Segmentation Analysis
The report segments the Asia Pacific Oil & Gas Analytics market based on sector (Upstream, Midstream, Downstream) and location (Onshore, Offshore).
Upstream: This segment focuses on exploration, drilling, and production. It is expected to experience robust growth due to increasing investments in new projects and technological advancements. Competition is intense among service providers offering advanced analytics for reservoir management.
Midstream: This segment involves transportation and storage of oil and gas. Growth is driven by the need for efficient and secure logistics, with analytics playing a key role in pipeline management and optimization. The market exhibits a moderately competitive landscape with several established players.
Downstream: This segment comprises refining, processing, and distribution. The focus is on optimizing refinery operations and supply chain management through advanced analytics. Growth is driven by increased demand and the need for efficiency gains. The market is characterized by a combination of large multinational corporations and specialized analytics companies.
Onshore: This segment, while mature, is benefiting from technological advancements leading to improved extraction methods. Competition is driven by the availability of advanced analytics tailored for land-based operations.
Offshore: This segment is experiencing rapid growth due to investments in deepwater exploration and production. Technological innovation is key, with analytics playing a critical role in ensuring the safety and efficiency of operations. Competition is intense amongst providers of specialized offshore analytics solutions.
Key Drivers of Asia Pacific Oil & Gas Analytics Market Growth
The Asia Pacific Oil & Gas Analytics market is experiencing strong growth due to several key factors. Firstly, the increasing demand for energy across the region, coupled with limited domestic production in several countries, is driving investment in exploration and production activities. Secondly, the adoption of digital technologies, such as AI and machine learning, is creating opportunities for enhanced operational efficiency and optimized resource allocation. Finally, government regulations promoting energy efficiency and sustainability are fostering the adoption of advanced analytics solutions aimed at environmental protection and emission reduction.
Challenges in the Asia Pacific Oil & Gas Analytics Market Sector
Several challenges hinder the growth of the Asia Pacific Oil & Gas Analytics market. High implementation costs of advanced analytics solutions can pose a significant barrier to entry for smaller companies. Moreover, cybersecurity threats and data security concerns are paramount, demanding robust security measures to protect sensitive operational data. Finally, the lack of skilled professionals proficient in handling and interpreting complex analytical data can impede market growth.
Emerging Opportunities in Asia Pacific Oil and Gas Analytics Market
The Asia Pacific Oil & Gas Analytics market presents significant emerging opportunities. The increasing adoption of cloud-based analytics platforms offers scalability and cost-effectiveness. The growing demand for predictive maintenance and risk management solutions creates new market segments. Finally, the integration of IoT devices and sensors generates vast amounts of data, creating opportunities for advanced analytics applications.
Leading Players in the Asia Pacific Oil & Gas Analytics Market Market
- China National Petroleum Corporation (CNPC)
- Shell plc
- Exxon Mobil Corporation
- Pacific Oil & Gas Ltd
- BP plc
- Oil and Natural Gas Corporation (ONGC)
- Cairn Oil & Gas a vertical of Vedanta Limited
- Chevron Corporation
- Equinor ASA
- TotalEnergies SE
Key Developments in Asia Pacific Oil & Gas Analytics Market Industry
- April 2022: GAIL's joint venture aims to invest over INR 17,000 Million in CNG projects in West Bengal over the next five years, stimulating demand for analytics in the downstream sector.
- September 2021: The Indonesian government's USD 20.3 Million investment in oil and gas blocks indicates increased activity and potential demand for analytical support in exploration and production.
Future Outlook for Asia Pacific Oil & Gas Analytics Market Market
The future of the Asia Pacific Oil & Gas Analytics market appears bright, with continued growth driven by technological advancements, rising energy demand, and increasing investments in exploration and production activities. Strategic partnerships between analytics providers and oil and gas companies will likely be key to driving further market penetration. The focus on sustainability and the transition towards cleaner energy sources will also create new opportunities for analytics solutions that support environmentally friendly practices.
Asia Pacific Oil and Gas Analytics Market Segmentation
-
1. Sector
- 1.1. Upstream
- 1.2. Midstream
- 1.3. Downstream
-
2. Location
- 2.1. Onshore
- 2.2. Offshore
-
3. Geography
- 3.1. China
- 3.2. India
- 3.3. Indonesia
- 3.4. Australia
- 3.5. Rest of Asia Pacific
Asia Pacific Oil and Gas Analytics Market Segmentation By Geography
- 1. China
- 2. India
- 3. Indonesia
- 4. Australia
- 5. Rest of Asia Pacific
Asia Pacific Oil and Gas Analytics Market REPORT HIGHLIGHTS
| Aspects | Details |
|---|---|
| Study Period | 2019-2033 |
| Base Year | 2024 |
| Estimated Year | 2025 |
| Forecast Period | 2025-2033 |
| Historical Period | 2019-2024 |
| Growth Rate | CAGR of > 3.00% from 2019-2033 |
| Segmentation |
|
Table of Contents
- 1. Introduction
- 1.1. Research Scope
- 1.2. Market Segmentation
- 1.3. Research Methodology
- 1.4. Definitions and Assumptions
- 2. Executive Summary
- 2.1. Introduction
- 3. Market Dynamics
- 3.1. Introduction
- 3.2. Market Drivers
- 3.2.1. 4.; Surging Demand For Refined Petroleum Products4.; Significant Untapped Petroleum Reserves in the Sedimentary Basins
- 3.3. Market Restrains
- 3.3.1. 4.; High Volatility of Crude Oil Prices
- 3.4. Market Trends
- 3.4.1. Upstream is Expected to Dominate the Market
- 4. Market Factor Analysis
- 4.1. Porters Five Forces
- 4.2. Supply/Value Chain
- 4.3. PESTEL analysis
- 4.4. Market Entropy
- 4.5. Patent/Trademark Analysis
- 5. Asia Pacific Oil and Gas Analytics Market Analysis, Insights and Forecast, 2019-2031
- 5.1. Market Analysis, Insights and Forecast - by Sector
- 5.1.1. Upstream
- 5.1.2. Midstream
- 5.1.3. Downstream
- 5.2. Market Analysis, Insights and Forecast - by Location
- 5.2.1. Onshore
- 5.2.2. Offshore
- 5.3. Market Analysis, Insights and Forecast - by Geography
- 5.3.1. China
- 5.3.2. India
- 5.3.3. Indonesia
- 5.3.4. Australia
- 5.3.5. Rest of Asia Pacific
- 5.4. Market Analysis, Insights and Forecast - by Region
- 5.4.1. China
- 5.4.2. India
- 5.4.3. Indonesia
- 5.4.4. Australia
- 5.4.5. Rest of Asia Pacific
- 5.1. Market Analysis, Insights and Forecast - by Sector
- 6. China Asia Pacific Oil and Gas Analytics Market Analysis, Insights and Forecast, 2019-2031
- 6.1. Market Analysis, Insights and Forecast - by Sector
- 6.1.1. Upstream
- 6.1.2. Midstream
- 6.1.3. Downstream
- 6.2. Market Analysis, Insights and Forecast - by Location
- 6.2.1. Onshore
- 6.2.2. Offshore
- 6.3. Market Analysis, Insights and Forecast - by Geography
- 6.3.1. China
- 6.3.2. India
- 6.3.3. Indonesia
- 6.3.4. Australia
- 6.3.5. Rest of Asia Pacific
- 6.1. Market Analysis, Insights and Forecast - by Sector
- 7. India Asia Pacific Oil and Gas Analytics Market Analysis, Insights and Forecast, 2019-2031
- 7.1. Market Analysis, Insights and Forecast - by Sector
- 7.1.1. Upstream
- 7.1.2. Midstream
- 7.1.3. Downstream
- 7.2. Market Analysis, Insights and Forecast - by Location
- 7.2.1. Onshore
- 7.2.2. Offshore
- 7.3. Market Analysis, Insights and Forecast - by Geography
- 7.3.1. China
- 7.3.2. India
- 7.3.3. Indonesia
- 7.3.4. Australia
- 7.3.5. Rest of Asia Pacific
- 7.1. Market Analysis, Insights and Forecast - by Sector
- 8. Indonesia Asia Pacific Oil and Gas Analytics Market Analysis, Insights and Forecast, 2019-2031
- 8.1. Market Analysis, Insights and Forecast - by Sector
- 8.1.1. Upstream
- 8.1.2. Midstream
- 8.1.3. Downstream
- 8.2. Market Analysis, Insights and Forecast - by Location
- 8.2.1. Onshore
- 8.2.2. Offshore
- 8.3. Market Analysis, Insights and Forecast - by Geography
- 8.3.1. China
- 8.3.2. India
- 8.3.3. Indonesia
- 8.3.4. Australia
- 8.3.5. Rest of Asia Pacific
- 8.1. Market Analysis, Insights and Forecast - by Sector
- 9. Australia Asia Pacific Oil and Gas Analytics Market Analysis, Insights and Forecast, 2019-2031
- 9.1. Market Analysis, Insights and Forecast - by Sector
- 9.1.1. Upstream
- 9.1.2. Midstream
- 9.1.3. Downstream
- 9.2. Market Analysis, Insights and Forecast - by Location
- 9.2.1. Onshore
- 9.2.2. Offshore
- 9.3. Market Analysis, Insights and Forecast - by Geography
- 9.3.1. China
- 9.3.2. India
- 9.3.3. Indonesia
- 9.3.4. Australia
- 9.3.5. Rest of Asia Pacific
- 9.1. Market Analysis, Insights and Forecast - by Sector
- 10. Rest of Asia Pacific Asia Pacific Oil and Gas Analytics Market Analysis, Insights and Forecast, 2019-2031
- 10.1. Market Analysis, Insights and Forecast - by Sector
- 10.1.1. Upstream
- 10.1.2. Midstream
- 10.1.3. Downstream
- 10.2. Market Analysis, Insights and Forecast - by Location
- 10.2.1. Onshore
- 10.2.2. Offshore
- 10.3. Market Analysis, Insights and Forecast - by Geography
- 10.3.1. China
- 10.3.2. India
- 10.3.3. Indonesia
- 10.3.4. Australia
- 10.3.5. Rest of Asia Pacific
- 10.1. Market Analysis, Insights and Forecast - by Sector
- 11. China Asia Pacific Oil and Gas Analytics Market Analysis, Insights and Forecast, 2019-2031
- 12. Japan Asia Pacific Oil and Gas Analytics Market Analysis, Insights and Forecast, 2019-2031
- 13. India Asia Pacific Oil and Gas Analytics Market Analysis, Insights and Forecast, 2019-2031
- 14. South Korea Asia Pacific Oil and Gas Analytics Market Analysis, Insights and Forecast, 2019-2031
- 15. Taiwan Asia Pacific Oil and Gas Analytics Market Analysis, Insights and Forecast, 2019-2031
- 16. Australia Asia Pacific Oil and Gas Analytics Market Analysis, Insights and Forecast, 2019-2031
- 17. Rest of Asia-Pacific Asia Pacific Oil and Gas Analytics Market Analysis, Insights and Forecast, 2019-2031
- 18. Competitive Analysis
- 18.1. Market Share Analysis 2024
- 18.2. Company Profiles
- 18.2.1 China National Petroleum Corporation (CNPC)
- 18.2.1.1. Overview
- 18.2.1.2. Products
- 18.2.1.3. SWOT Analysis
- 18.2.1.4. Recent Developments
- 18.2.1.5. Financials (Based on Availability)
- 18.2.2 Shell plc
- 18.2.2.1. Overview
- 18.2.2.2. Products
- 18.2.2.3. SWOT Analysis
- 18.2.2.4. Recent Developments
- 18.2.2.5. Financials (Based on Availability)
- 18.2.3 Exxon Mobil Corporation
- 18.2.3.1. Overview
- 18.2.3.2. Products
- 18.2.3.3. SWOT Analysis
- 18.2.3.4. Recent Developments
- 18.2.3.5. Financials (Based on Availability)
- 18.2.4 Pacific Oil & Gas Ltd
- 18.2.4.1. Overview
- 18.2.4.2. Products
- 18.2.4.3. SWOT Analysis
- 18.2.4.4. Recent Developments
- 18.2.4.5. Financials (Based on Availability)
- 18.2.5 BP plc
- 18.2.5.1. Overview
- 18.2.5.2. Products
- 18.2.5.3. SWOT Analysis
- 18.2.5.4. Recent Developments
- 18.2.5.5. Financials (Based on Availability)
- 18.2.6 Oil and Natural Gas Corporation (ONGC)
- 18.2.6.1. Overview
- 18.2.6.2. Products
- 18.2.6.3. SWOT Analysis
- 18.2.6.4. Recent Developments
- 18.2.6.5. Financials (Based on Availability)
- 18.2.7 Cairn Oil & Gas a vertical of Vedanta Limited
- 18.2.7.1. Overview
- 18.2.7.2. Products
- 18.2.7.3. SWOT Analysis
- 18.2.7.4. Recent Developments
- 18.2.7.5. Financials (Based on Availability)
- 18.2.8 Chevron Corporation
- 18.2.8.1. Overview
- 18.2.8.2. Products
- 18.2.8.3. SWOT Analysis
- 18.2.8.4. Recent Developments
- 18.2.8.5. Financials (Based on Availability)
- 18.2.9 Equinor ASA*List Not Exhaustive
- 18.2.9.1. Overview
- 18.2.9.2. Products
- 18.2.9.3. SWOT Analysis
- 18.2.9.4. Recent Developments
- 18.2.9.5. Financials (Based on Availability)
- 18.2.10 TotalEnergies SE
- 18.2.10.1. Overview
- 18.2.10.2. Products
- 18.2.10.3. SWOT Analysis
- 18.2.10.4. Recent Developments
- 18.2.10.5. Financials (Based on Availability)
- 18.2.1 China National Petroleum Corporation (CNPC)
List of Figures
- Figure 1: Asia Pacific Oil and Gas Analytics Market Revenue Breakdown (Million, %) by Product 2024 & 2032
- Figure 2: Asia Pacific Oil and Gas Analytics Market Share (%) by Company 2024
List of Tables
- Table 1: Asia Pacific Oil and Gas Analytics Market Revenue Million Forecast, by Region 2019 & 2032
- Table 2: Asia Pacific Oil and Gas Analytics Market Revenue Million Forecast, by Sector 2019 & 2032
- Table 3: Asia Pacific Oil and Gas Analytics Market Revenue Million Forecast, by Location 2019 & 2032
- Table 4: Asia Pacific Oil and Gas Analytics Market Revenue Million Forecast, by Geography 2019 & 2032
- Table 5: Asia Pacific Oil and Gas Analytics Market Revenue Million Forecast, by Region 2019 & 2032
- Table 6: Asia Pacific Oil and Gas Analytics Market Revenue Million Forecast, by Country 2019 & 2032
- Table 7: China Asia Pacific Oil and Gas Analytics Market Revenue (Million) Forecast, by Application 2019 & 2032
- Table 8: Japan Asia Pacific Oil and Gas Analytics Market Revenue (Million) Forecast, by Application 2019 & 2032
- Table 9: India Asia Pacific Oil and Gas Analytics Market Revenue (Million) Forecast, by Application 2019 & 2032
- Table 10: South Korea Asia Pacific Oil and Gas Analytics Market Revenue (Million) Forecast, by Application 2019 & 2032
- Table 11: Taiwan Asia Pacific Oil and Gas Analytics Market Revenue (Million) Forecast, by Application 2019 & 2032
- Table 12: Australia Asia Pacific Oil and Gas Analytics Market Revenue (Million) Forecast, by Application 2019 & 2032
- Table 13: Rest of Asia-Pacific Asia Pacific Oil and Gas Analytics Market Revenue (Million) Forecast, by Application 2019 & 2032
- Table 14: Asia Pacific Oil and Gas Analytics Market Revenue Million Forecast, by Sector 2019 & 2032
- Table 15: Asia Pacific Oil and Gas Analytics Market Revenue Million Forecast, by Location 2019 & 2032
- Table 16: Asia Pacific Oil and Gas Analytics Market Revenue Million Forecast, by Geography 2019 & 2032
- Table 17: Asia Pacific Oil and Gas Analytics Market Revenue Million Forecast, by Country 2019 & 2032
- Table 18: Asia Pacific Oil and Gas Analytics Market Revenue Million Forecast, by Sector 2019 & 2032
- Table 19: Asia Pacific Oil and Gas Analytics Market Revenue Million Forecast, by Location 2019 & 2032
- Table 20: Asia Pacific Oil and Gas Analytics Market Revenue Million Forecast, by Geography 2019 & 2032
- Table 21: Asia Pacific Oil and Gas Analytics Market Revenue Million Forecast, by Country 2019 & 2032
- Table 22: Asia Pacific Oil and Gas Analytics Market Revenue Million Forecast, by Sector 2019 & 2032
- Table 23: Asia Pacific Oil and Gas Analytics Market Revenue Million Forecast, by Location 2019 & 2032
- Table 24: Asia Pacific Oil and Gas Analytics Market Revenue Million Forecast, by Geography 2019 & 2032
- Table 25: Asia Pacific Oil and Gas Analytics Market Revenue Million Forecast, by Country 2019 & 2032
- Table 26: Asia Pacific Oil and Gas Analytics Market Revenue Million Forecast, by Sector 2019 & 2032
- Table 27: Asia Pacific Oil and Gas Analytics Market Revenue Million Forecast, by Location 2019 & 2032
- Table 28: Asia Pacific Oil and Gas Analytics Market Revenue Million Forecast, by Geography 2019 & 2032
- Table 29: Asia Pacific Oil and Gas Analytics Market Revenue Million Forecast, by Country 2019 & 2032
- Table 30: Asia Pacific Oil and Gas Analytics Market Revenue Million Forecast, by Sector 2019 & 2032
- Table 31: Asia Pacific Oil and Gas Analytics Market Revenue Million Forecast, by Location 2019 & 2032
- Table 32: Asia Pacific Oil and Gas Analytics Market Revenue Million Forecast, by Geography 2019 & 2032
- Table 33: Asia Pacific Oil and Gas Analytics Market Revenue Million Forecast, by Country 2019 & 2032
Frequently Asked Questions
1. What is the projected Compound Annual Growth Rate (CAGR) of the Asia Pacific Oil and Gas Analytics Market?
The projected CAGR is approximately > 3.00%.
2. Which companies are prominent players in the Asia Pacific Oil and Gas Analytics Market?
Key companies in the market include China National Petroleum Corporation (CNPC), Shell plc, Exxon Mobil Corporation, Pacific Oil & Gas Ltd, BP plc, Oil and Natural Gas Corporation (ONGC), Cairn Oil & Gas a vertical of Vedanta Limited, Chevron Corporation, Equinor ASA*List Not Exhaustive, TotalEnergies SE.
3. What are the main segments of the Asia Pacific Oil and Gas Analytics Market?
The market segments include Sector, Location, Geography.
4. Can you provide details about the market size?
The market size is estimated to be USD XX Million as of 2022.
5. What are some drivers contributing to market growth?
4.; Surging Demand For Refined Petroleum Products4.; Significant Untapped Petroleum Reserves in the Sedimentary Basins.
6. What are the notable trends driving market growth?
Upstream is Expected to Dominate the Market.
7. Are there any restraints impacting market growth?
4.; High Volatility of Crude Oil Prices.
8. Can you provide examples of recent developments in the market?
In April 2022, GAIL announced that its joint venture company Bengal Gas Co and Hindustan Petroleum Corporation Ltd. aims to invest more than INR 17,000 in various CNG projects in West Bengal will be over the next five years.
9. What pricing options are available for accessing the report?
Pricing options include single-user, multi-user, and enterprise licenses priced at USD 4750, USD 5250, and USD 8750 respectively.
10. Is the market size provided in terms of value or volume?
The market size is provided in terms of value, measured in Million.
11. Are there any specific market keywords associated with the report?
Yes, the market keyword associated with the report is "Asia Pacific Oil and Gas Analytics Market," which aids in identifying and referencing the specific market segment covered.
12. How do I determine which pricing option suits my needs best?
The pricing options vary based on user requirements and access needs. Individual users may opt for single-user licenses, while businesses requiring broader access may choose multi-user or enterprise licenses for cost-effective access to the report.
13. Are there any additional resources or data provided in the Asia Pacific Oil and Gas Analytics Market report?
While the report offers comprehensive insights, it's advisable to review the specific contents or supplementary materials provided to ascertain if additional resources or data are available.
14. How can I stay updated on further developments or reports in the Asia Pacific Oil and Gas Analytics Market?
To stay informed about further developments, trends, and reports in the Asia Pacific Oil and Gas Analytics Market, consider subscribing to industry newsletters, following relevant companies and organizations, or regularly checking reputable industry news sources and publications.
Methodology
Step 1 - Identification of Relevant Samples Size from Population Database


Step 2 - Approaches for Defining Global Market Size (Value, Volume* & Price*)

Note*: In applicable scenarios
Step 3 - Data Sources
Primary Research
- Web Analytics
- Survey Reports
- Research Institute
- Latest Research Reports
- Opinion Leaders
Secondary Research
- Annual Reports
- White Paper
- Latest Press Release
- Industry Association
- Paid Database
- Investor Presentations

Step 4 - Data Triangulation
Involves using different sources of information in order to increase the validity of a study
These sources are likely to be stakeholders in a program - participants, other researchers, program staff, other community members, and so on.
Then we put all data in single framework & apply various statistical tools to find out the dynamic on the market.
During the analysis stage, feedback from the stakeholder groups would be compared to determine areas of agreement as well as areas of divergence


