
Key Insights
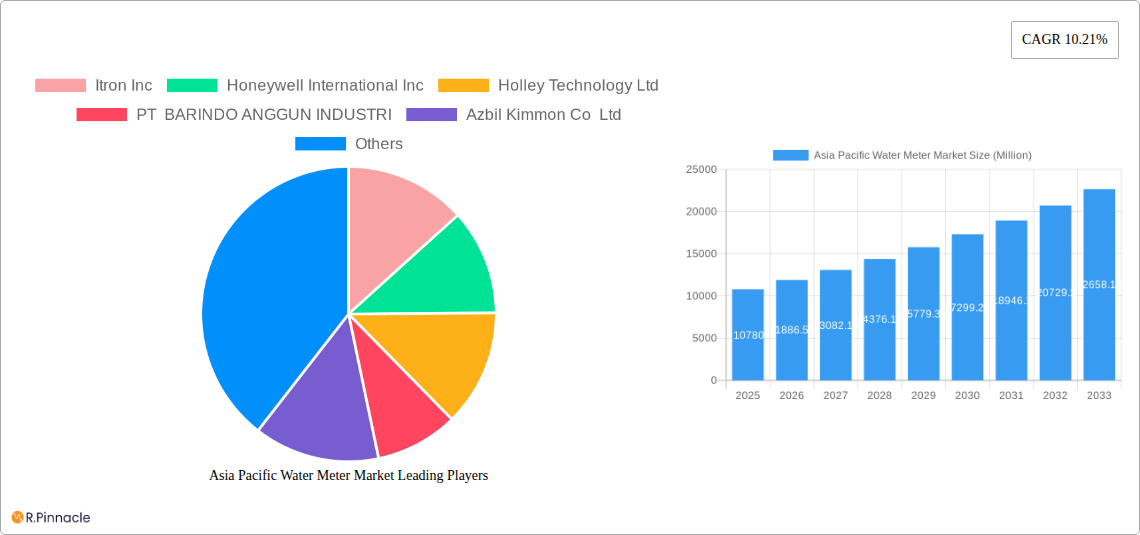
The Asia-Pacific water meter market, valued at $10.78 billion in 2025, is projected to experience robust growth, driven by increasing urbanization, aging water infrastructure, and the rising need for efficient water resource management. Governments across the region are investing heavily in upgrading water distribution networks and implementing smart water management solutions, fueling demand for both basic and smart water meters. The market is segmented by country (China, India, Japan, South Korea, Indonesia, and the Rest of Asia-Pacific), type (basic and smart meters), and application (industrial and water utilities). China and India are expected to dominate the market due to their large populations and significant infrastructure development projects. The increasing adoption of smart water meters, offering real-time data monitoring and leak detection capabilities, is a key trend shaping market growth. However, high initial investment costs associated with smart meter deployment and technological challenges in remote areas could pose restraints. The market is characterized by a mix of established multinational companies and regional players, leading to intense competition and innovation. The forecast period (2025-2033) anticipates a continuation of this growth trajectory, driven by consistent government investments and technological advancements.
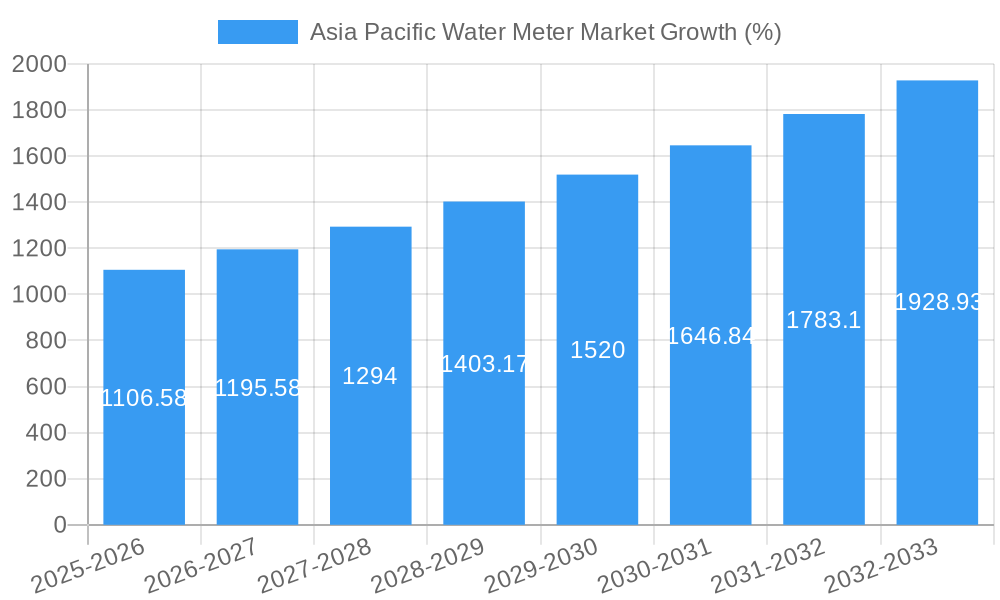
The high CAGR of 10.21% suggests substantial growth potential. This growth is fueled by factors such as the increasing awareness of water conservation, the rising demand for accurate water billing, and the increasing adoption of IoT-enabled smart water metering systems for better water management and loss reduction. The segmentation reveals that smart meters are expected to witness faster growth compared to basic meters, reflecting a shift towards advanced technologies. Similarly, the industrial segment is projected to experience stronger growth than the water utilities segment, driven by the growing need for efficient water management in various industrial processes. Competition among major players is expected to remain fierce, pushing further innovation and potentially leading to price reductions, which could further stimulate market expansion.
Asia Pacific Water Meter Market Report: 2019-2033
This comprehensive report provides an in-depth analysis of the Asia Pacific water meter market, offering actionable insights for industry professionals and investors. With a study period spanning 2019-2033, a base year of 2025, and a forecast period of 2025-2033, this report delivers a complete picture of market dynamics, growth drivers, and future opportunities. The market is segmented by country (China, India, Japan, South Korea, Indonesia, and Rest of Asia-Pacific), type (Basic Meters, Smart Meters), and application (Industrial, Water Utilities). Key players like Itron Inc, Honeywell International Inc, and Holley Technology Ltd are analyzed for their market share and strategic initiatives. The report also highlights significant industry developments, providing a clear understanding of the market's trajectory. The total market size in 2025 is estimated at xx Million.
Asia Pacific Water Meter Market Structure & Innovation Trends
The Asia Pacific water meter market exhibits a moderately concentrated structure with key players holding significant market shares. Itron Inc., Honeywell International Inc., and Holley Technology Ltd. are among the leading players, collectively accounting for an estimated xx% of the market in 2025. Market concentration is influenced by factors such as technological advancements, economies of scale, and regulatory policies.
Innovation Drivers:
- Smart Meter Technology: The increasing adoption of smart meters, driven by the need for improved water management and reduced water loss, is a major innovation driver.
- IoT Integration: Integration of water meters with the Internet of Things (IoT) enables real-time data monitoring and remote management, enhancing efficiency and reducing operational costs.
- Advanced Metering Infrastructure (AMI): AMI systems provide comprehensive data management capabilities, improving water resource planning and distribution optimization.
Regulatory Frameworks: Government initiatives promoting water conservation and efficient water management are creating a favorable regulatory environment for water meter adoption. Stringent regulations on water loss reduction are further driving market growth.
Product Substitutes: While no direct substitutes exist for water meters, alternative water management strategies, such as improved infrastructure and leak detection technologies, can partially offset market demand.
End-User Demographics: The key end-users are water utilities, industrial facilities, and residential consumers. The growth in urban populations and industrialization is expanding the market for water meters.
M&A Activities: While specific M&A deal values are not publicly available for all transactions in this market, the increasing consolidation among market players suggests significant investment in market expansion and technological advancements. The number of mergers and acquisitions in the last 5 years is estimated to be xx.
Asia Pacific Water Meter Market Dynamics & Trends
The Asia Pacific water meter market is experiencing robust growth, driven by several key factors. The market is projected to witness a CAGR of xx% during the forecast period (2025-2033). This growth is fueled by increasing urbanization, rising water scarcity concerns, and government initiatives promoting efficient water management. Technological advancements, such as the adoption of smart meters and IoT integration, are further driving market expansion.
Technological disruptions, particularly the widespread adoption of smart meters, are revolutionizing the water metering landscape. Smart meters offer numerous advantages over traditional basic meters, including real-time data monitoring, remote meter reading, and leak detection capabilities. This leads to improved water management efficiency, reduced water loss, and better revenue collection for water utilities. Consumer preferences are shifting towards smart meters due to their convenience and ability to monitor water consumption. Competitive dynamics are characterized by both established players and emerging technology providers vying for market share. The market penetration of smart meters is steadily increasing, with xx% of the total market expected to be smart meters by 2033.
Dominant Regions & Segments in Asia Pacific Water Meter Market
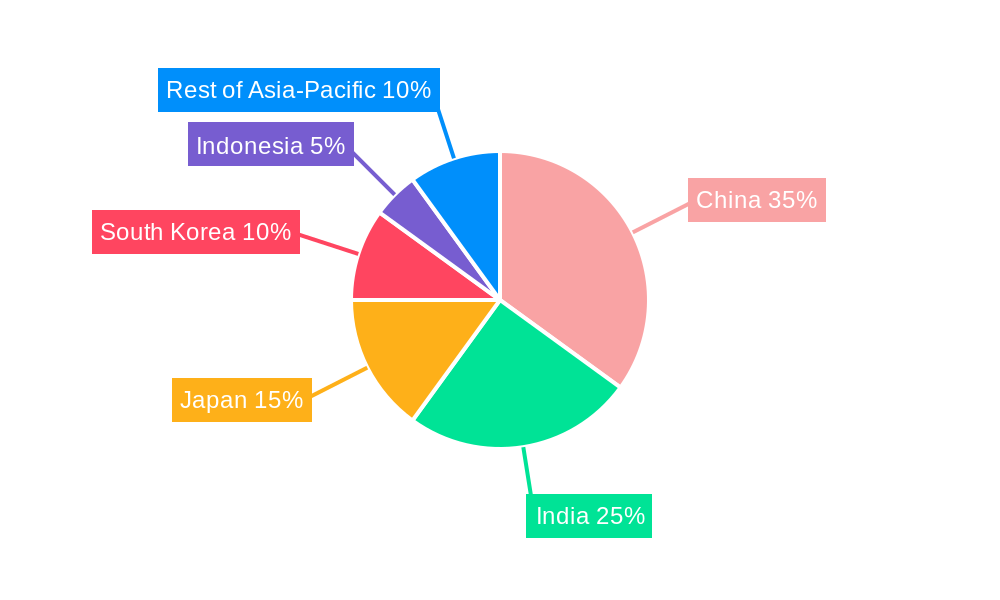
Dominant Region: China is currently the dominant region in the Asia Pacific water meter market due to its large population, rapid urbanization, and significant investments in water infrastructure.
Dominant Country: China maintains its position as the leading country in the market due to its substantial water infrastructure development and increasing adoption of smart metering technologies.
Dominant Segment (By Type): Smart meters are experiencing faster growth compared to basic meters.
Dominant Segment (By Application): The Water Utilities segment dominates the market due to the large-scale deployment of water meters by water utility companies.
Key Drivers:
- China: Massive investments in water infrastructure, government support for smart city initiatives, and increasing urbanization.
- India: Growing awareness of water scarcity, government programs promoting water conservation, and increasing private sector participation.
- Japan: High level of technological advancement, focus on water efficiency, and well-established water infrastructure.
- South Korea: Similar to Japan, a focus on technological advancement and efficient water management.
- Indonesia: Growing urbanization and the need for improved water management infrastructure.
- Rest of Asia-Pacific: Varying levels of development and adoption of water metering technologies.
Asia Pacific Water Meter Market Product Innovations
Recent innovations in the Asia Pacific water meter market are focused on enhancing functionality, improving data accuracy, and lowering costs. The integration of advanced sensors, communication technologies (like LoRaWAN), and data analytics capabilities is creating smart meters with enhanced capabilities for leak detection, remote monitoring, and improved billing accuracy. These advancements are improving the market fit of smart meters, making them increasingly attractive to water utilities seeking to optimize their operations and improve service delivery. The development of low-power, long-range communication technologies further enhances the scalability and cost-effectiveness of smart water metering systems.
Report Scope & Segmentation Analysis
By Country: The report provides detailed analysis of the water meter market in China, India, Japan, South Korea, Indonesia, and the Rest of Asia-Pacific, including market size, growth projections, and competitive dynamics for each region.
By Type: The market is segmented into Basic Meters and Smart Meters, with separate analysis of their market sizes, growth projections, and key players. Smart meters show stronger growth prospects due to technological advancements and increasing demand for efficient water management.
By Application: The report analyzes the market across Industrial and Water Utilities applications, highlighting market size, growth projections, and specific drivers for each segment. The Water Utilities segment is projected to dominate the market due to large-scale deployments.
Key Drivers of Asia Pacific Water Meter Market Growth
The Asia Pacific water meter market is primarily driven by increasing urbanization, growing water scarcity, and government initiatives promoting water conservation. Technological advancements in smart meters, offering superior functionalities, are also contributing significantly to market growth. Furthermore, stringent regulations to reduce non-revenue water are driving the adoption of advanced metering infrastructure (AMI) and smart water metering systems. The increasing adoption of IoT and advanced analytics further enhances the effectiveness of water management, fueling market growth.
Challenges in the Asia Pacific Water Meter Market Sector
Challenges facing the Asia Pacific water meter market include high initial investment costs for smart meter deployments, particularly in developing economies. Inconsistent infrastructure in some regions can hinder the widespread adoption of smart meters. Supply chain disruptions and the dependence on imported components pose additional challenges. Competition among established players and emerging technology providers can also impact market growth. The total impact of these challenges is estimated to reduce the market growth by xx% in 2026.
Emerging Opportunities in Asia Pacific Water Meter Market
The Asia Pacific water meter market presents several emerging opportunities. The expansion of smart city initiatives across the region presents significant growth potential for smart water metering solutions. The increasing demand for data-driven insights in water management is creating opportunities for advanced analytics and IoT-based solutions. The development of low-cost, energy-efficient smart meters will further expand market reach, particularly in developing economies.
Leading Players in the Asia Pacific Water Meter Market Market
- Itron Inc
- Honeywell International Inc
- Holley Technology Ltd
- PT BARINDO ANGGUN INDUSTRI
- Azbil Kimmon Co Ltd
- Arad Group
- Diehl Stiftung & Co KG
- ASMA Industrial Corporation
- Adept Fluidyne Pvt Ltd
- UPC Instruments Pvt Ltd
- Aichi Tokei Denki Co Ltd
Key Developments in Asia Pacific Water Meter Market Industry
- November 2022: A Union Housing and Urban Affairs Ministry team proposed installing 2.8 lakh smart water meters in Aurangabad, Maharashtra, India, as part of a new water pipeline scheme, highlighting the growing adoption of smart meters in large-scale projects.
- May 2022: Semtech Corporation partnered with Cranberry Analytics to integrate LoRaWAN technology into ultrasonic water meters in India, demonstrating the increasing integration of IoT technologies in water metering. This initiative was adopted by the Panaji Municipal Corporation for its benefits in data communication and cost reduction.
- March 2022: A public-private partnership in Lahore, Pakistan, resulted in a contract to deploy 711,000 smart water meters, showcasing the increasing role of PPPs in driving smart meter adoption.
Future Outlook for Asia Pacific Water Meter Market Market
The Asia Pacific water meter market is poised for continued growth, driven by sustained investments in water infrastructure, increasing urbanization, and the ongoing adoption of smart metering technologies. The market will continue to witness innovation in areas such as IoT integration, data analytics, and advanced communication technologies. The focus on water conservation and efficient water management will further drive demand for advanced metering solutions. Strategic partnerships and collaborations between technology providers and water utilities are expected to accelerate market growth in the coming years.
Asia Pacific Water Meter Market Segmentation
-
1. Type
- 1.1. Basic Meters
- 1.2. Smart Meters
-
2. Application
- 2.1. Industrial
- 2.2. Water Utilities
Asia Pacific Water Meter Market Segmentation By Geography
-
1. Asia Pacific
- 1.1. China
- 1.2. Japan
- 1.3. South Korea
- 1.4. India
- 1.5. Australia
- 1.6. New Zealand
- 1.7. Indonesia
- 1.8. Malaysia
- 1.9. Singapore
- 1.10. Thailand
- 1.11. Vietnam
- 1.12. Philippines
Asia Pacific Water Meter Market REPORT HIGHLIGHTS
| Aspects | Details |
|---|---|
| Study Period | 2019-2033 |
| Base Year | 2024 |
| Estimated Year | 2025 |
| Forecast Period | 2025-2033 |
| Historical Period | 2019-2024 |
| Growth Rate | CAGR of 10.21% from 2019-2033 |
| Segmentation |
|
Table of Contents
- 1. Introduction
- 1.1. Research Scope
- 1.2. Market Segmentation
- 1.3. Research Methodology
- 1.4. Definitions and Assumptions
- 2. Executive Summary
- 2.1. Introduction
- 3. Market Dynamics
- 3.1. Introduction
- 3.2. Market Drivers
- 3.2.1. Need for Improvement in Utility Usage and Efficiency; Growing Awareness on the Wastage of Water and Supportive Regulations
- 3.3. Market Restrains
- 3.3.1. Reluctance/Lack of Awareness to Use Self-Checkout Systems
- 3.4. Market Trends
- 3.4.1. Installation of Smart Meters to Grow Significantly
- 4. Market Factor Analysis
- 4.1. Porters Five Forces
- 4.2. Supply/Value Chain
- 4.3. PESTEL analysis
- 4.4. Market Entropy
- 4.5. Patent/Trademark Analysis
- 5. Asia Pacific Water Meter Market Analysis, Insights and Forecast, 2019-2031
- 5.1. Market Analysis, Insights and Forecast - by Type
- 5.1.1. Basic Meters
- 5.1.2. Smart Meters
- 5.2. Market Analysis, Insights and Forecast - by Application
- 5.2.1. Industrial
- 5.2.2. Water Utilities
- 5.3. Market Analysis, Insights and Forecast - by Region
- 5.3.1. Asia Pacific
- 5.1. Market Analysis, Insights and Forecast - by Type
- 6. China Asia Pacific Water Meter Market Analysis, Insights and Forecast, 2019-2031
- 7. Japan Asia Pacific Water Meter Market Analysis, Insights and Forecast, 2019-2031
- 8. India Asia Pacific Water Meter Market Analysis, Insights and Forecast, 2019-2031
- 9. South Korea Asia Pacific Water Meter Market Analysis, Insights and Forecast, 2019-2031
- 10. Taiwan Asia Pacific Water Meter Market Analysis, Insights and Forecast, 2019-2031
- 11. Australia Asia Pacific Water Meter Market Analysis, Insights and Forecast, 2019-2031
- 12. Rest of Asia-Pacific Asia Pacific Water Meter Market Analysis, Insights and Forecast, 2019-2031
- 13. Competitive Analysis
- 13.1. Market Share Analysis 2024
- 13.2. Company Profiles
- 13.2.1 Itron Inc
- 13.2.1.1. Overview
- 13.2.1.2. Products
- 13.2.1.3. SWOT Analysis
- 13.2.1.4. Recent Developments
- 13.2.1.5. Financials (Based on Availability)
- 13.2.2 Honeywell International Inc
- 13.2.2.1. Overview
- 13.2.2.2. Products
- 13.2.2.3. SWOT Analysis
- 13.2.2.4. Recent Developments
- 13.2.2.5. Financials (Based on Availability)
- 13.2.3 Holley Technology Ltd
- 13.2.3.1. Overview
- 13.2.3.2. Products
- 13.2.3.3. SWOT Analysis
- 13.2.3.4. Recent Developments
- 13.2.3.5. Financials (Based on Availability)
- 13.2.4 PT BARINDO ANGGUN INDUSTRI
- 13.2.4.1. Overview
- 13.2.4.2. Products
- 13.2.4.3. SWOT Analysis
- 13.2.4.4. Recent Developments
- 13.2.4.5. Financials (Based on Availability)
- 13.2.5 Azbil Kimmon Co Ltd
- 13.2.5.1. Overview
- 13.2.5.2. Products
- 13.2.5.3. SWOT Analysis
- 13.2.5.4. Recent Developments
- 13.2.5.5. Financials (Based on Availability)
- 13.2.6 Arad Group
- 13.2.6.1. Overview
- 13.2.6.2. Products
- 13.2.6.3. SWOT Analysis
- 13.2.6.4. Recent Developments
- 13.2.6.5. Financials (Based on Availability)
- 13.2.7 Diehl Stiftung & Co KG
- 13.2.7.1. Overview
- 13.2.7.2. Products
- 13.2.7.3. SWOT Analysis
- 13.2.7.4. Recent Developments
- 13.2.7.5. Financials (Based on Availability)
- 13.2.8 ASMA Industrial Corporation
- 13.2.8.1. Overview
- 13.2.8.2. Products
- 13.2.8.3. SWOT Analysis
- 13.2.8.4. Recent Developments
- 13.2.8.5. Financials (Based on Availability)
- 13.2.9 Adept Fluidyne Pvt Ltd
- 13.2.9.1. Overview
- 13.2.9.2. Products
- 13.2.9.3. SWOT Analysis
- 13.2.9.4. Recent Developments
- 13.2.9.5. Financials (Based on Availability)
- 13.2.10 UPC Instruments Pvt Ltd
- 13.2.10.1. Overview
- 13.2.10.2. Products
- 13.2.10.3. SWOT Analysis
- 13.2.10.4. Recent Developments
- 13.2.10.5. Financials (Based on Availability)
- 13.2.11 Aichi Tokei Denki Co Ltd
- 13.2.11.1. Overview
- 13.2.11.2. Products
- 13.2.11.3. SWOT Analysis
- 13.2.11.4. Recent Developments
- 13.2.11.5. Financials (Based on Availability)
- 13.2.1 Itron Inc
List of Figures
- Figure 1: Asia Pacific Water Meter Market Revenue Breakdown (Million, %) by Product 2024 & 2032
- Figure 2: Asia Pacific Water Meter Market Share (%) by Company 2024
List of Tables
- Table 1: Asia Pacific Water Meter Market Revenue Million Forecast, by Region 2019 & 2032
- Table 2: Asia Pacific Water Meter Market Volume K Unit Forecast, by Region 2019 & 2032
- Table 3: Asia Pacific Water Meter Market Revenue Million Forecast, by Type 2019 & 2032
- Table 4: Asia Pacific Water Meter Market Volume K Unit Forecast, by Type 2019 & 2032
- Table 5: Asia Pacific Water Meter Market Revenue Million Forecast, by Application 2019 & 2032
- Table 6: Asia Pacific Water Meter Market Volume K Unit Forecast, by Application 2019 & 2032
- Table 7: Asia Pacific Water Meter Market Revenue Million Forecast, by Region 2019 & 2032
- Table 8: Asia Pacific Water Meter Market Volume K Unit Forecast, by Region 2019 & 2032
- Table 9: Asia Pacific Water Meter Market Revenue Million Forecast, by Country 2019 & 2032
- Table 10: Asia Pacific Water Meter Market Volume K Unit Forecast, by Country 2019 & 2032
- Table 11: China Asia Pacific Water Meter Market Revenue (Million) Forecast, by Application 2019 & 2032
- Table 12: China Asia Pacific Water Meter Market Volume (K Unit) Forecast, by Application 2019 & 2032
- Table 13: Japan Asia Pacific Water Meter Market Revenue (Million) Forecast, by Application 2019 & 2032
- Table 14: Japan Asia Pacific Water Meter Market Volume (K Unit) Forecast, by Application 2019 & 2032
- Table 15: India Asia Pacific Water Meter Market Revenue (Million) Forecast, by Application 2019 & 2032
- Table 16: India Asia Pacific Water Meter Market Volume (K Unit) Forecast, by Application 2019 & 2032
- Table 17: South Korea Asia Pacific Water Meter Market Revenue (Million) Forecast, by Application 2019 & 2032
- Table 18: South Korea Asia Pacific Water Meter Market Volume (K Unit) Forecast, by Application 2019 & 2032
- Table 19: Taiwan Asia Pacific Water Meter Market Revenue (Million) Forecast, by Application 2019 & 2032
- Table 20: Taiwan Asia Pacific Water Meter Market Volume (K Unit) Forecast, by Application 2019 & 2032
- Table 21: Australia Asia Pacific Water Meter Market Revenue (Million) Forecast, by Application 2019 & 2032
- Table 22: Australia Asia Pacific Water Meter Market Volume (K Unit) Forecast, by Application 2019 & 2032
- Table 23: Rest of Asia-Pacific Asia Pacific Water Meter Market Revenue (Million) Forecast, by Application 2019 & 2032
- Table 24: Rest of Asia-Pacific Asia Pacific Water Meter Market Volume (K Unit) Forecast, by Application 2019 & 2032
- Table 25: Asia Pacific Water Meter Market Revenue Million Forecast, by Type 2019 & 2032
- Table 26: Asia Pacific Water Meter Market Volume K Unit Forecast, by Type 2019 & 2032
- Table 27: Asia Pacific Water Meter Market Revenue Million Forecast, by Application 2019 & 2032
- Table 28: Asia Pacific Water Meter Market Volume K Unit Forecast, by Application 2019 & 2032
- Table 29: Asia Pacific Water Meter Market Revenue Million Forecast, by Country 2019 & 2032
- Table 30: Asia Pacific Water Meter Market Volume K Unit Forecast, by Country 2019 & 2032
- Table 31: China Asia Pacific Water Meter Market Revenue (Million) Forecast, by Application 2019 & 2032
- Table 32: China Asia Pacific Water Meter Market Volume (K Unit) Forecast, by Application 2019 & 2032
- Table 33: Japan Asia Pacific Water Meter Market Revenue (Million) Forecast, by Application 2019 & 2032
- Table 34: Japan Asia Pacific Water Meter Market Volume (K Unit) Forecast, by Application 2019 & 2032
- Table 35: South Korea Asia Pacific Water Meter Market Revenue (Million) Forecast, by Application 2019 & 2032
- Table 36: South Korea Asia Pacific Water Meter Market Volume (K Unit) Forecast, by Application 2019 & 2032
- Table 37: India Asia Pacific Water Meter Market Revenue (Million) Forecast, by Application 2019 & 2032
- Table 38: India Asia Pacific Water Meter Market Volume (K Unit) Forecast, by Application 2019 & 2032
- Table 39: Australia Asia Pacific Water Meter Market Revenue (Million) Forecast, by Application 2019 & 2032
- Table 40: Australia Asia Pacific Water Meter Market Volume (K Unit) Forecast, by Application 2019 & 2032
- Table 41: New Zealand Asia Pacific Water Meter Market Revenue (Million) Forecast, by Application 2019 & 2032
- Table 42: New Zealand Asia Pacific Water Meter Market Volume (K Unit) Forecast, by Application 2019 & 2032
- Table 43: Indonesia Asia Pacific Water Meter Market Revenue (Million) Forecast, by Application 2019 & 2032
- Table 44: Indonesia Asia Pacific Water Meter Market Volume (K Unit) Forecast, by Application 2019 & 2032
- Table 45: Malaysia Asia Pacific Water Meter Market Revenue (Million) Forecast, by Application 2019 & 2032
- Table 46: Malaysia Asia Pacific Water Meter Market Volume (K Unit) Forecast, by Application 2019 & 2032
- Table 47: Singapore Asia Pacific Water Meter Market Revenue (Million) Forecast, by Application 2019 & 2032
- Table 48: Singapore Asia Pacific Water Meter Market Volume (K Unit) Forecast, by Application 2019 & 2032
- Table 49: Thailand Asia Pacific Water Meter Market Revenue (Million) Forecast, by Application 2019 & 2032
- Table 50: Thailand Asia Pacific Water Meter Market Volume (K Unit) Forecast, by Application 2019 & 2032
- Table 51: Vietnam Asia Pacific Water Meter Market Revenue (Million) Forecast, by Application 2019 & 2032
- Table 52: Vietnam Asia Pacific Water Meter Market Volume (K Unit) Forecast, by Application 2019 & 2032
- Table 53: Philippines Asia Pacific Water Meter Market Revenue (Million) Forecast, by Application 2019 & 2032
- Table 54: Philippines Asia Pacific Water Meter Market Volume (K Unit) Forecast, by Application 2019 & 2032
Frequently Asked Questions
1. What is the projected Compound Annual Growth Rate (CAGR) of the Asia Pacific Water Meter Market?
The projected CAGR is approximately 10.21%.
2. Which companies are prominent players in the Asia Pacific Water Meter Market?
Key companies in the market include Itron Inc, Honeywell International Inc, Holley Technology Ltd , PT BARINDO ANGGUN INDUSTRI, Azbil Kimmon Co Ltd, Arad Group, Diehl Stiftung & Co KG, ASMA Industrial Corporation, Adept Fluidyne Pvt Ltd, UPC Instruments Pvt Ltd, Aichi Tokei Denki Co Ltd.
3. What are the main segments of the Asia Pacific Water Meter Market?
The market segments include Type, Application.
4. Can you provide details about the market size?
The market size is estimated to be USD 10.78 Million as of 2022.
5. What are some drivers contributing to market growth?
Need for Improvement in Utility Usage and Efficiency; Growing Awareness on the Wastage of Water and Supportive Regulations.
6. What are the notable trends driving market growth?
Installation of Smart Meters to Grow Significantly.
7. Are there any restraints impacting market growth?
Reluctance/Lack of Awareness to Use Self-Checkout Systems.
8. Can you provide examples of recent developments in the market?
November 2022: A Union Housing and Urban Affairs Ministry team has suggested installing smart water meters as part of the under-construction water pipeline scheme in Maharashtra's Aurangabad city. The plan aims to install 2.8 lakh meters and provide 24-hour water to the city till 2052.
9. What pricing options are available for accessing the report?
Pricing options include single-user, multi-user, and enterprise licenses priced at USD 3800, USD 4500, and USD 5800 respectively.
10. Is the market size provided in terms of value or volume?
The market size is provided in terms of value, measured in Million and volume, measured in K Unit.
11. Are there any specific market keywords associated with the report?
Yes, the market keyword associated with the report is "Asia Pacific Water Meter Market," which aids in identifying and referencing the specific market segment covered.
12. How do I determine which pricing option suits my needs best?
The pricing options vary based on user requirements and access needs. Individual users may opt for single-user licenses, while businesses requiring broader access may choose multi-user or enterprise licenses for cost-effective access to the report.
13. Are there any additional resources or data provided in the Asia Pacific Water Meter Market report?
While the report offers comprehensive insights, it's advisable to review the specific contents or supplementary materials provided to ascertain if additional resources or data are available.
14. How can I stay updated on further developments or reports in the Asia Pacific Water Meter Market?
To stay informed about further developments, trends, and reports in the Asia Pacific Water Meter Market, consider subscribing to industry newsletters, following relevant companies and organizations, or regularly checking reputable industry news sources and publications.
Methodology
Step 1 - Identification of Relevant Samples Size from Population Database


Step 2 - Approaches for Defining Global Market Size (Value, Volume* & Price*)

Note*: In applicable scenarios
Step 3 - Data Sources
Primary Research
- Web Analytics
- Survey Reports
- Research Institute
- Latest Research Reports
- Opinion Leaders
Secondary Research
- Annual Reports
- White Paper
- Latest Press Release
- Industry Association
- Paid Database
- Investor Presentations

Step 4 - Data Triangulation
Involves using different sources of information in order to increase the validity of a study
These sources are likely to be stakeholders in a program - participants, other researchers, program staff, other community members, and so on.
Then we put all data in single framework & apply various statistical tools to find out the dynamic on the market.
During the analysis stage, feedback from the stakeholder groups would be compared to determine areas of agreement as well as areas of divergence


