
Key Insights
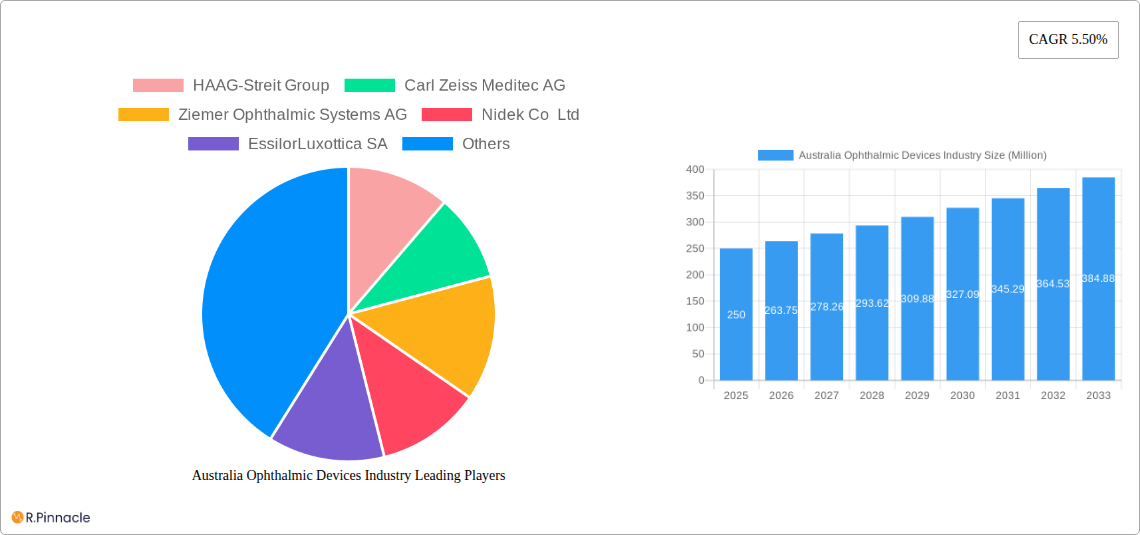
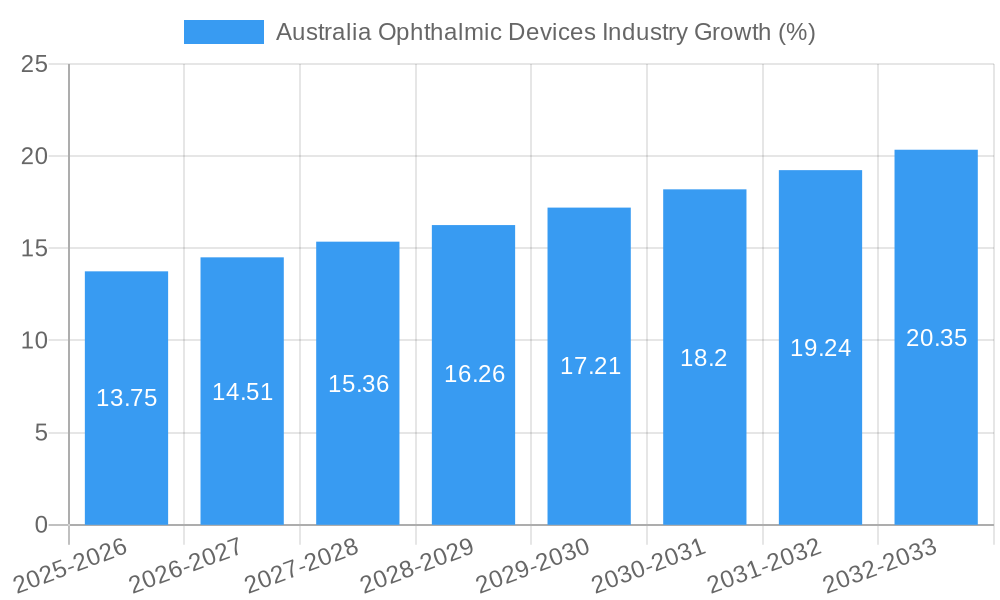
The Australian ophthalmic devices market, valued at approximately $250 million in 2025, is projected to experience robust growth, driven by a rising elderly population, increasing prevalence of age-related eye diseases like cataracts and glaucoma, and rising disposable incomes fueling demand for advanced diagnostic and treatment options. The market's Compound Annual Growth Rate (CAGR) of 5.50% from 2025 to 2033 indicates a significant expansion, with the market expected to surpass $400 million by 2033. Key growth drivers include technological advancements in surgical devices, such as minimally invasive procedures and laser refractive surgery, as well as the increasing adoption of advanced diagnostic tools for early disease detection and personalized treatment. The market is segmented into vision correction devices, surgical devices (including other surgical devices), and diagnostic and monitoring devices. Leading companies like Haag-Streit, Carl Zeiss Meditec, and Alcon are major players, competing through innovation, technological advancements, and strategic partnerships. While the market faces certain restraints, such as the high cost of advanced technologies and the need for skilled professionals, the overall outlook remains positive, reflecting a significant expansion opportunity for ophthalmic device manufacturers in Australia.
The segment showing the highest growth is projected to be surgical devices, fueled by the rising prevalence of age-related eye diseases necessitating surgical intervention. Diagnostic and monitoring devices also present a significant growth opportunity, driven by the demand for early and accurate diagnosis to facilitate timely interventions. The increasing focus on minimally invasive procedures, reduced recovery times and enhanced patient outcomes is further augmenting market growth. Government initiatives promoting eye health and improved healthcare infrastructure are also supporting market expansion. However, challenges remain in terms of reimbursement policies and the need for greater awareness about available treatments among the general population. Despite these challenges, the long-term prospects for the Australian ophthalmic devices market remain promising, with considerable potential for future growth and innovation.
Australia Ophthalmic Devices Industry Report: 2019-2033
This comprehensive report provides a detailed analysis of the Australian ophthalmic devices industry, offering valuable insights for industry professionals, investors, and strategic planners. The study period covers 2019-2033, with 2025 as the base and estimated year. The forecast period spans 2025-2033, and the historical period encompasses 2019-2024. The report projects a market value of approximately AU$XX Million by 2033, showcasing significant growth opportunities.
Australia Ophthalmic Devices Industry Market Structure & Innovation Trends
The Australian ophthalmic devices market exhibits a moderately concentrated structure, with key players such as HAAG-Streit Group, Carl Zeiss Meditec AG, Ziemer Ophthalmic Systems AG, Nidek Co Ltd, EssilorLuxottica SA, Johnson and Johnson, Topcon Corporation, Alcon Inc, Bausch Health Companies Inc, and Hoya Corporation holding significant market share. Market share estimates for 2025 indicate that the top 5 players collectively control approximately 60% of the market, with the remaining share dispersed among smaller players and niche entrants. Innovation is driven by technological advancements in surgical techniques (e.g., minimally invasive procedures), increasing prevalence of age-related eye diseases, and a growing demand for advanced diagnostic and monitoring tools. The regulatory framework, primarily governed by the Therapeutic Goods Administration (TGA), plays a crucial role in shaping market dynamics. Significant M&A activity has been observed in recent years, with deal values exceeding AU$XX Million in the last five years, primarily driven by strategic acquisitions of companies specializing in innovative technologies.
- Market Concentration: Top 5 players hold ~60% market share (2025 est.).
- Innovation Drivers: Technological advancements, disease prevalence, demand for advanced tools.
- Regulatory Framework: Primarily governed by the TGA.
- M&A Activity: Deal values exceeding AU$XX Million in the last five years.
Australia Ophthalmic Devices Industry Market Dynamics & Trends
The Australian ophthalmic devices market is experiencing robust growth, driven by a rising elderly population, increasing prevalence of refractive errors and age-related eye diseases (e.g., cataracts, glaucoma, macular degeneration), and rising disposable incomes leading to increased healthcare spending. Technological advancements, particularly in minimally invasive surgical procedures and advanced imaging technologies, are further fueling market expansion. The market is witnessing a shift towards personalized medicine, with customized solutions for individual patient needs becoming increasingly prevalent. Consumer preferences are leaning towards minimally invasive procedures with faster recovery times, improved cosmetic outcomes, and enhanced patient comfort. The competitive landscape is characterized by intense rivalry among established players and emerging companies, with ongoing innovations and strategic alliances driving further competition. The Compound Annual Growth Rate (CAGR) for the period 2025-2033 is estimated at XX%, driven by strong demand and technological progress. Market penetration of advanced technologies remains relatively low, presenting significant growth opportunities for innovative products.
Dominant Regions & Segments in Australia Ophthalmic Devices Industry
While data on regional variations within Australia is limited, the major metropolitan areas (Sydney, Melbourne, Brisbane) are expected to dominate the market due to higher population density, better healthcare infrastructure, and greater concentration of ophthalmologists and specialized eye care centers. Among the segments, the "Vision Correction Devices" segment, encompassing contact lenses and refractive surgery devices, holds the largest market share driven by high prevalence of refractive errors. The "Surgical Devices" segment is witnessing significant growth due to technological innovations in cataract surgery and other ophthalmic procedures. The "Diagnostic and Monitoring Devices" segment also exhibits strong growth, driven by an increase in early diagnosis and preventative care.
Vision Correction Devices: High prevalence of refractive errors drives growth.
Surgical Devices: Technological innovations in cataract surgery and other procedures fuel expansion.
Diagnostic & Monitoring Devices: Increase in early diagnosis and preventative care promotes growth.
Key Drivers:
- Higher population density in major cities.
- Improved healthcare infrastructure in metropolitan areas.
- Concentration of ophthalmologists and specialized eye care facilities.
Australia Ophthalmic Devices Industry Product Innovations
Recent innovations in the Australian ophthalmic devices market include the development of advanced intraocular lenses (IOLs) with improved biocompatibility and refractive predictability, minimally invasive surgical tools that reduce recovery times and improve patient outcomes, and sophisticated diagnostic imaging systems offering enhanced image quality and diagnostic capabilities. These innovations address unmet clinical needs, improve patient care, and enhance the overall efficiency of ophthalmic practices. Market fit is strong, with adoption rates increasing steadily driven by clinical benefits and growing affordability.
Report Scope & Segmentation Analysis
This report segments the Australian ophthalmic devices market by product type (Vision Correction Devices, Surgical Devices, Other Surgical Devices, Diagnostic and Monitoring Devices) and by end-user (hospitals, clinics, ophthalmologists' offices). Each segment is analyzed in detail, providing insights into market size, growth projections, and competitive dynamics. The "Vision Correction Devices" segment is projected to experience substantial growth (XX% CAGR) due to the high prevalence of refractive errors. The "Surgical Devices" segment is expected to exhibit strong growth (XX% CAGR) fueled by technological innovations. The "Diagnostic and Monitoring Devices" segment shows promising growth (XX% CAGR) due to increasing emphasis on early detection and preventative care. Competition within each segment is fierce, with both established players and new entrants vying for market share.
Key Drivers of Australia Ophthalmic Devices Industry Growth
The growth of the Australian ophthalmic devices industry is fueled by several key factors. The aging population leads to an increasing prevalence of age-related eye diseases, driving demand for diagnostic and treatment devices. Technological advancements, such as minimally invasive surgical techniques and advanced imaging systems, are improving patient outcomes and treatment efficiency. Government initiatives focused on improving healthcare access and affordability further bolster market growth. Rising disposable incomes and increased awareness about eye health among consumers contribute to the expansion of this market.
Challenges in the Australia Ophthalmic Devices Industry Sector
The Australian ophthalmic devices industry faces several challenges. Strict regulatory requirements (TGA approvals) can increase the cost and time associated with product launches. High import tariffs on certain devices can increase prices for consumers and limit market accessibility. The high cost of advanced technologies can make them inaccessible to some patients. The intense competition among industry players necessitates continuous innovation and strategic partnerships to maintain market share.
Emerging Opportunities in Australia Ophthalmic Devices Industry
Emerging opportunities abound for players in the Australian ophthalmic devices industry. The increasing adoption of telemedicine presents new avenues for remote diagnosis and monitoring. The growing demand for personalized medicine, and technological innovations such as AI-powered diagnostic tools, create promising areas for growth. Expansion into underserved rural areas and addressing the needs of indigenous populations represent significant opportunities.
Leading Players in the Australia Ophthalmic Devices Industry Market
- HAAG-Streit Group
- Carl Zeiss Meditec AG
- Ziemer Ophthalmic Systems AG
- Nidek Co Ltd
- EssilorLuxottica SA
- Johnson and Johnson
- Topcon Corporation
- Alcon Inc
- Bausch Health Companies Inc
- Hoya Corporation
Key Developments in Australia Ophthalmic Devices Industry Industry
- October 2021: SEED Co., Ltd. launched SEED 1-day Silfa silicone hydrogel daily disposable contact lens in Australia.
- March 2022: Rayner established a regional office in Sydney to manage product distribution.
Future Outlook for Australia Ophthalmic Devices Industry Market
The future of the Australian ophthalmic devices market appears bright, with strong growth projections driven by continued technological advancements, an aging population, and increased healthcare spending. Strategic partnerships, investments in research and development, and targeted marketing campaigns will be crucial for companies seeking to capitalize on emerging opportunities in this dynamic market. The market's expansion is likely to be accompanied by increased competition, demanding continuous innovation and strategic adaptation to maintain competitiveness.
Australia Ophthalmic Devices Industry Segmentation
-
1. Devices
-
1.1. Surgical Devices
- 1.1.1. Glaucoma Drainage Devices
- 1.1.2. Intraocular Lenses
- 1.1.3. Other Surgical Devices
-
1.2. Diagnostic and Monitoring Devices
- 1.2.1. Autorefractors and Keratometers
- 1.2.2. Corneal Topography Systems
- 1.2.3. Ophthalmic Ultrasound Imaging Systems
- 1.2.4. Other Diagnostic and Monitoring Devices
- 1.3. Vision Correction Devices
-
1.1. Surgical Devices
Australia Ophthalmic Devices Industry Segmentation By Geography
- 1. Australia
Australia Ophthalmic Devices Industry REPORT HIGHLIGHTS
| Aspects | Details |
|---|---|
| Study Period | 2019-2033 |
| Base Year | 2024 |
| Estimated Year | 2025 |
| Forecast Period | 2025-2033 |
| Historical Period | 2019-2024 |
| Growth Rate | CAGR of 5.50% from 2019-2033 |
| Segmentation |
|
Table of Contents
- 1. Introduction
- 1.1. Research Scope
- 1.2. Market Segmentation
- 1.3. Research Methodology
- 1.4. Definitions and Assumptions
- 2. Executive Summary
- 2.1. Introduction
- 3. Market Dynamics
- 3.1. Introduction
- 3.2. Market Drivers
- 3.2.1. Demographic Shift and Increasing Prevalence of Eye Diseases; Rising Geriatric Population; Technological Advancements in Ophthalmic Devices
- 3.3. Market Restrains
- 3.3.1. Risk Associated with Ophthalmic Procedures
- 3.4. Market Trends
- 3.4.1. Vision Correction Devices are Expected to Register a High Growth CAGR Over the Forecast Period
- 4. Market Factor Analysis
- 4.1. Porters Five Forces
- 4.2. Supply/Value Chain
- 4.3. PESTEL analysis
- 4.4. Market Entropy
- 4.5. Patent/Trademark Analysis
- 5. Australia Ophthalmic Devices Industry Analysis, Insights and Forecast, 2019-2031
- 5.1. Market Analysis, Insights and Forecast - by Devices
- 5.1.1. Surgical Devices
- 5.1.1.1. Glaucoma Drainage Devices
- 5.1.1.2. Intraocular Lenses
- 5.1.1.3. Other Surgical Devices
- 5.1.2. Diagnostic and Monitoring Devices
- 5.1.2.1. Autorefractors and Keratometers
- 5.1.2.2. Corneal Topography Systems
- 5.1.2.3. Ophthalmic Ultrasound Imaging Systems
- 5.1.2.4. Other Diagnostic and Monitoring Devices
- 5.1.3. Vision Correction Devices
- 5.1.1. Surgical Devices
- 5.2. Market Analysis, Insights and Forecast - by Region
- 5.2.1. Australia
- 5.1. Market Analysis, Insights and Forecast - by Devices
- 6. Competitive Analysis
- 6.1. Market Share Analysis 2024
- 6.2. Company Profiles
- 6.2.1 HAAG-Streit Group
- 6.2.1.1. Overview
- 6.2.1.2. Products
- 6.2.1.3. SWOT Analysis
- 6.2.1.4. Recent Developments
- 6.2.1.5. Financials (Based on Availability)
- 6.2.2 Carl Zeiss Meditec AG
- 6.2.2.1. Overview
- 6.2.2.2. Products
- 6.2.2.3. SWOT Analysis
- 6.2.2.4. Recent Developments
- 6.2.2.5. Financials (Based on Availability)
- 6.2.3 Ziemer Ophthalmic Systems AG
- 6.2.3.1. Overview
- 6.2.3.2. Products
- 6.2.3.3. SWOT Analysis
- 6.2.3.4. Recent Developments
- 6.2.3.5. Financials (Based on Availability)
- 6.2.4 Nidek Co Ltd
- 6.2.4.1. Overview
- 6.2.4.2. Products
- 6.2.4.3. SWOT Analysis
- 6.2.4.4. Recent Developments
- 6.2.4.5. Financials (Based on Availability)
- 6.2.5 EssilorLuxottica SA
- 6.2.5.1. Overview
- 6.2.5.2. Products
- 6.2.5.3. SWOT Analysis
- 6.2.5.4. Recent Developments
- 6.2.5.5. Financials (Based on Availability)
- 6.2.6 Johnson and Johnson
- 6.2.6.1. Overview
- 6.2.6.2. Products
- 6.2.6.3. SWOT Analysis
- 6.2.6.4. Recent Developments
- 6.2.6.5. Financials (Based on Availability)
- 6.2.7 Topcon Corporation
- 6.2.7.1. Overview
- 6.2.7.2. Products
- 6.2.7.3. SWOT Analysis
- 6.2.7.4. Recent Developments
- 6.2.7.5. Financials (Based on Availability)
- 6.2.8 Alcon Inc
- 6.2.8.1. Overview
- 6.2.8.2. Products
- 6.2.8.3. SWOT Analysis
- 6.2.8.4. Recent Developments
- 6.2.8.5. Financials (Based on Availability)
- 6.2.9 Bausch Health Companies Inc
- 6.2.9.1. Overview
- 6.2.9.2. Products
- 6.2.9.3. SWOT Analysis
- 6.2.9.4. Recent Developments
- 6.2.9.5. Financials (Based on Availability)
- 6.2.10 Hoya Corporation
- 6.2.10.1. Overview
- 6.2.10.2. Products
- 6.2.10.3. SWOT Analysis
- 6.2.10.4. Recent Developments
- 6.2.10.5. Financials (Based on Availability)
- 6.2.1 HAAG-Streit Group
List of Figures
- Figure 1: Australia Ophthalmic Devices Industry Revenue Breakdown (Million, %) by Product 2024 & 2032
- Figure 2: Australia Ophthalmic Devices Industry Share (%) by Company 2024
List of Tables
- Table 1: Australia Ophthalmic Devices Industry Revenue Million Forecast, by Region 2019 & 2032
- Table 2: Australia Ophthalmic Devices Industry Volume K Unit Forecast, by Region 2019 & 2032
- Table 3: Australia Ophthalmic Devices Industry Revenue Million Forecast, by Devices 2019 & 2032
- Table 4: Australia Ophthalmic Devices Industry Volume K Unit Forecast, by Devices 2019 & 2032
- Table 5: Australia Ophthalmic Devices Industry Revenue Million Forecast, by Region 2019 & 2032
- Table 6: Australia Ophthalmic Devices Industry Volume K Unit Forecast, by Region 2019 & 2032
- Table 7: Australia Ophthalmic Devices Industry Revenue Million Forecast, by Country 2019 & 2032
- Table 8: Australia Ophthalmic Devices Industry Volume K Unit Forecast, by Country 2019 & 2032
- Table 9: Australia Ophthalmic Devices Industry Revenue Million Forecast, by Devices 2019 & 2032
- Table 10: Australia Ophthalmic Devices Industry Volume K Unit Forecast, by Devices 2019 & 2032
- Table 11: Australia Ophthalmic Devices Industry Revenue Million Forecast, by Country 2019 & 2032
- Table 12: Australia Ophthalmic Devices Industry Volume K Unit Forecast, by Country 2019 & 2032
Frequently Asked Questions
1. What is the projected Compound Annual Growth Rate (CAGR) of the Australia Ophthalmic Devices Industry?
The projected CAGR is approximately 5.50%.
2. Which companies are prominent players in the Australia Ophthalmic Devices Industry?
Key companies in the market include HAAG-Streit Group, Carl Zeiss Meditec AG, Ziemer Ophthalmic Systems AG, Nidek Co Ltd, EssilorLuxottica SA, Johnson and Johnson, Topcon Corporation, Alcon Inc, Bausch Health Companies Inc, Hoya Corporation.
3. What are the main segments of the Australia Ophthalmic Devices Industry?
The market segments include Devices.
4. Can you provide details about the market size?
The market size is estimated to be USD XX Million as of 2022.
5. What are some drivers contributing to market growth?
Demographic Shift and Increasing Prevalence of Eye Diseases; Rising Geriatric Population; Technological Advancements in Ophthalmic Devices.
6. What are the notable trends driving market growth?
Vision Correction Devices are Expected to Register a High Growth CAGR Over the Forecast Period.
7. Are there any restraints impacting market growth?
Risk Associated with Ophthalmic Procedures.
8. Can you provide examples of recent developments in the market?
In March 2022, Rayner, the British manufacturer and distributor of intraocular lenses (IOLs) and ophthalmic solutions, established a regional office in Sydney to directly manage its product distribution.
9. What pricing options are available for accessing the report?
Pricing options include single-user, multi-user, and enterprise licenses priced at USD 3800, USD 4500, and USD 5800 respectively.
10. Is the market size provided in terms of value or volume?
The market size is provided in terms of value, measured in Million and volume, measured in K Unit.
11. Are there any specific market keywords associated with the report?
Yes, the market keyword associated with the report is "Australia Ophthalmic Devices Industry," which aids in identifying and referencing the specific market segment covered.
12. How do I determine which pricing option suits my needs best?
The pricing options vary based on user requirements and access needs. Individual users may opt for single-user licenses, while businesses requiring broader access may choose multi-user or enterprise licenses for cost-effective access to the report.
13. Are there any additional resources or data provided in the Australia Ophthalmic Devices Industry report?
While the report offers comprehensive insights, it's advisable to review the specific contents or supplementary materials provided to ascertain if additional resources or data are available.
14. How can I stay updated on further developments or reports in the Australia Ophthalmic Devices Industry?
To stay informed about further developments, trends, and reports in the Australia Ophthalmic Devices Industry, consider subscribing to industry newsletters, following relevant companies and organizations, or regularly checking reputable industry news sources and publications.
Methodology
Step 1 - Identification of Relevant Samples Size from Population Database


Step 2 - Approaches for Defining Global Market Size (Value, Volume* & Price*)

Note*: In applicable scenarios
Step 3 - Data Sources
Primary Research
- Web Analytics
- Survey Reports
- Research Institute
- Latest Research Reports
- Opinion Leaders
Secondary Research
- Annual Reports
- White Paper
- Latest Press Release
- Industry Association
- Paid Database
- Investor Presentations

Step 4 - Data Triangulation
Involves using different sources of information in order to increase the validity of a study
These sources are likely to be stakeholders in a program - participants, other researchers, program staff, other community members, and so on.
Then we put all data in single framework & apply various statistical tools to find out the dynamic on the market.
During the analysis stage, feedback from the stakeholder groups would be compared to determine areas of agreement as well as areas of divergence


