

Key Insights
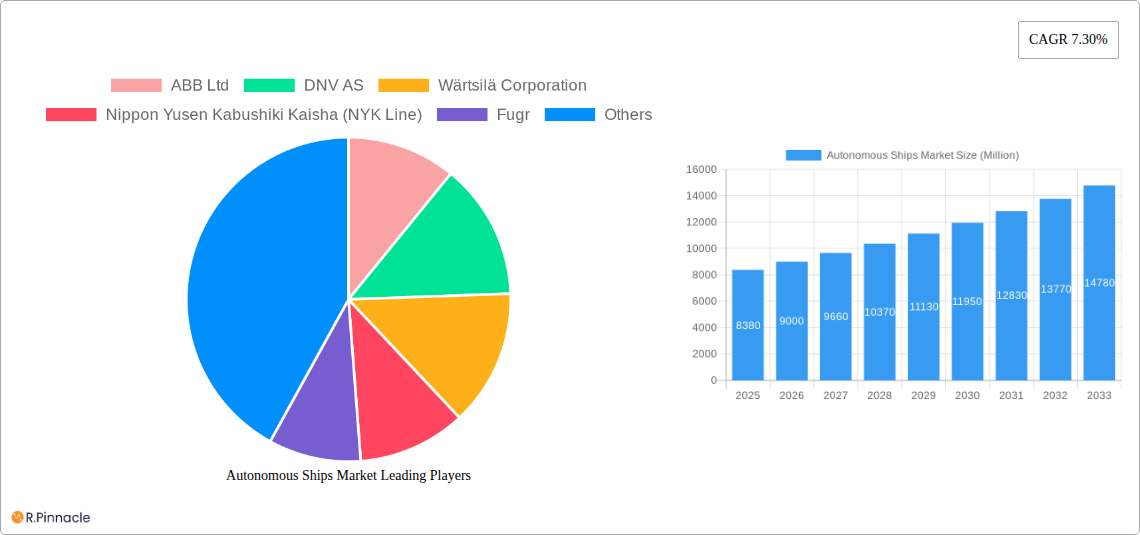
The autonomous ships market is experiencing robust growth, projected to reach a substantial size driven by increasing demand for enhanced maritime safety, efficiency, and reduced operational costs. The market's Compound Annual Growth Rate (CAGR) of 7.30% from 2019 to 2024 indicates a consistent upward trajectory. This growth is fueled by several key factors. Firstly, advancements in artificial intelligence (AI), sensor technologies, and communication systems are enabling the development of increasingly sophisticated autonomous navigation and control systems. Secondly, the maritime industry faces persistent challenges related to crew shortages, rising labor costs, and the need to improve safety standards, particularly in challenging weather conditions. Autonomous vessels offer a viable solution to these issues, promising increased operational efficiency and reduced human error. Finally, regulatory frameworks are gradually evolving to accommodate the introduction of autonomous shipping, fostering greater adoption and investment in this sector. The market segmentation highlights the diverse applications of autonomous technology, including partially autonomous vessels for enhanced safety features, remotely controlled ships for specific tasks, and fully autonomous ships capable of independent operation across longer distances. The leading players – ABB, DNV, Wärtsilä, NYK Line, and others – are actively investing in research and development, driving innovation and competition in this rapidly expanding market.
Autonomous Ships Market Market Size (In Billion)
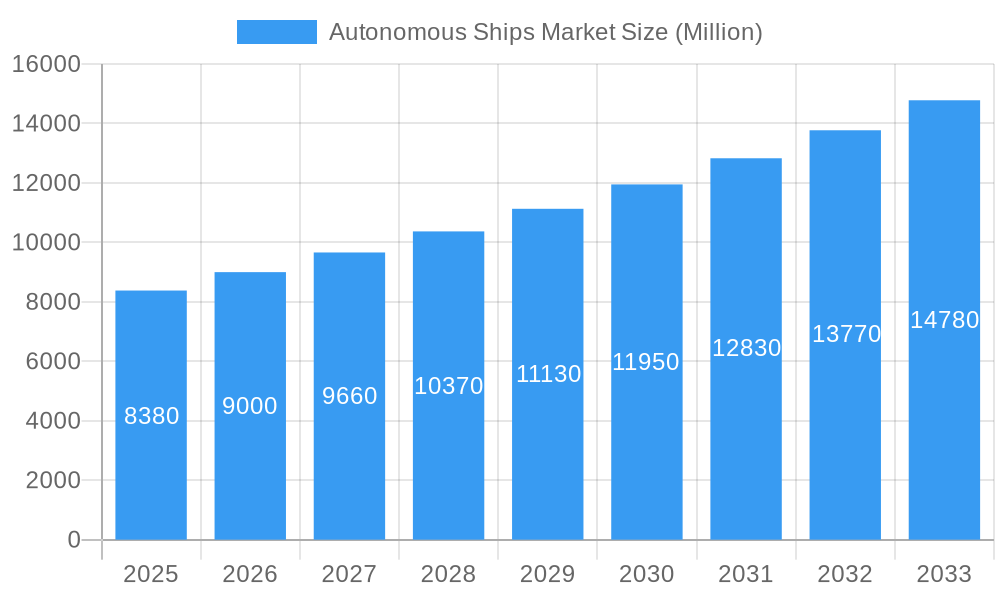
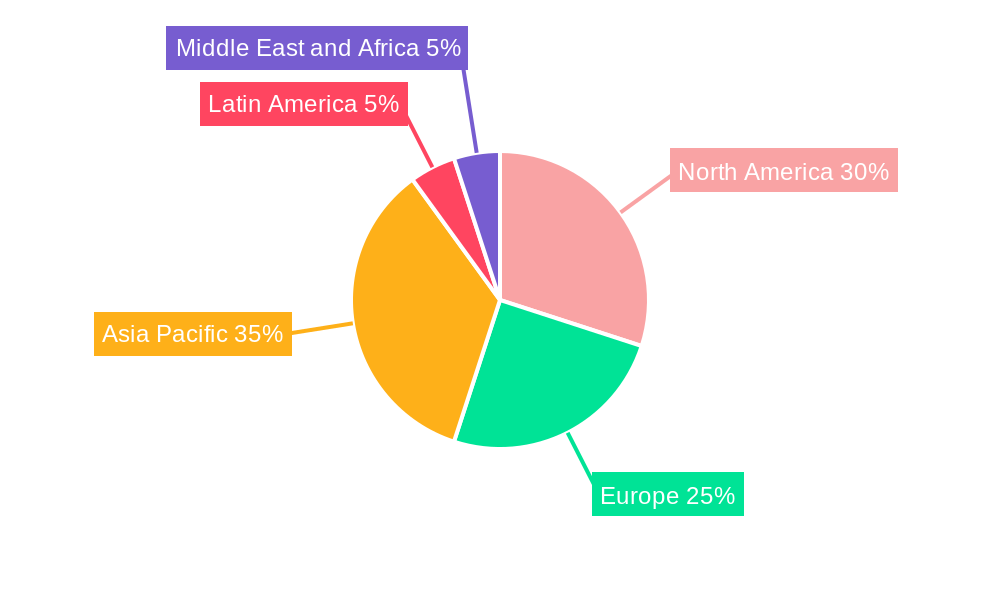
The market's geographical distribution is expected to be diverse, with North America and Asia Pacific emerging as key regions due to substantial investments in technology and infrastructure. Europe will also contribute significantly due to strong maritime expertise and supportive regulatory environments. While the initial market penetration of fully autonomous ships might be slower due to regulatory hurdles and public perception, the increasing adoption of partially autonomous and remotely controlled vessels will significantly contribute to market expansion in the short to medium term. Over the long term, continued technological advancements, coupled with favourable regulatory landscapes, will pave the way for widespread adoption of fully autonomous ships, significantly reshaping the global maritime landscape and unlocking substantial economic benefits. The market's value, estimated at $8.38 billion in 2024, is anticipated to experience continuous growth throughout the forecast period (2025-2033), spurred by the factors mentioned above and evolving industry requirements.
Autonomous Ships Market Company Market Share
Autonomous Ships Market: A Comprehensive Report (2019-2033)
This in-depth report provides a comprehensive analysis of the Autonomous Ships Market, offering invaluable insights for industry professionals, investors, and strategic decision-makers. With a detailed examination of market structure, dynamics, leading players, and future outlook, this report is your essential guide to navigating this rapidly evolving sector. The study period covers 2019-2033, with a base year of 2025 and a forecast period of 2025-2033. The market size is projected to reach xx Million by 2033.
Autonomous Ships Market Structure & Innovation Trends
This section analyzes the competitive landscape, innovation drivers, and regulatory influences shaping the autonomous ships market. Market concentration is currently moderate, with several key players vying for dominance. However, the market is expected to consolidate further as technological advancements and regulatory clarity emerge. The report assesses market share for key players such as ABB Ltd, DNV AS, Wärtsilä Corporation, and others, identifying potential future leaders. Significant M&A activity is anticipated, driving innovation and expanding market reach. Deal values are projected to increase significantly in the coming years, reaching xx Million annually by 2033.
- Market Concentration: Moderate, with increasing consolidation.
- Innovation Drivers: Technological advancements in AI, autonomous navigation, and sensor technologies.
- Regulatory Frameworks: Evolving regulations impacting safety and operational standards.
- Product Substitutes: Limited direct substitutes, with competition primarily driven by improvements in existing technologies.
- End-User Demographics: Primarily commercial shipping companies, but increasing military and specialized industry adoption is expected.
- M&A Activities: Significant activity predicted, driven by consolidation and expansion strategies.
Autonomous Ships Market Dynamics & Trends
The autonomous ships market is experiencing robust growth, driven by several key factors. Increasing demand for efficient and cost-effective shipping solutions, coupled with advancements in autonomous navigation technologies, fuels this expansion. The report examines various factors driving this growth and identifies potential challenges. The Compound Annual Growth Rate (CAGR) for the forecast period is estimated at xx%, reflecting strong market penetration. Key technological disruptions, including the integration of AI and machine learning, are transforming operations and improving efficiency. Consumer preferences toward enhanced safety and reduced operational costs are also contributing to market expansion. The competitive dynamics are characterized by intense rivalry among established players and emerging innovators.
Dominant Regions & Segments in Autonomous Ships Market
This section identifies the leading regions and segments within the autonomous ships market. While precise market share data varies based on vessel type and application, Asia-Pacific region is expected to take the lead owing to robust manufacturing, significant maritime trade, and increased government investments. The analysis further breaks down segment dominance by vessel type (partially autonomous, remotely controlled, fully autonomous) and application (commercial, military).
- Dominant Region: Asia-Pacific, driven by robust manufacturing and maritime trade.
- Leading Segment (Type): Partially Autonomous ships currently hold the largest market share, though fully autonomous vessels are expected to see significant growth in the forecast period.
- Leading Segment (Application): Commercial shipping is the dominant application area.
- Key Drivers: Government incentives, investment in port infrastructure, and increasing demand for efficient shipping routes.
Detailed Dominance Analysis: The dominance of specific regions and segments is further analyzed by considering factors like economic policies, level of technological advancements, and regulatory frameworks. Further regional analysis includes North America, Europe and others.
Autonomous Ships Market Product Innovations
The autonomous ships market is experiencing a dynamic phase of product innovation, driven by a relentless pursuit of enhanced safety, operational efficiency, and significant cost reductions. Key advancements are concentrated in the development of cutting-edge sensor technologies, including LiDAR, radar, and advanced visual recognition systems, which provide unparalleled environmental awareness. These are complemented by sophisticated AI-powered navigation and decision-making algorithms, enabling vessels to interpret complex maritime environments and chart optimal courses with a high degree of autonomy. Furthermore, the establishment of robust, secure, and high-bandwidth communication infrastructure, such as satellite and 5G networks, is crucial for real-time data exchange and remote monitoring. These integrated advancements are paving the way for the creation of highly reliable, versatile, and increasingly intelligent autonomous vessels, directly addressing the growing demand from shipping companies aiming to optimize logistics and elevate safety standards.
Report Scope & Segmentation Analysis
This comprehensive report offers an in-depth analysis of the autonomous ships market, meticulously segmenting it by vessel type and application to provide a holistic view of market dynamics and future trajectories.
By Vessel Type:
- Partially Autonomous Ships: This segment includes vessels equipped with advanced automated systems that augment the capabilities of human crews, leading to demonstrably improved efficiency, enhanced safety, and reduced human error. The growth in this segment is propelled by the phased adoption of incremental technological enhancements. The market size for partially autonomous ships is projected to reach XX Million USD by 2033.
- Remotely Controlled Ships: These vessels operate under the direct supervision and control of human operators located onshore or in a remote command center, offering unparalleled operational flexibility and the ability to manage vessels in challenging or hazardous environments without direct human presence onboard. The market size for remotely controlled ships is projected to reach XX Million USD by 2033.
- Fully Autonomous Ships: Representing the vanguard of maritime automation, these vessels are designed to operate entirely without human intervention, from navigation and operational tasks to emergency response. While currently in the nascent stages of widespread adoption, the potential for substantial cost savings, increased operational uptime, and unprecedented efficiency gains positions this segment for exponential growth, with a projected market size of XX Million USD by 2033.
By Application:
- Commercial: This sector currently represents the largest share of the autonomous ships market and is expected to maintain its dominance. It is primarily driven by the increasing global demand for efficient, reliable, and cost-effective freight transportation across various industries, including container shipping, bulk cargo, and offshore support. The market size for commercial applications is projected to reach XX Million USD by 2033.
- Military: The adoption of autonomous vessels in military operations is experiencing significant growth, fueled by strategic imperatives for enhanced surveillance, reconnaissance, logistics support, and the reduction of risk to human personnel in high-threat environments. The market size for military applications is projected to reach XX Million USD by 2033.
Key Drivers of Autonomous Ships Market Growth
The growth of the autonomous ships market is driven by several key factors, including:
- Technological advancements: Improvements in AI, sensor technology, and communication infrastructure.
- Cost reduction: Automation leads to lower operational costs and enhanced efficiency.
- Enhanced safety: Autonomous systems can reduce human error, improving overall safety.
- Increased demand: Growing global trade and rising demand for efficient shipping solutions.
- Regulatory support: Government initiatives are creating a favorable environment for the adoption of autonomous shipping technologies.
Challenges in the Autonomous Ships Market Sector
Despite significant potential, the autonomous ships market faces several challenges:
- Regulatory hurdles: Establishing clear safety and operational standards is crucial for widespread adoption.
- Technological limitations: Autonomous navigation systems still require further refinement to ensure reliability and safety in all conditions.
- Cybersecurity threats: Protecting autonomous vessels from cyberattacks is critical.
- High initial investment: The initial cost of implementing autonomous technologies can be substantial.
Emerging Opportunities in Autonomous Ships Market
The autonomous ships market is brimming with significant emerging opportunities:
- Expansion into New and Underserved Markets: Untapped potential exists in emerging economies and developing regions that are witnessing substantial growth in maritime trade and require advanced logistical solutions. This includes expanding the reach of autonomous technology to niche shipping routes and specialized cargo types.
- Continued Technological Innovation and Integration: Ongoing and rapid advancements in artificial intelligence (AI), machine learning, robotics, advanced sensor fusion, and cybersecurity will unlock new levels of vessel capability, autonomy, and safety. This also includes the seamless integration of these systems with advanced simulation and digital twin technologies for continuous improvement and predictive maintenance.
- Synergistic Integration with Broader Digital Logistics Networks: The future of autonomous shipping lies in its seamless integration with end-to-end digital logistics platforms. This involves connecting autonomous vessels with smart ports, advanced tracking systems, and supply chain management software to create highly optimized and transparent global trade routes.
- Development and Deployment for Specialized Niche Applications: Beyond traditional cargo transport, there is a growing demand for autonomous vessels tailored for specific, high-value tasks. This includes autonomous underwater vehicles (AUVs) for subsea exploration and infrastructure inspection, specialized vessels for offshore renewable energy operations (e.g., wind farm maintenance), and autonomous ferries for short-sea shipping and intra-island transport.
Leading Players in the Autonomous Ships Market Market
- ABB Ltd
- DNV AS
- Wärtsilä Corporation
- Nippon Yusen Kabushiki Kaisha (NYK Line)
- Fugro
- Kongsberg Gruppen ASA
- MITSUI E&S Co Ltd
- Vigor Industrial LLC
- Rolls-Royce plc
- Praxis Automation Technology B V
- Hanwha Corporation
- HD Hyundai Heavy Industries Co Ltd
Key Developments in Autonomous Ships Market Industry
- August 2022: Avikus, a pioneering subsidiary of HD Hyundai Heavy Industries, secured a substantial order for its advanced autonomous navigation solution, HiNAS 2.0, to be integrated into 23 vessels operated by SK Shipping and Sinokor Merchant Marine. This significant commercial endorsement underscores the growing confidence in and adoption of sophisticated autonomous navigation systems within the global shipping industry, marking a pivotal step towards more automated commercial operations.
- February 2023: Austal USA successfully delivered an exceptionally advanced autonomous-capable EPF 13 ship to the United States Navy. This delivery represents a landmark achievement with the successful integration of automated maintenance and real-time health monitoring capabilities. These features are designed to extend the operational autonomy of the vessel significantly, paving the way for enhanced mission effectiveness and reduced crew requirements in complex military scenarios, and marking a critical advancement in the realization of truly autonomous naval assets.
Future Outlook for Autonomous Ships Market Market
The future of the autonomous ships market is bright, with considerable growth potential. Continued technological advancements, coupled with supportive regulatory frameworks, are expected to drive widespread adoption. Strategic partnerships and collaborations among key players will further accelerate market growth. The market is poised for significant expansion in the coming years, driven by increasing demand for efficient, safe, and cost-effective shipping solutions.
Autonomous Ships Market Segmentation
-
1. Type
- 1.1. Partially Autonomous
- 1.2. Remotely Controlled Ship
- 1.3. Fully Autonomous
-
2. Application
- 2.1. Commercial
- 2.2. Military
Autonomous Ships Market Segmentation By Geography
-
1. North America
- 1.1. United States
- 1.2. Canada
-
2. Europe
- 2.1. United Kingdom
- 2.2. Germany
- 2.3. France
- 2.4. Italy
- 2.5. Russia
- 2.6. Rest of Europe
-
3. Asia Pacific
- 3.1. China
- 3.2. India
- 3.3. Japan
- 3.4. South Korea
- 3.5. Australia
- 3.6. Rest of Asia Pacific
-
4. Latin America
- 4.1. Brazil
- 4.2. Rest of Latin America
-
5. Middle East and Africa
- 5.1. Saudi Arabia
- 5.2. United Arab Emirates
- 5.3. Qatar
- 5.4. Egypt
- 5.5. South Africa
- 5.6. Rest of Middle East and Africa
Autonomous Ships Market Regional Market Share
Geographic Coverage of Autonomous Ships Market
Autonomous Ships Market REPORT HIGHLIGHTS
| Aspects | Details |
|---|---|
| Study Period | 2020-2034 |
| Base Year | 2025 |
| Estimated Year | 2026 |
| Forecast Period | 2026-2034 |
| Historical Period | 2020-2025 |
| Growth Rate | CAGR of 7.30% from 2020-2034 |
| Segmentation |
|
Table of Contents
- 1. Introduction
- 1.1. Research Scope
- 1.2. Market Segmentation
- 1.3. Research Objective
- 1.4. Definitions and Assumptions
- 2. Executive Summary
- 2.1. Market Snapshot
- 3. Market Dynamics
- 3.1. Market Drivers
- 3.2. Market Restrains
- 3.3. Market Trends
- 3.4. Market Opportunities
- 4. Market Factor Analysis
- 4.1. Porters Five Forces
- 4.1.1. Bargaining Power of Suppliers
- 4.1.2. Bargaining Power of Buyers
- 4.1.3. Threat of New Entrants
- 4.1.4. Threat of Substitutes
- 4.1.5. Competitive Rivalry
- 4.2. PESTEL analysis
- 4.3. BCG Analysis
- 4.3.1. Stars (High Growth, High Market Share)
- 4.3.2. Cash Cows (Low Growth, High Market Share)
- 4.3.3. Question Mark (High Growth, Low Market Share)
- 4.3.4. Dogs (Low Growth, Low Market Share)
- 4.4. Ansoff Matrix Analysis
- 4.5. Supply Chain Analysis
- 4.6. Regulatory Landscape
- 4.7. Current Market Potential and Opportunity Assessment (TAM–SAM–SOM Framework)
- 4.8. PRI Analyst Note
- 4.1. Porters Five Forces
- 5. Market Analysis, Insights and Forecast 2021-2033
- 5.1. Market Analysis, Insights and Forecast - by Type
- 5.1.1. Partially Autonomous
- 5.1.2. Remotely Controlled Ship
- 5.1.3. Fully Autonomous
- 5.2. Market Analysis, Insights and Forecast - by Application
- 5.2.1. Commercial
- 5.2.2. Military
- 5.3. Market Analysis, Insights and Forecast - by Region
- 5.3.1. North America
- 5.3.2. Europe
- 5.3.3. Asia Pacific
- 5.3.4. Latin America
- 5.3.5. Middle East and Africa
- 5.1. Market Analysis, Insights and Forecast - by Type
- 6. Global Autonomous Ships Market Analysis, Insights and Forecast, 2021-2033
- 6.1. Market Analysis, Insights and Forecast - by Type
- 6.1.1. Partially Autonomous
- 6.1.2. Remotely Controlled Ship
- 6.1.3. Fully Autonomous
- 6.2. Market Analysis, Insights and Forecast - by Application
- 6.2.1. Commercial
- 6.2.2. Military
- 6.1. Market Analysis, Insights and Forecast - by Type
- 7. North America Autonomous Ships Market Analysis, Insights and Forecast, 2020-2032
- 7.1. Market Analysis, Insights and Forecast - by Type
- 7.1.1. Partially Autonomous
- 7.1.2. Remotely Controlled Ship
- 7.1.3. Fully Autonomous
- 7.2. Market Analysis, Insights and Forecast - by Application
- 7.2.1. Commercial
- 7.2.2. Military
- 7.1. Market Analysis, Insights and Forecast - by Type
- 8. Europe Autonomous Ships Market Analysis, Insights and Forecast, 2020-2032
- 8.1. Market Analysis, Insights and Forecast - by Type
- 8.1.1. Partially Autonomous
- 8.1.2. Remotely Controlled Ship
- 8.1.3. Fully Autonomous
- 8.2. Market Analysis, Insights and Forecast - by Application
- 8.2.1. Commercial
- 8.2.2. Military
- 8.1. Market Analysis, Insights and Forecast - by Type
- 9. Asia Pacific Autonomous Ships Market Analysis, Insights and Forecast, 2020-2032
- 9.1. Market Analysis, Insights and Forecast - by Type
- 9.1.1. Partially Autonomous
- 9.1.2. Remotely Controlled Ship
- 9.1.3. Fully Autonomous
- 9.2. Market Analysis, Insights and Forecast - by Application
- 9.2.1. Commercial
- 9.2.2. Military
- 9.1. Market Analysis, Insights and Forecast - by Type
- 10. Latin America Autonomous Ships Market Analysis, Insights and Forecast, 2020-2032
- 10.1. Market Analysis, Insights and Forecast - by Type
- 10.1.1. Partially Autonomous
- 10.1.2. Remotely Controlled Ship
- 10.1.3. Fully Autonomous
- 10.2. Market Analysis, Insights and Forecast - by Application
- 10.2.1. Commercial
- 10.2.2. Military
- 10.1. Market Analysis, Insights and Forecast - by Type
- 11. Middle East and Africa Autonomous Ships Market Analysis, Insights and Forecast, 2020-2032
- 11.1. Market Analysis, Insights and Forecast - by Type
- 11.1.1. Partially Autonomous
- 11.1.2. Remotely Controlled Ship
- 11.1.3. Fully Autonomous
- 11.2. Market Analysis, Insights and Forecast - by Application
- 11.2.1. Commercial
- 11.2.2. Military
- 11.1. Market Analysis, Insights and Forecast - by Type
- 12. Competitive Analysis
- 12.1. Company Profiles
- 12.1.1 ABB Ltd
- 12.1.1.1. Company Overview
- 12.1.1.2. Products
- 12.1.1.3. Company Financials
- 12.1.1.4. SWOT Analysis
- 12.1.2 DNV AS
- 12.1.2.1. Company Overview
- 12.1.2.2. Products
- 12.1.2.3. Company Financials
- 12.1.2.4. SWOT Analysis
- 12.1.3 Wärtsilä Corporation
- 12.1.3.1. Company Overview
- 12.1.3.2. Products
- 12.1.3.3. Company Financials
- 12.1.3.4. SWOT Analysis
- 12.1.4 Nippon Yusen Kabushiki Kaisha (NYK Line)
- 12.1.4.1. Company Overview
- 12.1.4.2. Products
- 12.1.4.3. Company Financials
- 12.1.4.4. SWOT Analysis
- 12.1.5 Fugr
- 12.1.5.1. Company Overview
- 12.1.5.2. Products
- 12.1.5.3. Company Financials
- 12.1.5.4. SWOT Analysis
- 12.1.6 Kongsberg Gruppen ASA
- 12.1.6.1. Company Overview
- 12.1.6.2. Products
- 12.1.6.3. Company Financials
- 12.1.6.4. SWOT Analysis
- 12.1.7 MITSUI E&S Co Ltd
- 12.1.7.1. Company Overview
- 12.1.7.2. Products
- 12.1.7.3. Company Financials
- 12.1.7.4. SWOT Analysis
- 12.1.8 Vigor Industrial LLC
- 12.1.8.1. Company Overview
- 12.1.8.2. Products
- 12.1.8.3. Company Financials
- 12.1.8.4. SWOT Analysis
- 12.1.9 Rolls-Royce plc
- 12.1.9.1. Company Overview
- 12.1.9.2. Products
- 12.1.9.3. Company Financials
- 12.1.9.4. SWOT Analysis
- 12.1.10 Praxis Automation Technology B V
- 12.1.10.1. Company Overview
- 12.1.10.2. Products
- 12.1.10.3. Company Financials
- 12.1.10.4. SWOT Analysis
- 12.1.11 Hanwha Corporation
- 12.1.11.1. Company Overview
- 12.1.11.2. Products
- 12.1.11.3. Company Financials
- 12.1.11.4. SWOT Analysis
- 12.1.12 HD Hyundai Heavy Industries Co Ltd
- 12.1.12.1. Company Overview
- 12.1.12.2. Products
- 12.1.12.3. Company Financials
- 12.1.12.4. SWOT Analysis
- 12.1.1 ABB Ltd
- 12.2. Market Entropy
- 12.2.1 Company's Key Areas Served
- 12.2.2 Recent Developments
- 12.3. Company Market Share Analysis 2025
- 12.3.1 Top 5 Companies Market Share Analysis
- 12.3.2 Top 3 Companies Market Share Analysis
- 12.4. List of Potential Customers
- 13. Research Methodology
List of Figures
- Figure 1: Global Autonomous Ships Market Revenue Breakdown (Million, %) by Region 2025 & 2033
- Figure 2: North America Autonomous Ships Market Revenue (Million), by Type 2025 & 2033
- Figure 3: North America Autonomous Ships Market Revenue Share (%), by Type 2025 & 2033
- Figure 4: North America Autonomous Ships Market Revenue (Million), by Application 2025 & 2033
- Figure 5: North America Autonomous Ships Market Revenue Share (%), by Application 2025 & 2033
- Figure 6: North America Autonomous Ships Market Revenue (Million), by Country 2025 & 2033
- Figure 7: North America Autonomous Ships Market Revenue Share (%), by Country 2025 & 2033
- Figure 8: Europe Autonomous Ships Market Revenue (Million), by Type 2025 & 2033
- Figure 9: Europe Autonomous Ships Market Revenue Share (%), by Type 2025 & 2033
- Figure 10: Europe Autonomous Ships Market Revenue (Million), by Application 2025 & 2033
- Figure 11: Europe Autonomous Ships Market Revenue Share (%), by Application 2025 & 2033
- Figure 12: Europe Autonomous Ships Market Revenue (Million), by Country 2025 & 2033
- Figure 13: Europe Autonomous Ships Market Revenue Share (%), by Country 2025 & 2033
- Figure 14: Asia Pacific Autonomous Ships Market Revenue (Million), by Type 2025 & 2033
- Figure 15: Asia Pacific Autonomous Ships Market Revenue Share (%), by Type 2025 & 2033
- Figure 16: Asia Pacific Autonomous Ships Market Revenue (Million), by Application 2025 & 2033
- Figure 17: Asia Pacific Autonomous Ships Market Revenue Share (%), by Application 2025 & 2033
- Figure 18: Asia Pacific Autonomous Ships Market Revenue (Million), by Country 2025 & 2033
- Figure 19: Asia Pacific Autonomous Ships Market Revenue Share (%), by Country 2025 & 2033
- Figure 20: Latin America Autonomous Ships Market Revenue (Million), by Type 2025 & 2033
- Figure 21: Latin America Autonomous Ships Market Revenue Share (%), by Type 2025 & 2033
- Figure 22: Latin America Autonomous Ships Market Revenue (Million), by Application 2025 & 2033
- Figure 23: Latin America Autonomous Ships Market Revenue Share (%), by Application 2025 & 2033
- Figure 24: Latin America Autonomous Ships Market Revenue (Million), by Country 2025 & 2033
- Figure 25: Latin America Autonomous Ships Market Revenue Share (%), by Country 2025 & 2033
- Figure 26: Middle East and Africa Autonomous Ships Market Revenue (Million), by Type 2025 & 2033
- Figure 27: Middle East and Africa Autonomous Ships Market Revenue Share (%), by Type 2025 & 2033
- Figure 28: Middle East and Africa Autonomous Ships Market Revenue (Million), by Application 2025 & 2033
- Figure 29: Middle East and Africa Autonomous Ships Market Revenue Share (%), by Application 2025 & 2033
- Figure 30: Middle East and Africa Autonomous Ships Market Revenue (Million), by Country 2025 & 2033
- Figure 31: Middle East and Africa Autonomous Ships Market Revenue Share (%), by Country 2025 & 2033
List of Tables
- Table 1: Global Autonomous Ships Market Revenue Million Forecast, by Type 2020 & 2033
- Table 2: Global Autonomous Ships Market Revenue Million Forecast, by Application 2020 & 2033
- Table 3: Global Autonomous Ships Market Revenue Million Forecast, by Region 2020 & 2033
- Table 4: Global Autonomous Ships Market Revenue Million Forecast, by Type 2020 & 2033
- Table 5: Global Autonomous Ships Market Revenue Million Forecast, by Application 2020 & 2033
- Table 6: Global Autonomous Ships Market Revenue Million Forecast, by Country 2020 & 2033
- Table 7: United States Autonomous Ships Market Revenue (Million) Forecast, by Application 2020 & 2033
- Table 8: Canada Autonomous Ships Market Revenue (Million) Forecast, by Application 2020 & 2033
- Table 9: Global Autonomous Ships Market Revenue Million Forecast, by Type 2020 & 2033
- Table 10: Global Autonomous Ships Market Revenue Million Forecast, by Application 2020 & 2033
- Table 11: Global Autonomous Ships Market Revenue Million Forecast, by Country 2020 & 2033
- Table 12: United Kingdom Autonomous Ships Market Revenue (Million) Forecast, by Application 2020 & 2033
- Table 13: Germany Autonomous Ships Market Revenue (Million) Forecast, by Application 2020 & 2033
- Table 14: France Autonomous Ships Market Revenue (Million) Forecast, by Application 2020 & 2033
- Table 15: Italy Autonomous Ships Market Revenue (Million) Forecast, by Application 2020 & 2033
- Table 16: Russia Autonomous Ships Market Revenue (Million) Forecast, by Application 2020 & 2033
- Table 17: Rest of Europe Autonomous Ships Market Revenue (Million) Forecast, by Application 2020 & 2033
- Table 18: Global Autonomous Ships Market Revenue Million Forecast, by Type 2020 & 2033
- Table 19: Global Autonomous Ships Market Revenue Million Forecast, by Application 2020 & 2033
- Table 20: Global Autonomous Ships Market Revenue Million Forecast, by Country 2020 & 2033
- Table 21: China Autonomous Ships Market Revenue (Million) Forecast, by Application 2020 & 2033
- Table 22: India Autonomous Ships Market Revenue (Million) Forecast, by Application 2020 & 2033
- Table 23: Japan Autonomous Ships Market Revenue (Million) Forecast, by Application 2020 & 2033
- Table 24: South Korea Autonomous Ships Market Revenue (Million) Forecast, by Application 2020 & 2033
- Table 25: Australia Autonomous Ships Market Revenue (Million) Forecast, by Application 2020 & 2033
- Table 26: Rest of Asia Pacific Autonomous Ships Market Revenue (Million) Forecast, by Application 2020 & 2033
- Table 27: Global Autonomous Ships Market Revenue Million Forecast, by Type 2020 & 2033
- Table 28: Global Autonomous Ships Market Revenue Million Forecast, by Application 2020 & 2033
- Table 29: Global Autonomous Ships Market Revenue Million Forecast, by Country 2020 & 2033
- Table 30: Brazil Autonomous Ships Market Revenue (Million) Forecast, by Application 2020 & 2033
- Table 31: Rest of Latin America Autonomous Ships Market Revenue (Million) Forecast, by Application 2020 & 2033
- Table 32: Global Autonomous Ships Market Revenue Million Forecast, by Type 2020 & 2033
- Table 33: Global Autonomous Ships Market Revenue Million Forecast, by Application 2020 & 2033
- Table 34: Global Autonomous Ships Market Revenue Million Forecast, by Country 2020 & 2033
- Table 35: Saudi Arabia Autonomous Ships Market Revenue (Million) Forecast, by Application 2020 & 2033
- Table 36: United Arab Emirates Autonomous Ships Market Revenue (Million) Forecast, by Application 2020 & 2033
- Table 37: Qatar Autonomous Ships Market Revenue (Million) Forecast, by Application 2020 & 2033
- Table 38: Egypt Autonomous Ships Market Revenue (Million) Forecast, by Application 2020 & 2033
- Table 39: South Africa Autonomous Ships Market Revenue (Million) Forecast, by Application 2020 & 2033
- Table 40: Rest of Middle East and Africa Autonomous Ships Market Revenue (Million) Forecast, by Application 2020 & 2033
Frequently Asked Questions
1. What is the projected Compound Annual Growth Rate (CAGR) of the Autonomous Ships Market?
The projected CAGR is approximately 7.30%.
2. Which companies are prominent players in the Autonomous Ships Market?
Key companies in the market include ABB Ltd, DNV AS, Wärtsilä Corporation, Nippon Yusen Kabushiki Kaisha (NYK Line), Fugr, Kongsberg Gruppen ASA, MITSUI E&S Co Ltd, Vigor Industrial LLC, Rolls-Royce plc, Praxis Automation Technology B V, Hanwha Corporation, HD Hyundai Heavy Industries Co Ltd.
3. What are the main segments of the Autonomous Ships Market?
The market segments include Type, Application.
4. Can you provide details about the market size?
The market size is estimated to be USD 8.38 Million as of 2022.
5. What are some drivers contributing to market growth?
N/A
6. What are the notable trends driving market growth?
The Commercial Segment of the Market is Anticipated to Register the Highest Growth During the Forecast Period.
7. Are there any restraints impacting market growth?
N/A
8. Can you provide examples of recent developments in the market?
February 2023: Austal USA delivered the US Navy its autonomous capable EPF 13 ship. Austal integrated an automated maintenance, health monitoring, and mission readiness capability into EPF 13. It will enable the vessel to operate for up to 30 days without human intervention in combination with existing highly automated hull, mechanical & electrical systems installed on EPF class vessels.
9. What pricing options are available for accessing the report?
Pricing options include single-user, multi-user, and enterprise licenses priced at USD 4750, USD 5250, and USD 8750 respectively.
10. Is the market size provided in terms of value or volume?
The market size is provided in terms of value, measured in Million.
11. Are there any specific market keywords associated with the report?
Yes, the market keyword associated with the report is "Autonomous Ships Market," which aids in identifying and referencing the specific market segment covered.
12. How do I determine which pricing option suits my needs best?
The pricing options vary based on user requirements and access needs. Individual users may opt for single-user licenses, while businesses requiring broader access may choose multi-user or enterprise licenses for cost-effective access to the report.
13. Are there any additional resources or data provided in the Autonomous Ships Market report?
While the report offers comprehensive insights, it's advisable to review the specific contents or supplementary materials provided to ascertain if additional resources or data are available.
14. How can I stay updated on further developments or reports in the Autonomous Ships Market?
To stay informed about further developments, trends, and reports in the Autonomous Ships Market, consider subscribing to industry newsletters, following relevant companies and organizations, or regularly checking reputable industry news sources and publications.
Methodology
Step 1 - Identification of Relevant Samples Size from Population Database


Step 2 - Approaches for Defining Global Market Size (Value, Volume* & Price*)

Note*: In applicable scenarios
Step 3 - Data Sources
Primary Research
- Web Analytics
- Survey Reports
- Research Institute
- Latest Research Reports
- Opinion Leaders
Secondary Research
- Annual Reports
- White Paper
- Latest Press Release
- Industry Association
- Paid Database
- Investor Presentations

Step 4 - Data Triangulation
Involves using different sources of information in order to increase the validity of a study
These sources are likely to be stakeholders in a program - participants, other researchers, program staff, other community members, and so on.
Then we put all data in single framework & apply various statistical tools to find out the dynamic on the market.
During the analysis stage, feedback from the stakeholder groups would be compared to determine areas of agreement as well as areas of divergence