
Key Insights
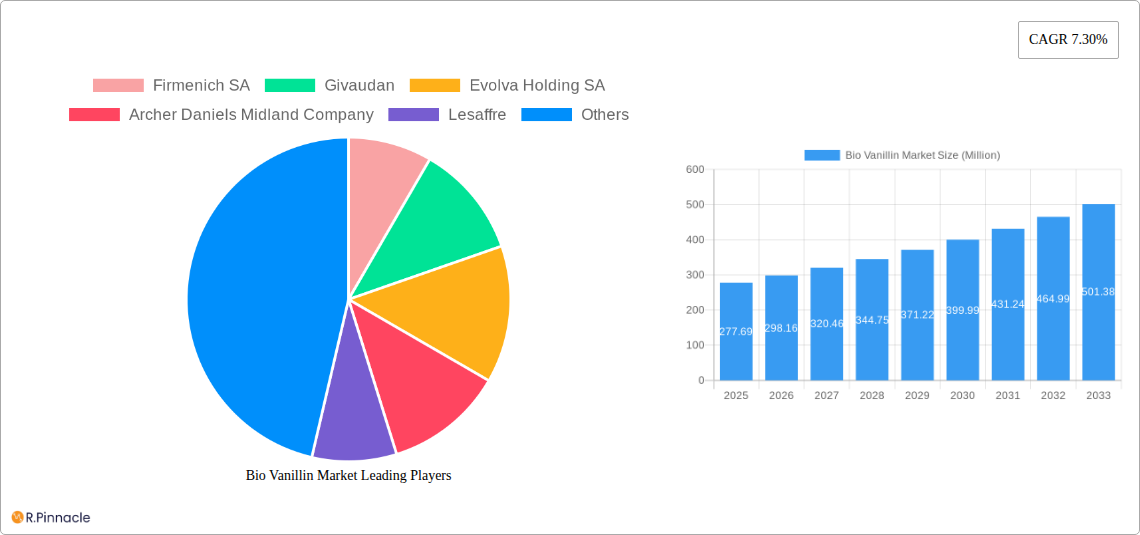
The global bio vanillin market, valued at $277.69 million in 2025, is projected to experience robust growth, driven by increasing consumer demand for natural and clean-label products in the food and beverage, pharmaceutical, and fragrance industries. The preference for bio-based alternatives over synthetic vanillin is a significant driver, fueled by growing health consciousness and concerns regarding the potential negative impacts of synthetic chemicals. Furthermore, the expanding applications of vanillin in diverse sectors, coupled with ongoing research and development efforts to enhance production efficiency and reduce costs, are contributing to market expansion. The Food and Beverage segment currently dominates the market, owing to vanillin's widespread use as a flavoring agent in various food products, including baked goods, confectionery, and beverages. However, the pharmaceutical and fragrance sectors are exhibiting strong growth potential, driven by the increasing use of vanillin in medicinal preparations and high-end perfumes. Geographical expansion, particularly in Asia-Pacific, fueled by rising disposable incomes and a burgeoning middle class with a preference for premium products, is another key factor shaping market dynamics. While potential restraints like fluctuating raw material prices and the relatively high cost of bio-based vanillin production compared to synthetic alternatives exist, ongoing technological advancements are expected to mitigate these challenges in the coming years.
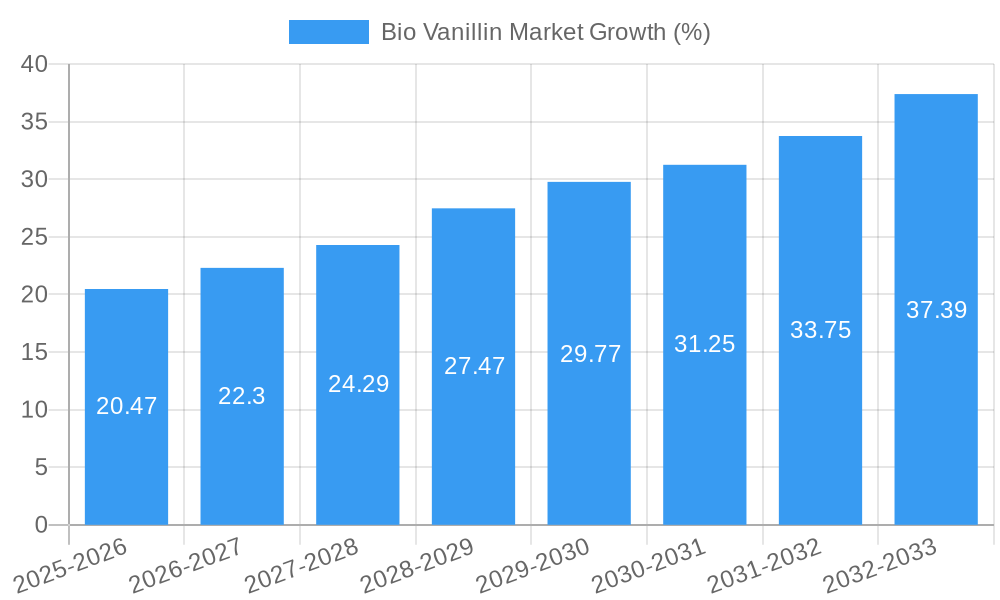
The competitive landscape of the bio vanillin market is characterized by the presence of both large multinational corporations and smaller specialized companies. Key players such as Firmenich SA, Givaudan, and Evolva Holding SA are investing heavily in research and development to enhance their product portfolios and cater to the growing demand for high-quality bio vanillin. Strategic collaborations, mergers, and acquisitions are also likely to shape the industry landscape, as companies seek to expand their market reach and strengthen their competitive positions. The forecast period of 2025-2033 is expected to witness significant market expansion, with a Compound Annual Growth Rate (CAGR) of 7.30%, driven by the factors outlined above. This growth will be further influenced by advancements in fermentation technologies, leading to more efficient and cost-effective bio vanillin production, making it increasingly competitive with synthetic alternatives.
Bio Vanillin Market Report: A Comprehensive Analysis (2019-2033)
This in-depth report provides a comprehensive analysis of the Bio Vanillin Market, offering actionable insights for industry professionals, investors, and stakeholders. With a study period spanning 2019-2033, a base year of 2025, and a forecast period of 2025-2033, this report leverages extensive market research and data analysis to deliver a clear understanding of current market dynamics and future growth potential. The global Bio Vanillin Market is projected to reach xx Million by 2033, exhibiting a CAGR of xx% during the forecast period.
Bio Vanillin Market Structure & Innovation Trends
This section analyzes the competitive landscape of the Bio Vanillin Market, exploring market concentration, innovation drivers, regulatory frameworks, and M&A activities. The market is moderately concentrated, with key players such as Firmenich SA, Givaudan, Evolva Holding SA, Archer Daniels Midland Company, Lesaffre, Advanced Biotech, AUROCHEMICAL, and Apple Flavor & Fragrance Group Co Ltd holding significant market share. Market share distribution varies across segments and regions, with specific data detailed in the full report.
- Market Concentration: The Herfindahl-Hirschman Index (HHI) is estimated at xx, indicating a moderately concentrated market.
- Innovation Drivers: Growing demand for natural and sustainable ingredients in food and fragrance applications is a primary driver of innovation. Advances in bio-fermentation technology are also significantly impacting production efficiency and cost.
- Regulatory Landscape: Regulations regarding food additives and labeling influence market dynamics, demanding stringent quality control and compliance.
- Product Substitutes: Synthetic vanillin remains a significant competitor; however, growing consumer preference for natural alternatives fuels Bio Vanillin market expansion.
- End-User Demographics: The primary end-users are food and beverage manufacturers, followed by pharmaceutical and fragrance companies. Consumer demand for natural products is shaping this segment.
- M&A Activities: The report analyzes recent mergers and acquisitions (M&A) within the Bio Vanillin industry. Total M&A deal value in the last five years is estimated at xx Million.
Bio Vanillin Market Dynamics & Trends
The Bio Vanillin Market is experiencing robust growth driven by several factors: rising consumer demand for natural and clean-label products, increasing health consciousness, and the growing preference for sustainable and ethically sourced ingredients. Technological advancements in bio-fermentation, enabling higher production yields and reduced costs, are also contributing to this expansion. The increasing application of Bio Vanillin in various industries—food and beverages, pharmaceuticals, and fragrances—further fuels market growth. Competitive dynamics are shaped by product innovation, pricing strategies, and brand reputation. The market penetration of Bio Vanillin in the food and beverage industry is estimated at xx%, showing significant growth potential in other sectors.
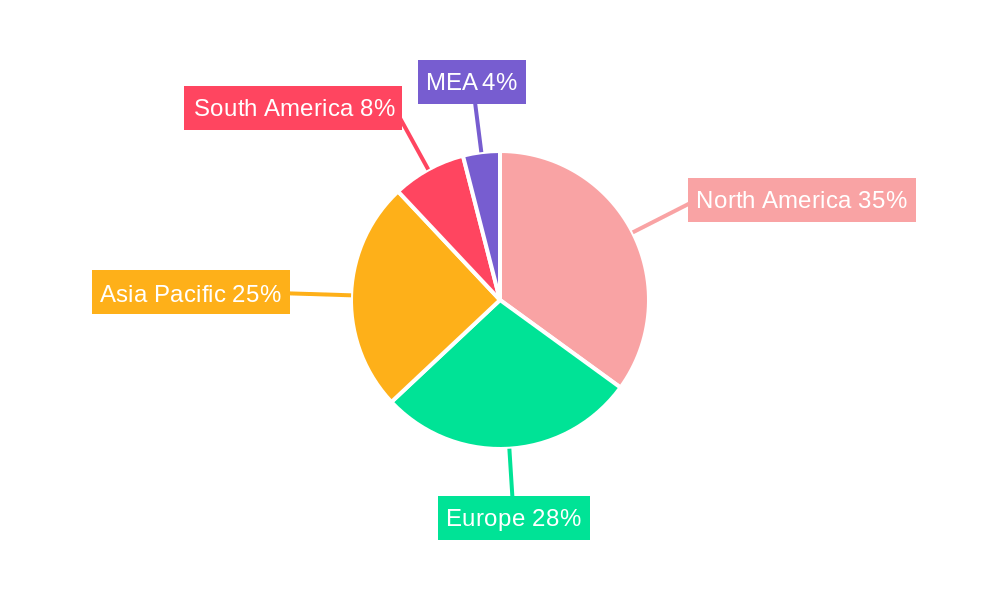
Dominant Regions & Segments in Bio Vanillin Market
The report identifies [Region Name] as the dominant region in the Bio Vanillin Market, driven by [Specific Reasons, e.g., strong demand for natural products, robust food and beverage industry, favorable government regulations].
Key Drivers in [Region Name]:
- Robust economic growth and rising disposable incomes.
- Favorable government policies supporting the natural food and beverage sector.
- Well-established food processing and manufacturing infrastructure.
Dominant Segment by Application: The Food and Beverage segment currently holds the largest market share, driven by the increasing demand for natural flavors and ingredients in various food and beverage products. Further regional and segmental breakdowns with detailed analyses are available in the full report.
Bio Vanillin Market Product Innovations
Recent product developments focus on improving the quality, purity, and consistency of Bio Vanillin, utilizing advanced bio-fermentation techniques. These innovations aim to enhance the flavor profile and optimize the cost-effectiveness of Bio Vanillin production, making it a competitive alternative to synthetic vanillin. The market is witnessing the emergence of Bio Vanillin with enhanced functionalities, leading to broader applications across diverse industries.
Report Scope & Segmentation Analysis
The Bio Vanillin market is segmented by application into: Food & Beverage, Pharmaceutical, and Fragrance.
Food & Beverage: This segment is projected to reach xx Million by 2033, experiencing robust growth due to rising consumer demand for natural flavors and clean-label products. Competition is intense, with various companies vying for market share through product innovation and pricing strategies.
Pharmaceutical: This segment is expected to reach xx Million by 2033, driven by the increasing utilization of Bio Vanillin in pharmaceutical formulations. The market exhibits moderate competition with a focus on quality and regulatory compliance.
Fragrance: This segment is anticipated to reach xx Million by 2033, with steady growth driven by the rising demand for natural fragrances in personal care and cosmetic products. The market features established players with well-developed supply chains.
Key Drivers of Bio Vanillin Market Growth
The key growth drivers for the Bio Vanillin market are the rising consumer preference for natural and sustainable products, stringent regulations against synthetic vanillin in certain regions, and advancements in bio-fermentation technology resulting in improved production yields and lower costs. The growing health and wellness awareness among consumers also significantly contributes to market expansion.
Challenges in the Bio Vanillin Market Sector
The Bio Vanillin market faces challenges such as fluctuations in raw material prices, potential supply chain disruptions, and the competitive pressure from synthetic vanillin. Regulatory compliance across various regions can also pose complexities for manufacturers. The higher production cost of Bio Vanillin compared to synthetic vanillin is another significant factor impacting market growth.
Emerging Opportunities in Bio Vanillin Market
Emerging opportunities lie in expanding into new geographical markets, particularly in developing economies with a growing middle class and increasing consumer spending. Advancements in biotechnology could lead to the development of even more sustainable and efficient production methods. Further exploration of niche applications of Bio Vanillin across various industries could also lead to market expansion.
Leading Players in the Bio Vanillin Market Market
- Firmenich SA
- Givaudan
- Evolva Holding SA
- Archer Daniels Midland Company
- Lesaffre
- Advanced Biotech
- AUROCHEMICAL
- Apple Flavor & Fragrance Group Co Ltd
Key Developments in Bio Vanillin Market Industry
- January 2023: Company X launched a new, sustainably sourced Bio Vanillin product.
- March 2022: Firmenich SA and Company Y announced a strategic partnership to expand Bio Vanillin production capacity.
- July 2021: New regulations regarding the use of synthetic vanillin were implemented in [Region].
Future Outlook for Bio Vanillin Market Market
The future outlook for the Bio Vanillin Market is very positive, driven by sustained growth in demand for natural and sustainable ingredients across various sectors. Strategic partnerships, technological innovations, and expansion into new geographic markets are expected to fuel further market expansion. The focus on sustainability and increasing consumer awareness of environmentally friendly products will further propel market growth in the coming years.
Bio Vanillin Market Segmentation
-
1. Application
-
1.1. Food
- 1.1.1. Ice Cream
- 1.1.2. Baked Goods
- 1.1.3. Chocolate
- 1.1.4. Other Foods
- 1.2. Beverage
- 1.3. Pharmaceutical
- 1.4. Fragrance
-
1.1. Food
Bio Vanillin Market Segmentation By Geography
-
1. North America
- 1.1. United States
- 1.2. Canada
- 1.3. Mexico
- 1.4. Rest of North America
-
2. Europe
- 2.1. United Kingdom
- 2.2. Germany
- 2.3. France
- 2.4. Russia
- 2.5. Italy
- 2.6. Rest of Europe
-
3. Asia Pacific
- 3.1. India
- 3.2. China
- 3.3. Japan
- 3.4. Australia
- 3.5. Rest of Asia Pacific
-
4. Rest of the World
- 4.1. South America
- 4.2. Middle East
Bio Vanillin Market REPORT HIGHLIGHTS
| Aspects | Details |
|---|---|
| Study Period | 2019-2033 |
| Base Year | 2024 |
| Estimated Year | 2025 |
| Forecast Period | 2025-2033 |
| Historical Period | 2019-2024 |
| Growth Rate | CAGR of 7.30% from 2019-2033 |
| Segmentation |
|
Table of Contents
- 1. Introduction
- 1.1. Research Scope
- 1.2. Market Segmentation
- 1.3. Research Methodology
- 1.4. Definitions and Assumptions
- 2. Executive Summary
- 2.1. Introduction
- 3. Market Dynamics
- 3.1. Introduction
- 3.2. Market Drivers
- 3.2.1. Surge in Demand for 'Free-from' Food Products; Demand For Convenient And Healthy On-the-go Snacking Options
- 3.3. Market Restrains
- 3.3.1. Health Risk Associated with Certain Ingredients
- 3.4. Market Trends
- 3.4.1. Growing Demand for Bio Vanillin in the Food and Beverage Industry
- 4. Market Factor Analysis
- 4.1. Porters Five Forces
- 4.2. Supply/Value Chain
- 4.3. PESTEL analysis
- 4.4. Market Entropy
- 4.5. Patent/Trademark Analysis
- 5. Global Bio Vanillin Market Analysis, Insights and Forecast, 2019-2031
- 5.1. Market Analysis, Insights and Forecast - by Application
- 5.1.1. Food
- 5.1.1.1. Ice Cream
- 5.1.1.2. Baked Goods
- 5.1.1.3. Chocolate
- 5.1.1.4. Other Foods
- 5.1.2. Beverage
- 5.1.3. Pharmaceutical
- 5.1.4. Fragrance
- 5.1.1. Food
- 5.2. Market Analysis, Insights and Forecast - by Region
- 5.2.1. North America
- 5.2.2. Europe
- 5.2.3. Asia Pacific
- 5.2.4. Rest of the World
- 5.1. Market Analysis, Insights and Forecast - by Application
- 6. North America Bio Vanillin Market Analysis, Insights and Forecast, 2019-2031
- 6.1. Market Analysis, Insights and Forecast - by Application
- 6.1.1. Food
- 6.1.1.1. Ice Cream
- 6.1.1.2. Baked Goods
- 6.1.1.3. Chocolate
- 6.1.1.4. Other Foods
- 6.1.2. Beverage
- 6.1.3. Pharmaceutical
- 6.1.4. Fragrance
- 6.1.1. Food
- 6.1. Market Analysis, Insights and Forecast - by Application
- 7. Europe Bio Vanillin Market Analysis, Insights and Forecast, 2019-2031
- 7.1. Market Analysis, Insights and Forecast - by Application
- 7.1.1. Food
- 7.1.1.1. Ice Cream
- 7.1.1.2. Baked Goods
- 7.1.1.3. Chocolate
- 7.1.1.4. Other Foods
- 7.1.2. Beverage
- 7.1.3. Pharmaceutical
- 7.1.4. Fragrance
- 7.1.1. Food
- 7.1. Market Analysis, Insights and Forecast - by Application
- 8. Asia Pacific Bio Vanillin Market Analysis, Insights and Forecast, 2019-2031
- 8.1. Market Analysis, Insights and Forecast - by Application
- 8.1.1. Food
- 8.1.1.1. Ice Cream
- 8.1.1.2. Baked Goods
- 8.1.1.3. Chocolate
- 8.1.1.4. Other Foods
- 8.1.2. Beverage
- 8.1.3. Pharmaceutical
- 8.1.4. Fragrance
- 8.1.1. Food
- 8.1. Market Analysis, Insights and Forecast - by Application
- 9. Rest of the World Bio Vanillin Market Analysis, Insights and Forecast, 2019-2031
- 9.1. Market Analysis, Insights and Forecast - by Application
- 9.1.1. Food
- 9.1.1.1. Ice Cream
- 9.1.1.2. Baked Goods
- 9.1.1.3. Chocolate
- 9.1.1.4. Other Foods
- 9.1.2. Beverage
- 9.1.3. Pharmaceutical
- 9.1.4. Fragrance
- 9.1.1. Food
- 9.1. Market Analysis, Insights and Forecast - by Application
- 10. North America Bio Vanillin Market Analysis, Insights and Forecast, 2019-2031
- 10.1. Market Analysis, Insights and Forecast - By Country/Sub-region
- 10.1.1 United States
- 10.1.2 Canada
- 10.1.3 Mexico
- 11. Europe Bio Vanillin Market Analysis, Insights and Forecast, 2019-2031
- 11.1. Market Analysis, Insights and Forecast - By Country/Sub-region
- 11.1.1 Germany
- 11.1.2 United Kingdom
- 11.1.3 France
- 11.1.4 Spain
- 11.1.5 Italy
- 11.1.6 Spain
- 11.1.7 Belgium
- 11.1.8 Netherland
- 11.1.9 Nordics
- 11.1.10 Rest of Europe
- 12. Asia Pacific Bio Vanillin Market Analysis, Insights and Forecast, 2019-2031
- 12.1. Market Analysis, Insights and Forecast - By Country/Sub-region
- 12.1.1 China
- 12.1.2 Japan
- 12.1.3 India
- 12.1.4 South Korea
- 12.1.5 Southeast Asia
- 12.1.6 Australia
- 12.1.7 Indonesia
- 12.1.8 Phillipes
- 12.1.9 Singapore
- 12.1.10 Thailandc
- 12.1.11 Rest of Asia Pacific
- 13. South America Bio Vanillin Market Analysis, Insights and Forecast, 2019-2031
- 13.1. Market Analysis, Insights and Forecast - By Country/Sub-region
- 13.1.1 Brazil
- 13.1.2 Argentina
- 13.1.3 Peru
- 13.1.4 Chile
- 13.1.5 Colombia
- 13.1.6 Ecuador
- 13.1.7 Venezuela
- 13.1.8 Rest of South America
- 14. MEA Bio Vanillin Market Analysis, Insights and Forecast, 2019-2031
- 14.1. Market Analysis, Insights and Forecast - By Country/Sub-region
- 14.1.1 United Arab Emirates
- 14.1.2 Saudi Arabia
- 14.1.3 South Africa
- 14.1.4 Rest of Middle East and Africa
- 15. Competitive Analysis
- 15.1. Global Market Share Analysis 2024
- 15.2. Company Profiles
- 15.2.1 Firmenich SA
- 15.2.1.1. Overview
- 15.2.1.2. Products
- 15.2.1.3. SWOT Analysis
- 15.2.1.4. Recent Developments
- 15.2.1.5. Financials (Based on Availability)
- 15.2.2 Givaudan
- 15.2.2.1. Overview
- 15.2.2.2. Products
- 15.2.2.3. SWOT Analysis
- 15.2.2.4. Recent Developments
- 15.2.2.5. Financials (Based on Availability)
- 15.2.3 Evolva Holding SA
- 15.2.3.1. Overview
- 15.2.3.2. Products
- 15.2.3.3. SWOT Analysis
- 15.2.3.4. Recent Developments
- 15.2.3.5. Financials (Based on Availability)
- 15.2.4 Archer Daniels Midland Company
- 15.2.4.1. Overview
- 15.2.4.2. Products
- 15.2.4.3. SWOT Analysis
- 15.2.4.4. Recent Developments
- 15.2.4.5. Financials (Based on Availability)
- 15.2.5 Lesaffre
- 15.2.5.1. Overview
- 15.2.5.2. Products
- 15.2.5.3. SWOT Analysis
- 15.2.5.4. Recent Developments
- 15.2.5.5. Financials (Based on Availability)
- 15.2.6 Advanced Biotech
- 15.2.6.1. Overview
- 15.2.6.2. Products
- 15.2.6.3. SWOT Analysis
- 15.2.6.4. Recent Developments
- 15.2.6.5. Financials (Based on Availability)
- 15.2.7 AUROCHEMICAL
- 15.2.7.1. Overview
- 15.2.7.2. Products
- 15.2.7.3. SWOT Analysis
- 15.2.7.4. Recent Developments
- 15.2.7.5. Financials (Based on Availability)
- 15.2.8 Apple Flavor & Fragrance Group Co Ltd
- 15.2.8.1. Overview
- 15.2.8.2. Products
- 15.2.8.3. SWOT Analysis
- 15.2.8.4. Recent Developments
- 15.2.8.5. Financials (Based on Availability)
- 15.2.1 Firmenich SA
List of Figures
- Figure 1: Global Bio Vanillin Market Revenue Breakdown (Million, %) by Region 2024 & 2032
- Figure 2: Global Bio Vanillin Market Volume Breakdown (K Units, %) by Region 2024 & 2032
- Figure 3: North America Bio Vanillin Market Revenue (Million), by Country 2024 & 2032
- Figure 4: North America Bio Vanillin Market Volume (K Units), by Country 2024 & 2032
- Figure 5: North America Bio Vanillin Market Revenue Share (%), by Country 2024 & 2032
- Figure 6: North America Bio Vanillin Market Volume Share (%), by Country 2024 & 2032
- Figure 7: Europe Bio Vanillin Market Revenue (Million), by Country 2024 & 2032
- Figure 8: Europe Bio Vanillin Market Volume (K Units), by Country 2024 & 2032
- Figure 9: Europe Bio Vanillin Market Revenue Share (%), by Country 2024 & 2032
- Figure 10: Europe Bio Vanillin Market Volume Share (%), by Country 2024 & 2032
- Figure 11: Asia Pacific Bio Vanillin Market Revenue (Million), by Country 2024 & 2032
- Figure 12: Asia Pacific Bio Vanillin Market Volume (K Units), by Country 2024 & 2032
- Figure 13: Asia Pacific Bio Vanillin Market Revenue Share (%), by Country 2024 & 2032
- Figure 14: Asia Pacific Bio Vanillin Market Volume Share (%), by Country 2024 & 2032
- Figure 15: South America Bio Vanillin Market Revenue (Million), by Country 2024 & 2032
- Figure 16: South America Bio Vanillin Market Volume (K Units), by Country 2024 & 2032
- Figure 17: South America Bio Vanillin Market Revenue Share (%), by Country 2024 & 2032
- Figure 18: South America Bio Vanillin Market Volume Share (%), by Country 2024 & 2032
- Figure 19: MEA Bio Vanillin Market Revenue (Million), by Country 2024 & 2032
- Figure 20: MEA Bio Vanillin Market Volume (K Units), by Country 2024 & 2032
- Figure 21: MEA Bio Vanillin Market Revenue Share (%), by Country 2024 & 2032
- Figure 22: MEA Bio Vanillin Market Volume Share (%), by Country 2024 & 2032
- Figure 23: North America Bio Vanillin Market Revenue (Million), by Application 2024 & 2032
- Figure 24: North America Bio Vanillin Market Volume (K Units), by Application 2024 & 2032
- Figure 25: North America Bio Vanillin Market Revenue Share (%), by Application 2024 & 2032
- Figure 26: North America Bio Vanillin Market Volume Share (%), by Application 2024 & 2032
- Figure 27: North America Bio Vanillin Market Revenue (Million), by Country 2024 & 2032
- Figure 28: North America Bio Vanillin Market Volume (K Units), by Country 2024 & 2032
- Figure 29: North America Bio Vanillin Market Revenue Share (%), by Country 2024 & 2032
- Figure 30: North America Bio Vanillin Market Volume Share (%), by Country 2024 & 2032
- Figure 31: Europe Bio Vanillin Market Revenue (Million), by Application 2024 & 2032
- Figure 32: Europe Bio Vanillin Market Volume (K Units), by Application 2024 & 2032
- Figure 33: Europe Bio Vanillin Market Revenue Share (%), by Application 2024 & 2032
- Figure 34: Europe Bio Vanillin Market Volume Share (%), by Application 2024 & 2032
- Figure 35: Europe Bio Vanillin Market Revenue (Million), by Country 2024 & 2032
- Figure 36: Europe Bio Vanillin Market Volume (K Units), by Country 2024 & 2032
- Figure 37: Europe Bio Vanillin Market Revenue Share (%), by Country 2024 & 2032
- Figure 38: Europe Bio Vanillin Market Volume Share (%), by Country 2024 & 2032
- Figure 39: Asia Pacific Bio Vanillin Market Revenue (Million), by Application 2024 & 2032
- Figure 40: Asia Pacific Bio Vanillin Market Volume (K Units), by Application 2024 & 2032
- Figure 41: Asia Pacific Bio Vanillin Market Revenue Share (%), by Application 2024 & 2032
- Figure 42: Asia Pacific Bio Vanillin Market Volume Share (%), by Application 2024 & 2032
- Figure 43: Asia Pacific Bio Vanillin Market Revenue (Million), by Country 2024 & 2032
- Figure 44: Asia Pacific Bio Vanillin Market Volume (K Units), by Country 2024 & 2032
- Figure 45: Asia Pacific Bio Vanillin Market Revenue Share (%), by Country 2024 & 2032
- Figure 46: Asia Pacific Bio Vanillin Market Volume Share (%), by Country 2024 & 2032
- Figure 47: Rest of the World Bio Vanillin Market Revenue (Million), by Application 2024 & 2032
- Figure 48: Rest of the World Bio Vanillin Market Volume (K Units), by Application 2024 & 2032
- Figure 49: Rest of the World Bio Vanillin Market Revenue Share (%), by Application 2024 & 2032
- Figure 50: Rest of the World Bio Vanillin Market Volume Share (%), by Application 2024 & 2032
- Figure 51: Rest of the World Bio Vanillin Market Revenue (Million), by Country 2024 & 2032
- Figure 52: Rest of the World Bio Vanillin Market Volume (K Units), by Country 2024 & 2032
- Figure 53: Rest of the World Bio Vanillin Market Revenue Share (%), by Country 2024 & 2032
- Figure 54: Rest of the World Bio Vanillin Market Volume Share (%), by Country 2024 & 2032
List of Tables
- Table 1: Global Bio Vanillin Market Revenue Million Forecast, by Region 2019 & 2032
- Table 2: Global Bio Vanillin Market Volume K Units Forecast, by Region 2019 & 2032
- Table 3: Global Bio Vanillin Market Revenue Million Forecast, by Application 2019 & 2032
- Table 4: Global Bio Vanillin Market Volume K Units Forecast, by Application 2019 & 2032
- Table 5: Global Bio Vanillin Market Revenue Million Forecast, by Region 2019 & 2032
- Table 6: Global Bio Vanillin Market Volume K Units Forecast, by Region 2019 & 2032
- Table 7: Global Bio Vanillin Market Revenue Million Forecast, by Country 2019 & 2032
- Table 8: Global Bio Vanillin Market Volume K Units Forecast, by Country 2019 & 2032
- Table 9: United States Bio Vanillin Market Revenue (Million) Forecast, by Application 2019 & 2032
- Table 10: United States Bio Vanillin Market Volume (K Units) Forecast, by Application 2019 & 2032
- Table 11: Canada Bio Vanillin Market Revenue (Million) Forecast, by Application 2019 & 2032
- Table 12: Canada Bio Vanillin Market Volume (K Units) Forecast, by Application 2019 & 2032
- Table 13: Mexico Bio Vanillin Market Revenue (Million) Forecast, by Application 2019 & 2032
- Table 14: Mexico Bio Vanillin Market Volume (K Units) Forecast, by Application 2019 & 2032
- Table 15: Global Bio Vanillin Market Revenue Million Forecast, by Country 2019 & 2032
- Table 16: Global Bio Vanillin Market Volume K Units Forecast, by Country 2019 & 2032
- Table 17: Germany Bio Vanillin Market Revenue (Million) Forecast, by Application 2019 & 2032
- Table 18: Germany Bio Vanillin Market Volume (K Units) Forecast, by Application 2019 & 2032
- Table 19: United Kingdom Bio Vanillin Market Revenue (Million) Forecast, by Application 2019 & 2032
- Table 20: United Kingdom Bio Vanillin Market Volume (K Units) Forecast, by Application 2019 & 2032
- Table 21: France Bio Vanillin Market Revenue (Million) Forecast, by Application 2019 & 2032
- Table 22: France Bio Vanillin Market Volume (K Units) Forecast, by Application 2019 & 2032
- Table 23: Spain Bio Vanillin Market Revenue (Million) Forecast, by Application 2019 & 2032
- Table 24: Spain Bio Vanillin Market Volume (K Units) Forecast, by Application 2019 & 2032
- Table 25: Italy Bio Vanillin Market Revenue (Million) Forecast, by Application 2019 & 2032
- Table 26: Italy Bio Vanillin Market Volume (K Units) Forecast, by Application 2019 & 2032
- Table 27: Spain Bio Vanillin Market Revenue (Million) Forecast, by Application 2019 & 2032
- Table 28: Spain Bio Vanillin Market Volume (K Units) Forecast, by Application 2019 & 2032
- Table 29: Belgium Bio Vanillin Market Revenue (Million) Forecast, by Application 2019 & 2032
- Table 30: Belgium Bio Vanillin Market Volume (K Units) Forecast, by Application 2019 & 2032
- Table 31: Netherland Bio Vanillin Market Revenue (Million) Forecast, by Application 2019 & 2032
- Table 32: Netherland Bio Vanillin Market Volume (K Units) Forecast, by Application 2019 & 2032
- Table 33: Nordics Bio Vanillin Market Revenue (Million) Forecast, by Application 2019 & 2032
- Table 34: Nordics Bio Vanillin Market Volume (K Units) Forecast, by Application 2019 & 2032
- Table 35: Rest of Europe Bio Vanillin Market Revenue (Million) Forecast, by Application 2019 & 2032
- Table 36: Rest of Europe Bio Vanillin Market Volume (K Units) Forecast, by Application 2019 & 2032
- Table 37: Global Bio Vanillin Market Revenue Million Forecast, by Country 2019 & 2032
- Table 38: Global Bio Vanillin Market Volume K Units Forecast, by Country 2019 & 2032
- Table 39: China Bio Vanillin Market Revenue (Million) Forecast, by Application 2019 & 2032
- Table 40: China Bio Vanillin Market Volume (K Units) Forecast, by Application 2019 & 2032
- Table 41: Japan Bio Vanillin Market Revenue (Million) Forecast, by Application 2019 & 2032
- Table 42: Japan Bio Vanillin Market Volume (K Units) Forecast, by Application 2019 & 2032
- Table 43: India Bio Vanillin Market Revenue (Million) Forecast, by Application 2019 & 2032
- Table 44: India Bio Vanillin Market Volume (K Units) Forecast, by Application 2019 & 2032
- Table 45: South Korea Bio Vanillin Market Revenue (Million) Forecast, by Application 2019 & 2032
- Table 46: South Korea Bio Vanillin Market Volume (K Units) Forecast, by Application 2019 & 2032
- Table 47: Southeast Asia Bio Vanillin Market Revenue (Million) Forecast, by Application 2019 & 2032
- Table 48: Southeast Asia Bio Vanillin Market Volume (K Units) Forecast, by Application 2019 & 2032
- Table 49: Australia Bio Vanillin Market Revenue (Million) Forecast, by Application 2019 & 2032
- Table 50: Australia Bio Vanillin Market Volume (K Units) Forecast, by Application 2019 & 2032
- Table 51: Indonesia Bio Vanillin Market Revenue (Million) Forecast, by Application 2019 & 2032
- Table 52: Indonesia Bio Vanillin Market Volume (K Units) Forecast, by Application 2019 & 2032
- Table 53: Phillipes Bio Vanillin Market Revenue (Million) Forecast, by Application 2019 & 2032
- Table 54: Phillipes Bio Vanillin Market Volume (K Units) Forecast, by Application 2019 & 2032
- Table 55: Singapore Bio Vanillin Market Revenue (Million) Forecast, by Application 2019 & 2032
- Table 56: Singapore Bio Vanillin Market Volume (K Units) Forecast, by Application 2019 & 2032
- Table 57: Thailandc Bio Vanillin Market Revenue (Million) Forecast, by Application 2019 & 2032
- Table 58: Thailandc Bio Vanillin Market Volume (K Units) Forecast, by Application 2019 & 2032
- Table 59: Rest of Asia Pacific Bio Vanillin Market Revenue (Million) Forecast, by Application 2019 & 2032
- Table 60: Rest of Asia Pacific Bio Vanillin Market Volume (K Units) Forecast, by Application 2019 & 2032
- Table 61: Global Bio Vanillin Market Revenue Million Forecast, by Country 2019 & 2032
- Table 62: Global Bio Vanillin Market Volume K Units Forecast, by Country 2019 & 2032
- Table 63: Brazil Bio Vanillin Market Revenue (Million) Forecast, by Application 2019 & 2032
- Table 64: Brazil Bio Vanillin Market Volume (K Units) Forecast, by Application 2019 & 2032
- Table 65: Argentina Bio Vanillin Market Revenue (Million) Forecast, by Application 2019 & 2032
- Table 66: Argentina Bio Vanillin Market Volume (K Units) Forecast, by Application 2019 & 2032
- Table 67: Peru Bio Vanillin Market Revenue (Million) Forecast, by Application 2019 & 2032
- Table 68: Peru Bio Vanillin Market Volume (K Units) Forecast, by Application 2019 & 2032
- Table 69: Chile Bio Vanillin Market Revenue (Million) Forecast, by Application 2019 & 2032
- Table 70: Chile Bio Vanillin Market Volume (K Units) Forecast, by Application 2019 & 2032
- Table 71: Colombia Bio Vanillin Market Revenue (Million) Forecast, by Application 2019 & 2032
- Table 72: Colombia Bio Vanillin Market Volume (K Units) Forecast, by Application 2019 & 2032
- Table 73: Ecuador Bio Vanillin Market Revenue (Million) Forecast, by Application 2019 & 2032
- Table 74: Ecuador Bio Vanillin Market Volume (K Units) Forecast, by Application 2019 & 2032
- Table 75: Venezuela Bio Vanillin Market Revenue (Million) Forecast, by Application 2019 & 2032
- Table 76: Venezuela Bio Vanillin Market Volume (K Units) Forecast, by Application 2019 & 2032
- Table 77: Rest of South America Bio Vanillin Market Revenue (Million) Forecast, by Application 2019 & 2032
- Table 78: Rest of South America Bio Vanillin Market Volume (K Units) Forecast, by Application 2019 & 2032
- Table 79: Global Bio Vanillin Market Revenue Million Forecast, by Country 2019 & 2032
- Table 80: Global Bio Vanillin Market Volume K Units Forecast, by Country 2019 & 2032
- Table 81: United Arab Emirates Bio Vanillin Market Revenue (Million) Forecast, by Application 2019 & 2032
- Table 82: United Arab Emirates Bio Vanillin Market Volume (K Units) Forecast, by Application 2019 & 2032
- Table 83: Saudi Arabia Bio Vanillin Market Revenue (Million) Forecast, by Application 2019 & 2032
- Table 84: Saudi Arabia Bio Vanillin Market Volume (K Units) Forecast, by Application 2019 & 2032
- Table 85: South Africa Bio Vanillin Market Revenue (Million) Forecast, by Application 2019 & 2032
- Table 86: South Africa Bio Vanillin Market Volume (K Units) Forecast, by Application 2019 & 2032
- Table 87: Rest of Middle East and Africa Bio Vanillin Market Revenue (Million) Forecast, by Application 2019 & 2032
- Table 88: Rest of Middle East and Africa Bio Vanillin Market Volume (K Units) Forecast, by Application 2019 & 2032
- Table 89: Global Bio Vanillin Market Revenue Million Forecast, by Application 2019 & 2032
- Table 90: Global Bio Vanillin Market Volume K Units Forecast, by Application 2019 & 2032
- Table 91: Global Bio Vanillin Market Revenue Million Forecast, by Country 2019 & 2032
- Table 92: Global Bio Vanillin Market Volume K Units Forecast, by Country 2019 & 2032
- Table 93: United States Bio Vanillin Market Revenue (Million) Forecast, by Application 2019 & 2032
- Table 94: United States Bio Vanillin Market Volume (K Units) Forecast, by Application 2019 & 2032
- Table 95: Canada Bio Vanillin Market Revenue (Million) Forecast, by Application 2019 & 2032
- Table 96: Canada Bio Vanillin Market Volume (K Units) Forecast, by Application 2019 & 2032
- Table 97: Mexico Bio Vanillin Market Revenue (Million) Forecast, by Application 2019 & 2032
- Table 98: Mexico Bio Vanillin Market Volume (K Units) Forecast, by Application 2019 & 2032
- Table 99: Rest of North America Bio Vanillin Market Revenue (Million) Forecast, by Application 2019 & 2032
- Table 100: Rest of North America Bio Vanillin Market Volume (K Units) Forecast, by Application 2019 & 2032
- Table 101: Global Bio Vanillin Market Revenue Million Forecast, by Application 2019 & 2032
- Table 102: Global Bio Vanillin Market Volume K Units Forecast, by Application 2019 & 2032
- Table 103: Global Bio Vanillin Market Revenue Million Forecast, by Country 2019 & 2032
- Table 104: Global Bio Vanillin Market Volume K Units Forecast, by Country 2019 & 2032
- Table 105: United Kingdom Bio Vanillin Market Revenue (Million) Forecast, by Application 2019 & 2032
- Table 106: United Kingdom Bio Vanillin Market Volume (K Units) Forecast, by Application 2019 & 2032
- Table 107: Germany Bio Vanillin Market Revenue (Million) Forecast, by Application 2019 & 2032
- Table 108: Germany Bio Vanillin Market Volume (K Units) Forecast, by Application 2019 & 2032
- Table 109: France Bio Vanillin Market Revenue (Million) Forecast, by Application 2019 & 2032
- Table 110: France Bio Vanillin Market Volume (K Units) Forecast, by Application 2019 & 2032
- Table 111: Russia Bio Vanillin Market Revenue (Million) Forecast, by Application 2019 & 2032
- Table 112: Russia Bio Vanillin Market Volume (K Units) Forecast, by Application 2019 & 2032
- Table 113: Italy Bio Vanillin Market Revenue (Million) Forecast, by Application 2019 & 2032
- Table 114: Italy Bio Vanillin Market Volume (K Units) Forecast, by Application 2019 & 2032
- Table 115: Rest of Europe Bio Vanillin Market Revenue (Million) Forecast, by Application 2019 & 2032
- Table 116: Rest of Europe Bio Vanillin Market Volume (K Units) Forecast, by Application 2019 & 2032
- Table 117: Global Bio Vanillin Market Revenue Million Forecast, by Application 2019 & 2032
- Table 118: Global Bio Vanillin Market Volume K Units Forecast, by Application 2019 & 2032
- Table 119: Global Bio Vanillin Market Revenue Million Forecast, by Country 2019 & 2032
- Table 120: Global Bio Vanillin Market Volume K Units Forecast, by Country 2019 & 2032
- Table 121: India Bio Vanillin Market Revenue (Million) Forecast, by Application 2019 & 2032
- Table 122: India Bio Vanillin Market Volume (K Units) Forecast, by Application 2019 & 2032
- Table 123: China Bio Vanillin Market Revenue (Million) Forecast, by Application 2019 & 2032
- Table 124: China Bio Vanillin Market Volume (K Units) Forecast, by Application 2019 & 2032
- Table 125: Japan Bio Vanillin Market Revenue (Million) Forecast, by Application 2019 & 2032
- Table 126: Japan Bio Vanillin Market Volume (K Units) Forecast, by Application 2019 & 2032
- Table 127: Australia Bio Vanillin Market Revenue (Million) Forecast, by Application 2019 & 2032
- Table 128: Australia Bio Vanillin Market Volume (K Units) Forecast, by Application 2019 & 2032
- Table 129: Rest of Asia Pacific Bio Vanillin Market Revenue (Million) Forecast, by Application 2019 & 2032
- Table 130: Rest of Asia Pacific Bio Vanillin Market Volume (K Units) Forecast, by Application 2019 & 2032
- Table 131: Global Bio Vanillin Market Revenue Million Forecast, by Application 2019 & 2032
- Table 132: Global Bio Vanillin Market Volume K Units Forecast, by Application 2019 & 2032
- Table 133: Global Bio Vanillin Market Revenue Million Forecast, by Country 2019 & 2032
- Table 134: Global Bio Vanillin Market Volume K Units Forecast, by Country 2019 & 2032
- Table 135: South America Bio Vanillin Market Revenue (Million) Forecast, by Application 2019 & 2032
- Table 136: South America Bio Vanillin Market Volume (K Units) Forecast, by Application 2019 & 2032
- Table 137: Middle East Bio Vanillin Market Revenue (Million) Forecast, by Application 2019 & 2032
- Table 138: Middle East Bio Vanillin Market Volume (K Units) Forecast, by Application 2019 & 2032
Frequently Asked Questions
1. What is the projected Compound Annual Growth Rate (CAGR) of the Bio Vanillin Market?
The projected CAGR is approximately 7.30%.
2. Which companies are prominent players in the Bio Vanillin Market?
Key companies in the market include Firmenich SA, Givaudan, Evolva Holding SA, Archer Daniels Midland Company, Lesaffre, Advanced Biotech, AUROCHEMICAL, Apple Flavor & Fragrance Group Co Ltd.
3. What are the main segments of the Bio Vanillin Market?
The market segments include Application.
4. Can you provide details about the market size?
The market size is estimated to be USD 277.69 Million as of 2022.
5. What are some drivers contributing to market growth?
Surge in Demand for 'Free-from' Food Products; Demand For Convenient And Healthy On-the-go Snacking Options.
6. What are the notable trends driving market growth?
Growing Demand for Bio Vanillin in the Food and Beverage Industry.
7. Are there any restraints impacting market growth?
Health Risk Associated with Certain Ingredients.
8. Can you provide examples of recent developments in the market?
N/A
9. What pricing options are available for accessing the report?
Pricing options include single-user, multi-user, and enterprise licenses priced at USD 4750, USD 5250, and USD 8750 respectively.
10. Is the market size provided in terms of value or volume?
The market size is provided in terms of value, measured in Million and volume, measured in K Units.
11. Are there any specific market keywords associated with the report?
Yes, the market keyword associated with the report is "Bio Vanillin Market," which aids in identifying and referencing the specific market segment covered.
12. How do I determine which pricing option suits my needs best?
The pricing options vary based on user requirements and access needs. Individual users may opt for single-user licenses, while businesses requiring broader access may choose multi-user or enterprise licenses for cost-effective access to the report.
13. Are there any additional resources or data provided in the Bio Vanillin Market report?
While the report offers comprehensive insights, it's advisable to review the specific contents or supplementary materials provided to ascertain if additional resources or data are available.
14. How can I stay updated on further developments or reports in the Bio Vanillin Market?
To stay informed about further developments, trends, and reports in the Bio Vanillin Market, consider subscribing to industry newsletters, following relevant companies and organizations, or regularly checking reputable industry news sources and publications.
Methodology
Step 1 - Identification of Relevant Samples Size from Population Database


Step 2 - Approaches for Defining Global Market Size (Value, Volume* & Price*)

Note*: In applicable scenarios
Step 3 - Data Sources
Primary Research
- Web Analytics
- Survey Reports
- Research Institute
- Latest Research Reports
- Opinion Leaders
Secondary Research
- Annual Reports
- White Paper
- Latest Press Release
- Industry Association
- Paid Database
- Investor Presentations

Step 4 - Data Triangulation
Involves using different sources of information in order to increase the validity of a study
These sources are likely to be stakeholders in a program - participants, other researchers, program staff, other community members, and so on.
Then we put all data in single framework & apply various statistical tools to find out the dynamic on the market.
During the analysis stage, feedback from the stakeholder groups would be compared to determine areas of agreement as well as areas of divergence


