
Key Insights
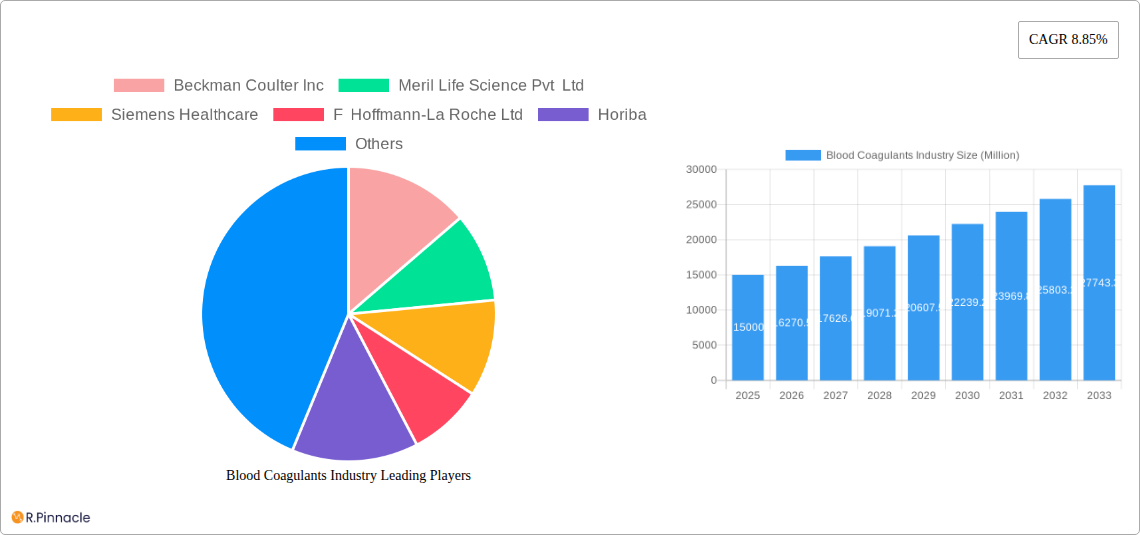
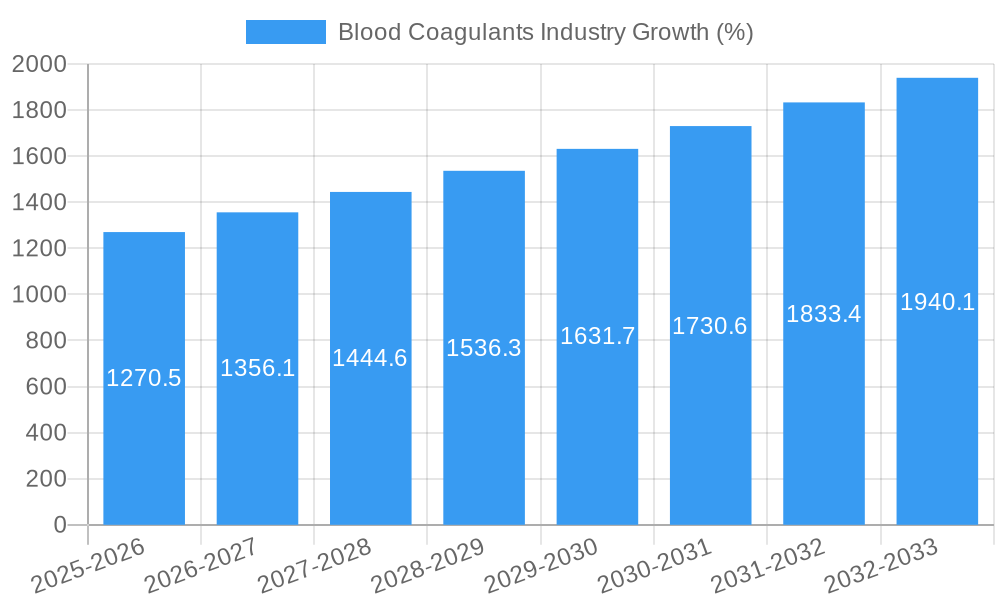
The global blood coagulants market, currently experiencing robust growth, is projected to maintain a significant expansion trajectory throughout the forecast period (2025-2033). A Compound Annual Growth Rate (CAGR) of 8.85% indicates a substantial market expansion, driven primarily by the rising prevalence of cardiovascular diseases, increasing geriatric population (requiring more frequent coagulation tests), and advancements in diagnostic technologies offering faster, more accurate results. The market is segmented by product type (analyzers, point-of-care analyzers, and consumables), test type (fibrinogen, D-dimer, platelet function, and other coagulation tests), technology (optical, mechanical, electrochemical, and others), and end-user (hospitals, diagnostic centers, and others). The increasing adoption of point-of-care testing, particularly in remote areas and smaller clinics, contributes significantly to market growth, as it allows for quicker diagnoses and immediate treatment decisions. Furthermore, technological advancements leading to more sensitive and reliable coagulation analyzers, coupled with the development of improved consumables, are key factors fueling market expansion. The demand for automated analyzers that minimize manual intervention and improve efficiency in high-volume testing environments also drives the growth.
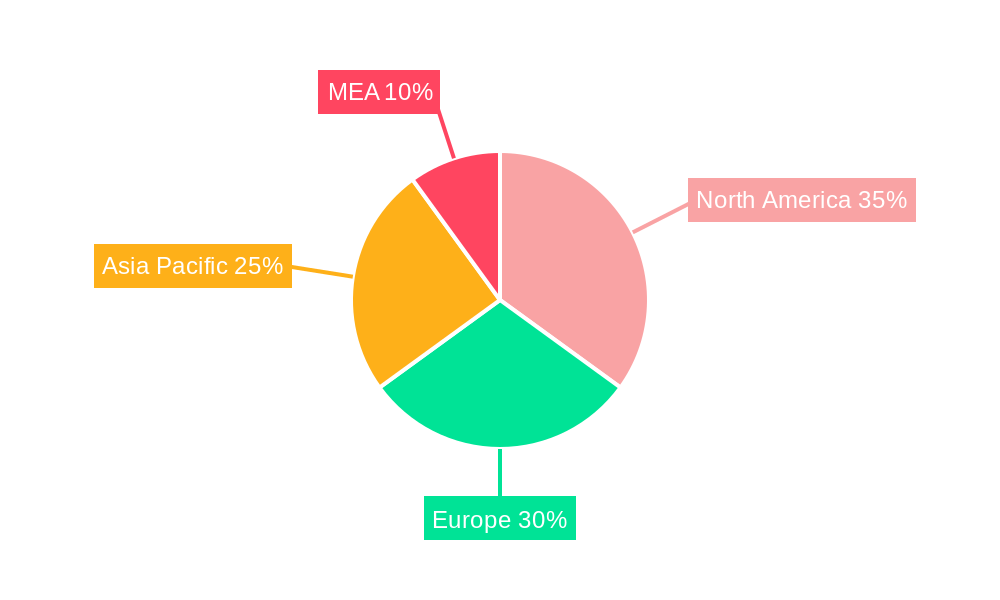
Geographic distribution of market share reflects the concentration of advanced healthcare infrastructure and the prevalence of target diseases. North America and Europe are likely to hold larger market shares due to established healthcare systems and high healthcare expenditure. However, rapidly developing economies in Asia-Pacific and the Middle East & Africa are expected to witness substantial growth, driven by rising disposable incomes, improved healthcare infrastructure, and increased awareness regarding cardiovascular health. While regulatory hurdles and high costs associated with advanced diagnostic technologies could pose challenges, the overall market outlook remains positive, driven by the aforementioned factors. The competitive landscape includes both established players like Beckman Coulter, Siemens Healthcare, and Roche, and emerging companies focusing on innovation and cost-effectiveness. This competitive environment further stimulates market growth and fosters technological advancement within the sector.
Blood Coagulants Industry Report: 2019-2033
This comprehensive report provides a detailed analysis of the global Blood Coagulants Industry, offering actionable insights for industry professionals, investors, and strategic decision-makers. Covering the period from 2019 to 2033, with a focus on 2025, this report unveils market dynamics, growth drivers, challenges, and future opportunities within this critical sector of healthcare. The report incorporates extensive data analysis, including market sizing, segmentation, and competitive landscape assessments, to provide a holistic understanding of the Blood Coagulants market. Key players such as Beckman Coulter Inc, Meril Life Science Pvt Ltd, Siemens Healthcare, F Hoffmann-La Roche Ltd, and others are analyzed in detail.
Blood Coagulants Industry Market Structure & Innovation Trends
This section analyzes the competitive landscape of the Blood Coagulants industry, encompassing market concentration, innovation drivers, regulatory frameworks, and M&A activities. The global blood coagulants market is moderately concentrated, with several large players holding significant market share. Market share data for 2025 estimates xx Million in revenue for the top 5 players, representing approximately xx% of the total market. Innovation is driven by advancements in technologies, such as optical, mechanical, and electrochemical technologies, leading to the development of more accurate, efficient, and user-friendly analyzers and consumables. Stringent regulatory frameworks, including those from the FDA and other global health agencies, impact product development and market access. The presence of substitute technologies and diagnostic methods necessitates continuous innovation to maintain market competitiveness. End-user demographics are shifting towards an increased preference for point-of-care testing and automated systems. The market has witnessed several mergers and acquisitions (M&A) in recent years, with deal values ranging from xx Million to xx Million. This activity reflects the strategic consolidation within the sector and the pursuit of technological advancements and market expansion.
- Market Concentration: Moderate, with top 5 players holding approximately xx% market share in 2025.
- Innovation Drivers: Technological advancements (optical, mechanical, electrochemical), improved accuracy and efficiency, point-of-care testing demands.
- Regulatory Frameworks: Stringent regulations impacting product development and market access.
- M&A Activity: Significant activity, with deal values ranging from xx Million to xx Million.
Blood Coagulants Industry Market Dynamics & Trends
The global blood coagulants market is experiencing significant growth, driven by several factors. The increasing prevalence of cardiovascular diseases, growing geriatric population, and rising demand for advanced diagnostic testing are key drivers. Technological advancements, including the development of automated analyzers and point-of-care testing devices, are further propelling market growth. The market is witnessing a shift towards more sophisticated and accurate coagulation tests, including fibrinogen, D-dimer, and platelet function tests. Consumer preferences are increasingly leaning towards faster results and improved ease-of-use for diagnostics. Competitive dynamics are characterized by both fierce competition among established players and the emergence of new entrants with innovative technologies. The market is expected to exhibit a CAGR of xx% during the forecast period (2025-2033), with market penetration expected to reach xx% by 2033.
Dominant Regions & Segments in Blood Coagulants Industry
The North American region currently holds the largest share of the global blood coagulants market, driven by robust healthcare infrastructure, high technological adoption, and significant research investments. However, the Asia-Pacific region is poised for rapid growth due to increasing healthcare spending, growing awareness of cardiovascular diseases, and expanding diagnostic capabilities.
- Dominant Region: North America
- High-Growth Region: Asia-Pacific
- Key Drivers: Robust healthcare infrastructure (North America), increasing healthcare spending (Asia-Pacific), growing awareness of cardiovascular diseases, advancements in diagnostic technologies.
Leading Segments:
- Product: Analyzers (largest segment), followed by Point-of-Care Analyzers and Consumables.
- Test Type: D-Dimer Testing and Fibrinogen Testing are the major segments, showcasing considerable growth opportunities. Other Coagulation Tests have also been contributing to market expansion.
- Technology: Optical and Electrochemical technologies dominate the market, signifying a preference for accurate and reliable results.
- End User: Hospitals represent the largest segment, followed by diagnostic centers.
Blood Coagulants Industry Product Innovations
Recent innovations in the blood coagulants industry focus on enhanced accuracy, speed, and automation. Miniaturized point-of-care devices allow for faster diagnostic results, particularly beneficial in critical care settings. Integration of advanced technologies, such as AI and machine learning, enhances data analysis and interpretation, leading to improved diagnostic accuracy. The market is witnessing a trend towards integrated systems that combine various coagulation tests on a single platform, improving efficiency and reducing costs.
Report Scope & Segmentation Analysis
This report provides a comprehensive segmentation of the blood coagulants market across various parameters:
- Product: Analyzers, Point-of-Care Analyzers, Consumables. Growth projections vary significantly across these segments, with Analyzers showing a steady but mature growth, while Point-of-Care analyzers exhibit higher growth projections. Consumables' growth is intrinsically linked to analyzer sales.
- Test Type: Fibrinogen Testing, D-Dimer Testing, Platelet Function Tests, Other Coagulation Tests. Each test type shows variations in growth rates, driven by disease prevalence and diagnostic trends.
- Technology: Optical Technology, Mechanical Technology, Electrochemical Technology, Others. This segmentation reflects the technological landscape and its impact on market dynamics.
- End User: Hospitals, Diagnostic Centers, Others. Hospitals account for a large market share, with diagnostic centers representing a rapidly growing segment.
Market sizes and competitive dynamics are analyzed for each segment, providing detailed growth projections for the forecast period.
Key Drivers of Blood Coagulants Industry Growth
The blood coagulants industry's growth is propelled by several factors:
- Technological Advancements: Automation, miniaturization, and integration of advanced technologies into analyzers and consumables.
- Increasing Prevalence of Cardiovascular Diseases: A major driver for demand in diagnostic testing.
- Growing Geriatric Population: This demographic faces a higher risk of coagulation disorders.
- Rising Healthcare Expenditure: Increased spending fuels the adoption of advanced diagnostic tools.
- Stringent Regulatory Frameworks: Drives innovation and ensures product safety and efficacy.
Challenges in the Blood Coagulants Industry Sector
The industry faces several challenges:
- High Costs of Advanced Technologies: This can limit accessibility in certain markets.
- Stringent Regulatory Approvals: Time-consuming and costly processes impacting time-to-market.
- Intense Competition: Leading to price pressure and margin compression.
- Supply Chain Disruptions: Potential for delays and shortages impacting product availability.
- Reimbursement Challenges: Insurance coverage limitations can hinder market access.
Emerging Opportunities in Blood Coagulants Industry
The industry presents several promising opportunities:
- Expansion into Emerging Markets: Untapped potential in developing economies with growing healthcare infrastructure.
- Development of Point-of-Care Diagnostics: Meeting the need for rapid testing in diverse settings.
- Integration of AI and Machine Learning: Improving diagnostic accuracy and efficiency.
- Personalized Medicine: Tailoring coagulation testing and treatment based on individual patient profiles.
- Development of Novel Diagnostic Methods: Improving accuracy and reducing reliance on traditional methods.
Leading Players in the Blood Coagulants Industry Market
- Beckman Coulter Inc
- Meril Life Science Pvt Ltd
- Siemens Healthcare
- F Hoffmann-La Roche Ltd
- Horiba
- Thermo Fisher Scientific Inc
- Trivitron Healthcare
- Eurolyser Diagnostica GmbH
- Abbott Laboratories
- Helena Laboratories
- Diagnostica Stago Sas
- Nihon Kohden Corporation
Key Developments in Blood Coagulants Industry Industry
- October 2021: Trivitron Healthcare launched a new line of Coagulation Analyzer products in India.
- February 2021: Siemens Healthineers and Sysmex Corporation renewed their global supply and distribution agreement for hemostasis products, including Sysmex's CN-Series automated blood coagulation analyzers.
Future Outlook for Blood Coagulants Industry Market
The future of the blood coagulants industry is bright, driven by continuous technological advancements, growing healthcare expenditure, and the increasing prevalence of cardiovascular diseases. Strategic partnerships, product diversification, and expansion into new markets will be crucial for success. The integration of artificial intelligence and machine learning is expected to further enhance diagnostic capabilities, creating new opportunities for innovation and growth. The industry is poised for robust expansion, with significant potential for market expansion and value creation in the coming years.
Blood Coagulants Industry Segmentation
-
1. Product
-
1.1. Analyzers
- 1.1.1. Clinical Laboratory Analyzers
- 1.1.2. Point of Care Analyzers
- 1.2. Consumables
-
1.1. Analyzers
-
2. Test Type
- 2.1. Fibrinogen Testing
- 2.2. D-Dimer Testing
- 2.3. Platelet Function Tests
- 2.4. Other Coagulation Tests
-
3. Technology
- 3.1. Optical Technology
- 3.2. Mechanical Technology
- 3.3. Electrochemical Technology
- 3.4. Others
-
4. End User
- 4.1. Hospitals
- 4.2. Diagnostic Centers
- 4.3. Others
Blood Coagulants Industry Segmentation By Geography
-
1. North America
- 1.1. United States
- 1.2. Canada
- 1.3. Mexico
-
2. Europe
- 2.1. Germany
- 2.2. United Kingdom
- 2.3. France
- 2.4. Italy
- 2.5. Spain
- 2.6. Rest of Europe
-
3. Asia Pacific
- 3.1. China
- 3.2. Japan
- 3.3. India
- 3.4. Australia
- 3.5. South Korea
- 3.6. Rest of Asia Pacific
-
4. Middle East and Africa
- 4.1. GCC
- 4.2. South Africa
- 4.3. Rest of Middle East and Africa
-
5. South America
- 5.1. Brazil
- 5.2. Argentina
- 5.3. Rest of South America
Blood Coagulants Industry REPORT HIGHLIGHTS
| Aspects | Details |
|---|---|
| Study Period | 2019-2033 |
| Base Year | 2024 |
| Estimated Year | 2025 |
| Forecast Period | 2025-2033 |
| Historical Period | 2019-2024 |
| Growth Rate | CAGR of 8.85% from 2019-2033 |
| Segmentation |
|
Table of Contents
- 1. Introduction
- 1.1. Research Scope
- 1.2. Market Segmentation
- 1.3. Research Methodology
- 1.4. Definitions and Assumptions
- 2. Executive Summary
- 2.1. Introduction
- 3. Market Dynamics
- 3.1. Introduction
- 3.2. Market Drivers
- 3.2.1. Increasing Prevalence of Chronic Blood Disorders; Rising Geriatric Population Coupled with Increasing Prevalence of Chronic Diseases; Increasing Laboratory Automation
- 3.3. Market Restrains
- 3.3.1. Slow Adoption Rate in Underdeveloped Economies; High Cost of Test for Fully Automated Analyzers
- 3.4. Market Trends
- 3.4.1. D-Dimer Testing Segment is Expected to Dominate the Market During the Forecast Period
- 4. Market Factor Analysis
- 4.1. Porters Five Forces
- 4.2. Supply/Value Chain
- 4.3. PESTEL analysis
- 4.4. Market Entropy
- 4.5. Patent/Trademark Analysis
- 5. Global Blood Coagulants Industry Analysis, Insights and Forecast, 2019-2031
- 5.1. Market Analysis, Insights and Forecast - by Product
- 5.1.1. Analyzers
- 5.1.1.1. Clinical Laboratory Analyzers
- 5.1.1.2. Point of Care Analyzers
- 5.1.2. Consumables
- 5.1.1. Analyzers
- 5.2. Market Analysis, Insights and Forecast - by Test Type
- 5.2.1. Fibrinogen Testing
- 5.2.2. D-Dimer Testing
- 5.2.3. Platelet Function Tests
- 5.2.4. Other Coagulation Tests
- 5.3. Market Analysis, Insights and Forecast - by Technology
- 5.3.1. Optical Technology
- 5.3.2. Mechanical Technology
- 5.3.3. Electrochemical Technology
- 5.3.4. Others
- 5.4. Market Analysis, Insights and Forecast - by End User
- 5.4.1. Hospitals
- 5.4.2. Diagnostic Centers
- 5.4.3. Others
- 5.5. Market Analysis, Insights and Forecast - by Region
- 5.5.1. North America
- 5.5.2. Europe
- 5.5.3. Asia Pacific
- 5.5.4. Middle East and Africa
- 5.5.5. South America
- 5.1. Market Analysis, Insights and Forecast - by Product
- 6. North America Blood Coagulants Industry Analysis, Insights and Forecast, 2019-2031
- 6.1. Market Analysis, Insights and Forecast - by Product
- 6.1.1. Analyzers
- 6.1.1.1. Clinical Laboratory Analyzers
- 6.1.1.2. Point of Care Analyzers
- 6.1.2. Consumables
- 6.1.1. Analyzers
- 6.2. Market Analysis, Insights and Forecast - by Test Type
- 6.2.1. Fibrinogen Testing
- 6.2.2. D-Dimer Testing
- 6.2.3. Platelet Function Tests
- 6.2.4. Other Coagulation Tests
- 6.3. Market Analysis, Insights and Forecast - by Technology
- 6.3.1. Optical Technology
- 6.3.2. Mechanical Technology
- 6.3.3. Electrochemical Technology
- 6.3.4. Others
- 6.4. Market Analysis, Insights and Forecast - by End User
- 6.4.1. Hospitals
- 6.4.2. Diagnostic Centers
- 6.4.3. Others
- 6.1. Market Analysis, Insights and Forecast - by Product
- 7. Europe Blood Coagulants Industry Analysis, Insights and Forecast, 2019-2031
- 7.1. Market Analysis, Insights and Forecast - by Product
- 7.1.1. Analyzers
- 7.1.1.1. Clinical Laboratory Analyzers
- 7.1.1.2. Point of Care Analyzers
- 7.1.2. Consumables
- 7.1.1. Analyzers
- 7.2. Market Analysis, Insights and Forecast - by Test Type
- 7.2.1. Fibrinogen Testing
- 7.2.2. D-Dimer Testing
- 7.2.3. Platelet Function Tests
- 7.2.4. Other Coagulation Tests
- 7.3. Market Analysis, Insights and Forecast - by Technology
- 7.3.1. Optical Technology
- 7.3.2. Mechanical Technology
- 7.3.3. Electrochemical Technology
- 7.3.4. Others
- 7.4. Market Analysis, Insights and Forecast - by End User
- 7.4.1. Hospitals
- 7.4.2. Diagnostic Centers
- 7.4.3. Others
- 7.1. Market Analysis, Insights and Forecast - by Product
- 8. Asia Pacific Blood Coagulants Industry Analysis, Insights and Forecast, 2019-2031
- 8.1. Market Analysis, Insights and Forecast - by Product
- 8.1.1. Analyzers
- 8.1.1.1. Clinical Laboratory Analyzers
- 8.1.1.2. Point of Care Analyzers
- 8.1.2. Consumables
- 8.1.1. Analyzers
- 8.2. Market Analysis, Insights and Forecast - by Test Type
- 8.2.1. Fibrinogen Testing
- 8.2.2. D-Dimer Testing
- 8.2.3. Platelet Function Tests
- 8.2.4. Other Coagulation Tests
- 8.3. Market Analysis, Insights and Forecast - by Technology
- 8.3.1. Optical Technology
- 8.3.2. Mechanical Technology
- 8.3.3. Electrochemical Technology
- 8.3.4. Others
- 8.4. Market Analysis, Insights and Forecast - by End User
- 8.4.1. Hospitals
- 8.4.2. Diagnostic Centers
- 8.4.3. Others
- 8.1. Market Analysis, Insights and Forecast - by Product
- 9. Middle East and Africa Blood Coagulants Industry Analysis, Insights and Forecast, 2019-2031
- 9.1. Market Analysis, Insights and Forecast - by Product
- 9.1.1. Analyzers
- 9.1.1.1. Clinical Laboratory Analyzers
- 9.1.1.2. Point of Care Analyzers
- 9.1.2. Consumables
- 9.1.1. Analyzers
- 9.2. Market Analysis, Insights and Forecast - by Test Type
- 9.2.1. Fibrinogen Testing
- 9.2.2. D-Dimer Testing
- 9.2.3. Platelet Function Tests
- 9.2.4. Other Coagulation Tests
- 9.3. Market Analysis, Insights and Forecast - by Technology
- 9.3.1. Optical Technology
- 9.3.2. Mechanical Technology
- 9.3.3. Electrochemical Technology
- 9.3.4. Others
- 9.4. Market Analysis, Insights and Forecast - by End User
- 9.4.1. Hospitals
- 9.4.2. Diagnostic Centers
- 9.4.3. Others
- 9.1. Market Analysis, Insights and Forecast - by Product
- 10. South America Blood Coagulants Industry Analysis, Insights and Forecast, 2019-2031
- 10.1. Market Analysis, Insights and Forecast - by Product
- 10.1.1. Analyzers
- 10.1.1.1. Clinical Laboratory Analyzers
- 10.1.1.2. Point of Care Analyzers
- 10.1.2. Consumables
- 10.1.1. Analyzers
- 10.2. Market Analysis, Insights and Forecast - by Test Type
- 10.2.1. Fibrinogen Testing
- 10.2.2. D-Dimer Testing
- 10.2.3. Platelet Function Tests
- 10.2.4. Other Coagulation Tests
- 10.3. Market Analysis, Insights and Forecast - by Technology
- 10.3.1. Optical Technology
- 10.3.2. Mechanical Technology
- 10.3.3. Electrochemical Technology
- 10.3.4. Others
- 10.4. Market Analysis, Insights and Forecast - by End User
- 10.4.1. Hospitals
- 10.4.2. Diagnostic Centers
- 10.4.3. Others
- 10.1. Market Analysis, Insights and Forecast - by Product
- 11. North Americ Blood Coagulants Industry Analysis, Insights and Forecast, 2019-2031
- 11.1. Market Analysis, Insights and Forecast - By Country/Sub-region
- 11.1.1 United States
- 11.1.2 Canada
- 11.1.3 Mexico
- 12. South America Blood Coagulants Industry Analysis, Insights and Forecast, 2019-2031
- 12.1. Market Analysis, Insights and Forecast - By Country/Sub-region
- 12.1.1 Brazil
- 12.1.2 Mexico
- 12.1.3 Rest of South America
- 13. Europe Blood Coagulants Industry Analysis, Insights and Forecast, 2019-2031
- 13.1. Market Analysis, Insights and Forecast - By Country/Sub-region
- 13.1.1 Germany
- 13.1.2 United Kingdom
- 13.1.3 France
- 13.1.4 Italy
- 13.1.5 Spain
- 13.1.6 Rest of Europe
- 14. Asia Pacific Blood Coagulants Industry Analysis, Insights and Forecast, 2019-2031
- 14.1. Market Analysis, Insights and Forecast - By Country/Sub-region
- 14.1.1 China
- 14.1.2 Japan
- 14.1.3 India
- 14.1.4 South Korea
- 14.1.5 Taiwan
- 14.1.6 Australia
- 14.1.7 Rest of Asia-Pacific
- 15. MEA Blood Coagulants Industry Analysis, Insights and Forecast, 2019-2031
- 15.1. Market Analysis, Insights and Forecast - By Country/Sub-region
- 15.1.1 Middle East
- 15.1.2 Africa
- 16. Competitive Analysis
- 16.1. Global Market Share Analysis 2024
- 16.2. Company Profiles
- 16.2.1 Beckman Coulter Inc
- 16.2.1.1. Overview
- 16.2.1.2. Products
- 16.2.1.3. SWOT Analysis
- 16.2.1.4. Recent Developments
- 16.2.1.5. Financials (Based on Availability)
- 16.2.2 Meril Life Science Pvt Ltd
- 16.2.2.1. Overview
- 16.2.2.2. Products
- 16.2.2.3. SWOT Analysis
- 16.2.2.4. Recent Developments
- 16.2.2.5. Financials (Based on Availability)
- 16.2.3 Siemens Healthcare
- 16.2.3.1. Overview
- 16.2.3.2. Products
- 16.2.3.3. SWOT Analysis
- 16.2.3.4. Recent Developments
- 16.2.3.5. Financials (Based on Availability)
- 16.2.4 F Hoffmann-La Roche Ltd
- 16.2.4.1. Overview
- 16.2.4.2. Products
- 16.2.4.3. SWOT Analysis
- 16.2.4.4. Recent Developments
- 16.2.4.5. Financials (Based on Availability)
- 16.2.5 Horiba
- 16.2.5.1. Overview
- 16.2.5.2. Products
- 16.2.5.3. SWOT Analysis
- 16.2.5.4. Recent Developments
- 16.2.5.5. Financials (Based on Availability)
- 16.2.6 Thermo Fisher Scientific Inc
- 16.2.6.1. Overview
- 16.2.6.2. Products
- 16.2.6.3. SWOT Analysis
- 16.2.6.4. Recent Developments
- 16.2.6.5. Financials (Based on Availability)
- 16.2.7 Trivitron Healthcare
- 16.2.7.1. Overview
- 16.2.7.2. Products
- 16.2.7.3. SWOT Analysis
- 16.2.7.4. Recent Developments
- 16.2.7.5. Financials (Based on Availability)
- 16.2.8 Eurolyser Diagnostica GmbH
- 16.2.8.1. Overview
- 16.2.8.2. Products
- 16.2.8.3. SWOT Analysis
- 16.2.8.4. Recent Developments
- 16.2.8.5. Financials (Based on Availability)
- 16.2.9 Abbott Laboratories
- 16.2.9.1. Overview
- 16.2.9.2. Products
- 16.2.9.3. SWOT Analysis
- 16.2.9.4. Recent Developments
- 16.2.9.5. Financials (Based on Availability)
- 16.2.10 Helena Laboratories
- 16.2.10.1. Overview
- 16.2.10.2. Products
- 16.2.10.3. SWOT Analysis
- 16.2.10.4. Recent Developments
- 16.2.10.5. Financials (Based on Availability)
- 16.2.11 Diagnostica Stago Sas
- 16.2.11.1. Overview
- 16.2.11.2. Products
- 16.2.11.3. SWOT Analysis
- 16.2.11.4. Recent Developments
- 16.2.11.5. Financials (Based on Availability)
- 16.2.12 Nihon Kohden Corporation
- 16.2.12.1. Overview
- 16.2.12.2. Products
- 16.2.12.3. SWOT Analysis
- 16.2.12.4. Recent Developments
- 16.2.12.5. Financials (Based on Availability)
- 16.2.1 Beckman Coulter Inc
List of Figures
- Figure 1: Global Blood Coagulants Industry Revenue Breakdown (Million, %) by Region 2024 & 2032
- Figure 2: Global Blood Coagulants Industry Volume Breakdown (K Unit, %) by Region 2024 & 2032
- Figure 3: North Americ Blood Coagulants Industry Revenue (Million), by Country 2024 & 2032
- Figure 4: North Americ Blood Coagulants Industry Volume (K Unit), by Country 2024 & 2032
- Figure 5: North Americ Blood Coagulants Industry Revenue Share (%), by Country 2024 & 2032
- Figure 6: North Americ Blood Coagulants Industry Volume Share (%), by Country 2024 & 2032
- Figure 7: South America Blood Coagulants Industry Revenue (Million), by Country 2024 & 2032
- Figure 8: South America Blood Coagulants Industry Volume (K Unit), by Country 2024 & 2032
- Figure 9: South America Blood Coagulants Industry Revenue Share (%), by Country 2024 & 2032
- Figure 10: South America Blood Coagulants Industry Volume Share (%), by Country 2024 & 2032
- Figure 11: Europe Blood Coagulants Industry Revenue (Million), by Country 2024 & 2032
- Figure 12: Europe Blood Coagulants Industry Volume (K Unit), by Country 2024 & 2032
- Figure 13: Europe Blood Coagulants Industry Revenue Share (%), by Country 2024 & 2032
- Figure 14: Europe Blood Coagulants Industry Volume Share (%), by Country 2024 & 2032
- Figure 15: Asia Pacific Blood Coagulants Industry Revenue (Million), by Country 2024 & 2032
- Figure 16: Asia Pacific Blood Coagulants Industry Volume (K Unit), by Country 2024 & 2032
- Figure 17: Asia Pacific Blood Coagulants Industry Revenue Share (%), by Country 2024 & 2032
- Figure 18: Asia Pacific Blood Coagulants Industry Volume Share (%), by Country 2024 & 2032
- Figure 19: MEA Blood Coagulants Industry Revenue (Million), by Country 2024 & 2032
- Figure 20: MEA Blood Coagulants Industry Volume (K Unit), by Country 2024 & 2032
- Figure 21: MEA Blood Coagulants Industry Revenue Share (%), by Country 2024 & 2032
- Figure 22: MEA Blood Coagulants Industry Volume Share (%), by Country 2024 & 2032
- Figure 23: North America Blood Coagulants Industry Revenue (Million), by Product 2024 & 2032
- Figure 24: North America Blood Coagulants Industry Volume (K Unit), by Product 2024 & 2032
- Figure 25: North America Blood Coagulants Industry Revenue Share (%), by Product 2024 & 2032
- Figure 26: North America Blood Coagulants Industry Volume Share (%), by Product 2024 & 2032
- Figure 27: North America Blood Coagulants Industry Revenue (Million), by Test Type 2024 & 2032
- Figure 28: North America Blood Coagulants Industry Volume (K Unit), by Test Type 2024 & 2032
- Figure 29: North America Blood Coagulants Industry Revenue Share (%), by Test Type 2024 & 2032
- Figure 30: North America Blood Coagulants Industry Volume Share (%), by Test Type 2024 & 2032
- Figure 31: North America Blood Coagulants Industry Revenue (Million), by Technology 2024 & 2032
- Figure 32: North America Blood Coagulants Industry Volume (K Unit), by Technology 2024 & 2032
- Figure 33: North America Blood Coagulants Industry Revenue Share (%), by Technology 2024 & 2032
- Figure 34: North America Blood Coagulants Industry Volume Share (%), by Technology 2024 & 2032
- Figure 35: North America Blood Coagulants Industry Revenue (Million), by End User 2024 & 2032
- Figure 36: North America Blood Coagulants Industry Volume (K Unit), by End User 2024 & 2032
- Figure 37: North America Blood Coagulants Industry Revenue Share (%), by End User 2024 & 2032
- Figure 38: North America Blood Coagulants Industry Volume Share (%), by End User 2024 & 2032
- Figure 39: North America Blood Coagulants Industry Revenue (Million), by Country 2024 & 2032
- Figure 40: North America Blood Coagulants Industry Volume (K Unit), by Country 2024 & 2032
- Figure 41: North America Blood Coagulants Industry Revenue Share (%), by Country 2024 & 2032
- Figure 42: North America Blood Coagulants Industry Volume Share (%), by Country 2024 & 2032
- Figure 43: Europe Blood Coagulants Industry Revenue (Million), by Product 2024 & 2032
- Figure 44: Europe Blood Coagulants Industry Volume (K Unit), by Product 2024 & 2032
- Figure 45: Europe Blood Coagulants Industry Revenue Share (%), by Product 2024 & 2032
- Figure 46: Europe Blood Coagulants Industry Volume Share (%), by Product 2024 & 2032
- Figure 47: Europe Blood Coagulants Industry Revenue (Million), by Test Type 2024 & 2032
- Figure 48: Europe Blood Coagulants Industry Volume (K Unit), by Test Type 2024 & 2032
- Figure 49: Europe Blood Coagulants Industry Revenue Share (%), by Test Type 2024 & 2032
- Figure 50: Europe Blood Coagulants Industry Volume Share (%), by Test Type 2024 & 2032
- Figure 51: Europe Blood Coagulants Industry Revenue (Million), by Technology 2024 & 2032
- Figure 52: Europe Blood Coagulants Industry Volume (K Unit), by Technology 2024 & 2032
- Figure 53: Europe Blood Coagulants Industry Revenue Share (%), by Technology 2024 & 2032
- Figure 54: Europe Blood Coagulants Industry Volume Share (%), by Technology 2024 & 2032
- Figure 55: Europe Blood Coagulants Industry Revenue (Million), by End User 2024 & 2032
- Figure 56: Europe Blood Coagulants Industry Volume (K Unit), by End User 2024 & 2032
- Figure 57: Europe Blood Coagulants Industry Revenue Share (%), by End User 2024 & 2032
- Figure 58: Europe Blood Coagulants Industry Volume Share (%), by End User 2024 & 2032
- Figure 59: Europe Blood Coagulants Industry Revenue (Million), by Country 2024 & 2032
- Figure 60: Europe Blood Coagulants Industry Volume (K Unit), by Country 2024 & 2032
- Figure 61: Europe Blood Coagulants Industry Revenue Share (%), by Country 2024 & 2032
- Figure 62: Europe Blood Coagulants Industry Volume Share (%), by Country 2024 & 2032
- Figure 63: Asia Pacific Blood Coagulants Industry Revenue (Million), by Product 2024 & 2032
- Figure 64: Asia Pacific Blood Coagulants Industry Volume (K Unit), by Product 2024 & 2032
- Figure 65: Asia Pacific Blood Coagulants Industry Revenue Share (%), by Product 2024 & 2032
- Figure 66: Asia Pacific Blood Coagulants Industry Volume Share (%), by Product 2024 & 2032
- Figure 67: Asia Pacific Blood Coagulants Industry Revenue (Million), by Test Type 2024 & 2032
- Figure 68: Asia Pacific Blood Coagulants Industry Volume (K Unit), by Test Type 2024 & 2032
- Figure 69: Asia Pacific Blood Coagulants Industry Revenue Share (%), by Test Type 2024 & 2032
- Figure 70: Asia Pacific Blood Coagulants Industry Volume Share (%), by Test Type 2024 & 2032
- Figure 71: Asia Pacific Blood Coagulants Industry Revenue (Million), by Technology 2024 & 2032
- Figure 72: Asia Pacific Blood Coagulants Industry Volume (K Unit), by Technology 2024 & 2032
- Figure 73: Asia Pacific Blood Coagulants Industry Revenue Share (%), by Technology 2024 & 2032
- Figure 74: Asia Pacific Blood Coagulants Industry Volume Share (%), by Technology 2024 & 2032
- Figure 75: Asia Pacific Blood Coagulants Industry Revenue (Million), by End User 2024 & 2032
- Figure 76: Asia Pacific Blood Coagulants Industry Volume (K Unit), by End User 2024 & 2032
- Figure 77: Asia Pacific Blood Coagulants Industry Revenue Share (%), by End User 2024 & 2032
- Figure 78: Asia Pacific Blood Coagulants Industry Volume Share (%), by End User 2024 & 2032
- Figure 79: Asia Pacific Blood Coagulants Industry Revenue (Million), by Country 2024 & 2032
- Figure 80: Asia Pacific Blood Coagulants Industry Volume (K Unit), by Country 2024 & 2032
- Figure 81: Asia Pacific Blood Coagulants Industry Revenue Share (%), by Country 2024 & 2032
- Figure 82: Asia Pacific Blood Coagulants Industry Volume Share (%), by Country 2024 & 2032
- Figure 83: Middle East and Africa Blood Coagulants Industry Revenue (Million), by Product 2024 & 2032
- Figure 84: Middle East and Africa Blood Coagulants Industry Volume (K Unit), by Product 2024 & 2032
- Figure 85: Middle East and Africa Blood Coagulants Industry Revenue Share (%), by Product 2024 & 2032
- Figure 86: Middle East and Africa Blood Coagulants Industry Volume Share (%), by Product 2024 & 2032
- Figure 87: Middle East and Africa Blood Coagulants Industry Revenue (Million), by Test Type 2024 & 2032
- Figure 88: Middle East and Africa Blood Coagulants Industry Volume (K Unit), by Test Type 2024 & 2032
- Figure 89: Middle East and Africa Blood Coagulants Industry Revenue Share (%), by Test Type 2024 & 2032
- Figure 90: Middle East and Africa Blood Coagulants Industry Volume Share (%), by Test Type 2024 & 2032
- Figure 91: Middle East and Africa Blood Coagulants Industry Revenue (Million), by Technology 2024 & 2032
- Figure 92: Middle East and Africa Blood Coagulants Industry Volume (K Unit), by Technology 2024 & 2032
- Figure 93: Middle East and Africa Blood Coagulants Industry Revenue Share (%), by Technology 2024 & 2032
- Figure 94: Middle East and Africa Blood Coagulants Industry Volume Share (%), by Technology 2024 & 2032
- Figure 95: Middle East and Africa Blood Coagulants Industry Revenue (Million), by End User 2024 & 2032
- Figure 96: Middle East and Africa Blood Coagulants Industry Volume (K Unit), by End User 2024 & 2032
- Figure 97: Middle East and Africa Blood Coagulants Industry Revenue Share (%), by End User 2024 & 2032
- Figure 98: Middle East and Africa Blood Coagulants Industry Volume Share (%), by End User 2024 & 2032
- Figure 99: Middle East and Africa Blood Coagulants Industry Revenue (Million), by Country 2024 & 2032
- Figure 100: Middle East and Africa Blood Coagulants Industry Volume (K Unit), by Country 2024 & 2032
- Figure 101: Middle East and Africa Blood Coagulants Industry Revenue Share (%), by Country 2024 & 2032
- Figure 102: Middle East and Africa Blood Coagulants Industry Volume Share (%), by Country 2024 & 2032
- Figure 103: South America Blood Coagulants Industry Revenue (Million), by Product 2024 & 2032
- Figure 104: South America Blood Coagulants Industry Volume (K Unit), by Product 2024 & 2032
- Figure 105: South America Blood Coagulants Industry Revenue Share (%), by Product 2024 & 2032
- Figure 106: South America Blood Coagulants Industry Volume Share (%), by Product 2024 & 2032
- Figure 107: South America Blood Coagulants Industry Revenue (Million), by Test Type 2024 & 2032
- Figure 108: South America Blood Coagulants Industry Volume (K Unit), by Test Type 2024 & 2032
- Figure 109: South America Blood Coagulants Industry Revenue Share (%), by Test Type 2024 & 2032
- Figure 110: South America Blood Coagulants Industry Volume Share (%), by Test Type 2024 & 2032
- Figure 111: South America Blood Coagulants Industry Revenue (Million), by Technology 2024 & 2032
- Figure 112: South America Blood Coagulants Industry Volume (K Unit), by Technology 2024 & 2032
- Figure 113: South America Blood Coagulants Industry Revenue Share (%), by Technology 2024 & 2032
- Figure 114: South America Blood Coagulants Industry Volume Share (%), by Technology 2024 & 2032
- Figure 115: South America Blood Coagulants Industry Revenue (Million), by End User 2024 & 2032
- Figure 116: South America Blood Coagulants Industry Volume (K Unit), by End User 2024 & 2032
- Figure 117: South America Blood Coagulants Industry Revenue Share (%), by End User 2024 & 2032
- Figure 118: South America Blood Coagulants Industry Volume Share (%), by End User 2024 & 2032
- Figure 119: South America Blood Coagulants Industry Revenue (Million), by Country 2024 & 2032
- Figure 120: South America Blood Coagulants Industry Volume (K Unit), by Country 2024 & 2032
- Figure 121: South America Blood Coagulants Industry Revenue Share (%), by Country 2024 & 2032
- Figure 122: South America Blood Coagulants Industry Volume Share (%), by Country 2024 & 2032
List of Tables
- Table 1: Global Blood Coagulants Industry Revenue Million Forecast, by Region 2019 & 2032
- Table 2: Global Blood Coagulants Industry Volume K Unit Forecast, by Region 2019 & 2032
- Table 3: Global Blood Coagulants Industry Revenue Million Forecast, by Product 2019 & 2032
- Table 4: Global Blood Coagulants Industry Volume K Unit Forecast, by Product 2019 & 2032
- Table 5: Global Blood Coagulants Industry Revenue Million Forecast, by Test Type 2019 & 2032
- Table 6: Global Blood Coagulants Industry Volume K Unit Forecast, by Test Type 2019 & 2032
- Table 7: Global Blood Coagulants Industry Revenue Million Forecast, by Technology 2019 & 2032
- Table 8: Global Blood Coagulants Industry Volume K Unit Forecast, by Technology 2019 & 2032
- Table 9: Global Blood Coagulants Industry Revenue Million Forecast, by End User 2019 & 2032
- Table 10: Global Blood Coagulants Industry Volume K Unit Forecast, by End User 2019 & 2032
- Table 11: Global Blood Coagulants Industry Revenue Million Forecast, by Region 2019 & 2032
- Table 12: Global Blood Coagulants Industry Volume K Unit Forecast, by Region 2019 & 2032
- Table 13: Global Blood Coagulants Industry Revenue Million Forecast, by Country 2019 & 2032
- Table 14: Global Blood Coagulants Industry Volume K Unit Forecast, by Country 2019 & 2032
- Table 15: United States Blood Coagulants Industry Revenue (Million) Forecast, by Application 2019 & 2032
- Table 16: United States Blood Coagulants Industry Volume (K Unit) Forecast, by Application 2019 & 2032
- Table 17: Canada Blood Coagulants Industry Revenue (Million) Forecast, by Application 2019 & 2032
- Table 18: Canada Blood Coagulants Industry Volume (K Unit) Forecast, by Application 2019 & 2032
- Table 19: Mexico Blood Coagulants Industry Revenue (Million) Forecast, by Application 2019 & 2032
- Table 20: Mexico Blood Coagulants Industry Volume (K Unit) Forecast, by Application 2019 & 2032
- Table 21: Global Blood Coagulants Industry Revenue Million Forecast, by Country 2019 & 2032
- Table 22: Global Blood Coagulants Industry Volume K Unit Forecast, by Country 2019 & 2032
- Table 23: Brazil Blood Coagulants Industry Revenue (Million) Forecast, by Application 2019 & 2032
- Table 24: Brazil Blood Coagulants Industry Volume (K Unit) Forecast, by Application 2019 & 2032
- Table 25: Mexico Blood Coagulants Industry Revenue (Million) Forecast, by Application 2019 & 2032
- Table 26: Mexico Blood Coagulants Industry Volume (K Unit) Forecast, by Application 2019 & 2032
- Table 27: Rest of South America Blood Coagulants Industry Revenue (Million) Forecast, by Application 2019 & 2032
- Table 28: Rest of South America Blood Coagulants Industry Volume (K Unit) Forecast, by Application 2019 & 2032
- Table 29: Global Blood Coagulants Industry Revenue Million Forecast, by Country 2019 & 2032
- Table 30: Global Blood Coagulants Industry Volume K Unit Forecast, by Country 2019 & 2032
- Table 31: Germany Blood Coagulants Industry Revenue (Million) Forecast, by Application 2019 & 2032
- Table 32: Germany Blood Coagulants Industry Volume (K Unit) Forecast, by Application 2019 & 2032
- Table 33: United Kingdom Blood Coagulants Industry Revenue (Million) Forecast, by Application 2019 & 2032
- Table 34: United Kingdom Blood Coagulants Industry Volume (K Unit) Forecast, by Application 2019 & 2032
- Table 35: France Blood Coagulants Industry Revenue (Million) Forecast, by Application 2019 & 2032
- Table 36: France Blood Coagulants Industry Volume (K Unit) Forecast, by Application 2019 & 2032
- Table 37: Italy Blood Coagulants Industry Revenue (Million) Forecast, by Application 2019 & 2032
- Table 38: Italy Blood Coagulants Industry Volume (K Unit) Forecast, by Application 2019 & 2032
- Table 39: Spain Blood Coagulants Industry Revenue (Million) Forecast, by Application 2019 & 2032
- Table 40: Spain Blood Coagulants Industry Volume (K Unit) Forecast, by Application 2019 & 2032
- Table 41: Rest of Europe Blood Coagulants Industry Revenue (Million) Forecast, by Application 2019 & 2032
- Table 42: Rest of Europe Blood Coagulants Industry Volume (K Unit) Forecast, by Application 2019 & 2032
- Table 43: Global Blood Coagulants Industry Revenue Million Forecast, by Country 2019 & 2032
- Table 44: Global Blood Coagulants Industry Volume K Unit Forecast, by Country 2019 & 2032
- Table 45: China Blood Coagulants Industry Revenue (Million) Forecast, by Application 2019 & 2032
- Table 46: China Blood Coagulants Industry Volume (K Unit) Forecast, by Application 2019 & 2032
- Table 47: Japan Blood Coagulants Industry Revenue (Million) Forecast, by Application 2019 & 2032
- Table 48: Japan Blood Coagulants Industry Volume (K Unit) Forecast, by Application 2019 & 2032
- Table 49: India Blood Coagulants Industry Revenue (Million) Forecast, by Application 2019 & 2032
- Table 50: India Blood Coagulants Industry Volume (K Unit) Forecast, by Application 2019 & 2032
- Table 51: South Korea Blood Coagulants Industry Revenue (Million) Forecast, by Application 2019 & 2032
- Table 52: South Korea Blood Coagulants Industry Volume (K Unit) Forecast, by Application 2019 & 2032
- Table 53: Taiwan Blood Coagulants Industry Revenue (Million) Forecast, by Application 2019 & 2032
- Table 54: Taiwan Blood Coagulants Industry Volume (K Unit) Forecast, by Application 2019 & 2032
- Table 55: Australia Blood Coagulants Industry Revenue (Million) Forecast, by Application 2019 & 2032
- Table 56: Australia Blood Coagulants Industry Volume (K Unit) Forecast, by Application 2019 & 2032
- Table 57: Rest of Asia-Pacific Blood Coagulants Industry Revenue (Million) Forecast, by Application 2019 & 2032
- Table 58: Rest of Asia-Pacific Blood Coagulants Industry Volume (K Unit) Forecast, by Application 2019 & 2032
- Table 59: Global Blood Coagulants Industry Revenue Million Forecast, by Country 2019 & 2032
- Table 60: Global Blood Coagulants Industry Volume K Unit Forecast, by Country 2019 & 2032
- Table 61: Middle East Blood Coagulants Industry Revenue (Million) Forecast, by Application 2019 & 2032
- Table 62: Middle East Blood Coagulants Industry Volume (K Unit) Forecast, by Application 2019 & 2032
- Table 63: Africa Blood Coagulants Industry Revenue (Million) Forecast, by Application 2019 & 2032
- Table 64: Africa Blood Coagulants Industry Volume (K Unit) Forecast, by Application 2019 & 2032
- Table 65: Global Blood Coagulants Industry Revenue Million Forecast, by Product 2019 & 2032
- Table 66: Global Blood Coagulants Industry Volume K Unit Forecast, by Product 2019 & 2032
- Table 67: Global Blood Coagulants Industry Revenue Million Forecast, by Test Type 2019 & 2032
- Table 68: Global Blood Coagulants Industry Volume K Unit Forecast, by Test Type 2019 & 2032
- Table 69: Global Blood Coagulants Industry Revenue Million Forecast, by Technology 2019 & 2032
- Table 70: Global Blood Coagulants Industry Volume K Unit Forecast, by Technology 2019 & 2032
- Table 71: Global Blood Coagulants Industry Revenue Million Forecast, by End User 2019 & 2032
- Table 72: Global Blood Coagulants Industry Volume K Unit Forecast, by End User 2019 & 2032
- Table 73: Global Blood Coagulants Industry Revenue Million Forecast, by Country 2019 & 2032
- Table 74: Global Blood Coagulants Industry Volume K Unit Forecast, by Country 2019 & 2032
- Table 75: United States Blood Coagulants Industry Revenue (Million) Forecast, by Application 2019 & 2032
- Table 76: United States Blood Coagulants Industry Volume (K Unit) Forecast, by Application 2019 & 2032
- Table 77: Canada Blood Coagulants Industry Revenue (Million) Forecast, by Application 2019 & 2032
- Table 78: Canada Blood Coagulants Industry Volume (K Unit) Forecast, by Application 2019 & 2032
- Table 79: Mexico Blood Coagulants Industry Revenue (Million) Forecast, by Application 2019 & 2032
- Table 80: Mexico Blood Coagulants Industry Volume (K Unit) Forecast, by Application 2019 & 2032
- Table 81: Global Blood Coagulants Industry Revenue Million Forecast, by Product 2019 & 2032
- Table 82: Global Blood Coagulants Industry Volume K Unit Forecast, by Product 2019 & 2032
- Table 83: Global Blood Coagulants Industry Revenue Million Forecast, by Test Type 2019 & 2032
- Table 84: Global Blood Coagulants Industry Volume K Unit Forecast, by Test Type 2019 & 2032
- Table 85: Global Blood Coagulants Industry Revenue Million Forecast, by Technology 2019 & 2032
- Table 86: Global Blood Coagulants Industry Volume K Unit Forecast, by Technology 2019 & 2032
- Table 87: Global Blood Coagulants Industry Revenue Million Forecast, by End User 2019 & 2032
- Table 88: Global Blood Coagulants Industry Volume K Unit Forecast, by End User 2019 & 2032
- Table 89: Global Blood Coagulants Industry Revenue Million Forecast, by Country 2019 & 2032
- Table 90: Global Blood Coagulants Industry Volume K Unit Forecast, by Country 2019 & 2032
- Table 91: Germany Blood Coagulants Industry Revenue (Million) Forecast, by Application 2019 & 2032
- Table 92: Germany Blood Coagulants Industry Volume (K Unit) Forecast, by Application 2019 & 2032
- Table 93: United Kingdom Blood Coagulants Industry Revenue (Million) Forecast, by Application 2019 & 2032
- Table 94: United Kingdom Blood Coagulants Industry Volume (K Unit) Forecast, by Application 2019 & 2032
- Table 95: France Blood Coagulants Industry Revenue (Million) Forecast, by Application 2019 & 2032
- Table 96: France Blood Coagulants Industry Volume (K Unit) Forecast, by Application 2019 & 2032
- Table 97: Italy Blood Coagulants Industry Revenue (Million) Forecast, by Application 2019 & 2032
- Table 98: Italy Blood Coagulants Industry Volume (K Unit) Forecast, by Application 2019 & 2032
- Table 99: Spain Blood Coagulants Industry Revenue (Million) Forecast, by Application 2019 & 2032
- Table 100: Spain Blood Coagulants Industry Volume (K Unit) Forecast, by Application 2019 & 2032
- Table 101: Rest of Europe Blood Coagulants Industry Revenue (Million) Forecast, by Application 2019 & 2032
- Table 102: Rest of Europe Blood Coagulants Industry Volume (K Unit) Forecast, by Application 2019 & 2032
- Table 103: Global Blood Coagulants Industry Revenue Million Forecast, by Product 2019 & 2032
- Table 104: Global Blood Coagulants Industry Volume K Unit Forecast, by Product 2019 & 2032
- Table 105: Global Blood Coagulants Industry Revenue Million Forecast, by Test Type 2019 & 2032
- Table 106: Global Blood Coagulants Industry Volume K Unit Forecast, by Test Type 2019 & 2032
- Table 107: Global Blood Coagulants Industry Revenue Million Forecast, by Technology 2019 & 2032
- Table 108: Global Blood Coagulants Industry Volume K Unit Forecast, by Technology 2019 & 2032
- Table 109: Global Blood Coagulants Industry Revenue Million Forecast, by End User 2019 & 2032
- Table 110: Global Blood Coagulants Industry Volume K Unit Forecast, by End User 2019 & 2032
- Table 111: Global Blood Coagulants Industry Revenue Million Forecast, by Country 2019 & 2032
- Table 112: Global Blood Coagulants Industry Volume K Unit Forecast, by Country 2019 & 2032
- Table 113: China Blood Coagulants Industry Revenue (Million) Forecast, by Application 2019 & 2032
- Table 114: China Blood Coagulants Industry Volume (K Unit) Forecast, by Application 2019 & 2032
- Table 115: Japan Blood Coagulants Industry Revenue (Million) Forecast, by Application 2019 & 2032
- Table 116: Japan Blood Coagulants Industry Volume (K Unit) Forecast, by Application 2019 & 2032
- Table 117: India Blood Coagulants Industry Revenue (Million) Forecast, by Application 2019 & 2032
- Table 118: India Blood Coagulants Industry Volume (K Unit) Forecast, by Application 2019 & 2032
- Table 119: Australia Blood Coagulants Industry Revenue (Million) Forecast, by Application 2019 & 2032
- Table 120: Australia Blood Coagulants Industry Volume (K Unit) Forecast, by Application 2019 & 2032
- Table 121: South Korea Blood Coagulants Industry Revenue (Million) Forecast, by Application 2019 & 2032
- Table 122: South Korea Blood Coagulants Industry Volume (K Unit) Forecast, by Application 2019 & 2032
- Table 123: Rest of Asia Pacific Blood Coagulants Industry Revenue (Million) Forecast, by Application 2019 & 2032
- Table 124: Rest of Asia Pacific Blood Coagulants Industry Volume (K Unit) Forecast, by Application 2019 & 2032
- Table 125: Global Blood Coagulants Industry Revenue Million Forecast, by Product 2019 & 2032
- Table 126: Global Blood Coagulants Industry Volume K Unit Forecast, by Product 2019 & 2032
- Table 127: Global Blood Coagulants Industry Revenue Million Forecast, by Test Type 2019 & 2032
- Table 128: Global Blood Coagulants Industry Volume K Unit Forecast, by Test Type 2019 & 2032
- Table 129: Global Blood Coagulants Industry Revenue Million Forecast, by Technology 2019 & 2032
- Table 130: Global Blood Coagulants Industry Volume K Unit Forecast, by Technology 2019 & 2032
- Table 131: Global Blood Coagulants Industry Revenue Million Forecast, by End User 2019 & 2032
- Table 132: Global Blood Coagulants Industry Volume K Unit Forecast, by End User 2019 & 2032
- Table 133: Global Blood Coagulants Industry Revenue Million Forecast, by Country 2019 & 2032
- Table 134: Global Blood Coagulants Industry Volume K Unit Forecast, by Country 2019 & 2032
- Table 135: GCC Blood Coagulants Industry Revenue (Million) Forecast, by Application 2019 & 2032
- Table 136: GCC Blood Coagulants Industry Volume (K Unit) Forecast, by Application 2019 & 2032
- Table 137: South Africa Blood Coagulants Industry Revenue (Million) Forecast, by Application 2019 & 2032
- Table 138: South Africa Blood Coagulants Industry Volume (K Unit) Forecast, by Application 2019 & 2032
- Table 139: Rest of Middle East and Africa Blood Coagulants Industry Revenue (Million) Forecast, by Application 2019 & 2032
- Table 140: Rest of Middle East and Africa Blood Coagulants Industry Volume (K Unit) Forecast, by Application 2019 & 2032
- Table 141: Global Blood Coagulants Industry Revenue Million Forecast, by Product 2019 & 2032
- Table 142: Global Blood Coagulants Industry Volume K Unit Forecast, by Product 2019 & 2032
- Table 143: Global Blood Coagulants Industry Revenue Million Forecast, by Test Type 2019 & 2032
- Table 144: Global Blood Coagulants Industry Volume K Unit Forecast, by Test Type 2019 & 2032
- Table 145: Global Blood Coagulants Industry Revenue Million Forecast, by Technology 2019 & 2032
- Table 146: Global Blood Coagulants Industry Volume K Unit Forecast, by Technology 2019 & 2032
- Table 147: Global Blood Coagulants Industry Revenue Million Forecast, by End User 2019 & 2032
- Table 148: Global Blood Coagulants Industry Volume K Unit Forecast, by End User 2019 & 2032
- Table 149: Global Blood Coagulants Industry Revenue Million Forecast, by Country 2019 & 2032
- Table 150: Global Blood Coagulants Industry Volume K Unit Forecast, by Country 2019 & 2032
- Table 151: Brazil Blood Coagulants Industry Revenue (Million) Forecast, by Application 2019 & 2032
- Table 152: Brazil Blood Coagulants Industry Volume (K Unit) Forecast, by Application 2019 & 2032
- Table 153: Argentina Blood Coagulants Industry Revenue (Million) Forecast, by Application 2019 & 2032
- Table 154: Argentina Blood Coagulants Industry Volume (K Unit) Forecast, by Application 2019 & 2032
- Table 155: Rest of South America Blood Coagulants Industry Revenue (Million) Forecast, by Application 2019 & 2032
- Table 156: Rest of South America Blood Coagulants Industry Volume (K Unit) Forecast, by Application 2019 & 2032
Frequently Asked Questions
1. What is the projected Compound Annual Growth Rate (CAGR) of the Blood Coagulants Industry?
The projected CAGR is approximately 8.85%.
2. Which companies are prominent players in the Blood Coagulants Industry?
Key companies in the market include Beckman Coulter Inc, Meril Life Science Pvt Ltd, Siemens Healthcare, F Hoffmann-La Roche Ltd, Horiba, Thermo Fisher Scientific Inc, Trivitron Healthcare, Eurolyser Diagnostica GmbH, Abbott Laboratories, Helena Laboratories, Diagnostica Stago Sas, Nihon Kohden Corporation.
3. What are the main segments of the Blood Coagulants Industry?
The market segments include Product, Test Type, Technology, End User.
4. Can you provide details about the market size?
The market size is estimated to be USD XX Million as of 2022.
5. What are some drivers contributing to market growth?
Increasing Prevalence of Chronic Blood Disorders; Rising Geriatric Population Coupled with Increasing Prevalence of Chronic Diseases; Increasing Laboratory Automation.
6. What are the notable trends driving market growth?
D-Dimer Testing Segment is Expected to Dominate the Market During the Forecast Period.
7. Are there any restraints impacting market growth?
Slow Adoption Rate in Underdeveloped Economies; High Cost of Test for Fully Automated Analyzers.
8. Can you provide examples of recent developments in the market?
In October 2021, Trivitron Healthcare, a medical devices company launched a new line of Coagulation Analyzer products in India manufactured by Diagon Ltd.
9. What pricing options are available for accessing the report?
Pricing options include single-user, multi-user, and enterprise licenses priced at USD 4750, USD 5250, and USD 8750 respectively.
10. Is the market size provided in terms of value or volume?
The market size is provided in terms of value, measured in Million and volume, measured in K Unit.
11. Are there any specific market keywords associated with the report?
Yes, the market keyword associated with the report is "Blood Coagulants Industry," which aids in identifying and referencing the specific market segment covered.
12. How do I determine which pricing option suits my needs best?
The pricing options vary based on user requirements and access needs. Individual users may opt for single-user licenses, while businesses requiring broader access may choose multi-user or enterprise licenses for cost-effective access to the report.
13. Are there any additional resources or data provided in the Blood Coagulants Industry report?
While the report offers comprehensive insights, it's advisable to review the specific contents or supplementary materials provided to ascertain if additional resources or data are available.
14. How can I stay updated on further developments or reports in the Blood Coagulants Industry?
To stay informed about further developments, trends, and reports in the Blood Coagulants Industry, consider subscribing to industry newsletters, following relevant companies and organizations, or regularly checking reputable industry news sources and publications.
Methodology
Step 1 - Identification of Relevant Samples Size from Population Database


Step 2 - Approaches for Defining Global Market Size (Value, Volume* & Price*)

Note*: In applicable scenarios
Step 3 - Data Sources
Primary Research
- Web Analytics
- Survey Reports
- Research Institute
- Latest Research Reports
- Opinion Leaders
Secondary Research
- Annual Reports
- White Paper
- Latest Press Release
- Industry Association
- Paid Database
- Investor Presentations

Step 4 - Data Triangulation
Involves using different sources of information in order to increase the validity of a study
These sources are likely to be stakeholders in a program - participants, other researchers, program staff, other community members, and so on.
Then we put all data in single framework & apply various statistical tools to find out the dynamic on the market.
During the analysis stage, feedback from the stakeholder groups would be compared to determine areas of agreement as well as areas of divergence


