
Key Insights
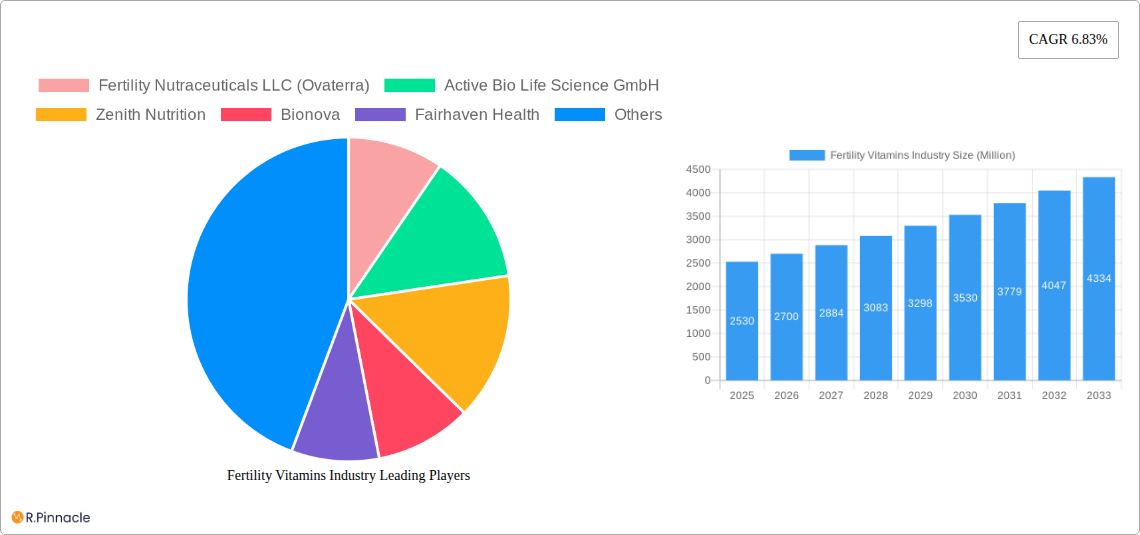
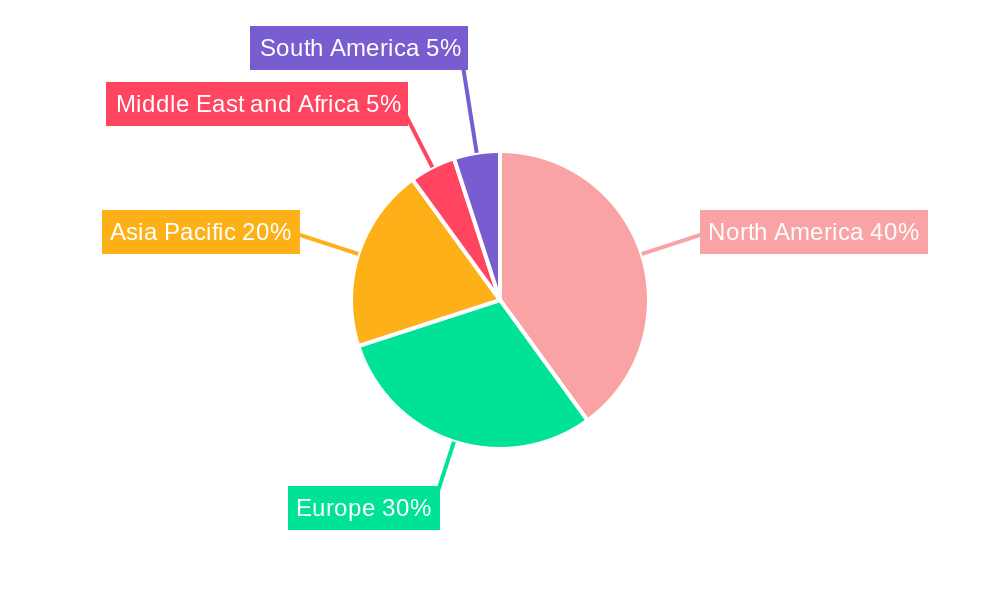
The fertility vitamins market, valued at $2.53 billion in 2025, is projected to experience robust growth, exhibiting a Compound Annual Growth Rate (CAGR) of 6.83% from 2025 to 2033. This expansion is driven by several key factors. Increasing awareness of the importance of preconception health and nutritional support for fertility is fueling demand. The rising prevalence of infertility globally, coupled with advancements in reproductive technologies, further contributes to market growth. Consumer preference for natural ingredients is a significant trend, leading to increased demand for fertility supplements containing vitamins, minerals, and herbal extracts. The convenience offered by e-pharmacy channels is also boosting market penetration. However, stringent regulatory requirements and concerns regarding the efficacy and safety of some supplements pose challenges to market expansion. The market is segmented by ingredient type (natural, synthetic, blends), product format (capsules, tablets, soft gels, others), and distribution channel (retail pharmacy, e-pharmacy, others). North America currently holds a significant market share, driven by high awareness and disposable income. However, Asia-Pacific is anticipated to witness substantial growth due to its large population base and increasing adoption of fertility treatments.
The competitive landscape is characterized by both established players and emerging companies focused on specialized fertility-supporting products. Key players are strategically investing in research and development to enhance product efficacy and expand their product portfolios. Furthermore, collaborations with healthcare professionals and educational initiatives are crucial in shaping consumer perception and driving market growth. The market's future hinges on continued innovation, particularly in developing personalized formulations that address specific nutritional deficiencies and individual needs. Stringent quality control and regulatory compliance will be paramount in maintaining consumer trust and ensuring responsible market development. The increasing integration of digital marketing and telehealth will likely amplify market reach and accessibility.
Fertility Vitamins Industry: A Comprehensive Market Report (2019-2033)
This comprehensive report provides an in-depth analysis of the global fertility vitamins market, offering invaluable insights for industry professionals, investors, and stakeholders. With a study period spanning 2019-2033, a base year of 2025, and a forecast period of 2025-2033, this report delivers a detailed understanding of market dynamics, growth drivers, and future opportunities. The market is projected to reach xx Million by 2033, exhibiting a CAGR of xx% during the forecast period.
Fertility Vitamins Industry Market Structure & Innovation Trends
The fertility vitamins market exhibits a moderately concentrated structure, with key players holding significant market share. The top 10 companies, including Fertility Nutraceuticals LLC (Ovaterra), Active Bio Life Science GmbH, Zenith Nutrition, Bionova, Fairhaven Health, Coast Science, Orthomol Pharmazeutische Vertriebs GmbH, LENUS Pharma GesmbH, Vitabiotics Ltd, and Exeltis USA Inc., collectively account for approximately xx% of the global market. Innovation is driven by the increasing demand for premium, specialized formulations catering to specific needs and preferences, coupled with technological advancements in supplement delivery and efficacy. Regulatory frameworks vary across regions, influencing product development and market access. Substitutes include traditional fertility treatments and dietary changes. The market is largely driven by the growing prevalence of infertility and increasing awareness of the role of nutrition in reproductive health. M&A activity within the sector is moderate, with total deal values estimated at xx Million in the historical period (2019-2024). Recent deals have focused primarily on expanding product portfolios and geographic reach.
- Market Concentration: Top 10 players account for approximately xx% of the market.
- Innovation Drivers: Growing demand for specialized formulations and technological advancements.
- Regulatory Frameworks: Vary across regions, influencing product development and market access.
- M&A Activity (2019-2024): Total deal value estimated at xx Million.
Fertility Vitamins Industry Market Dynamics & Trends
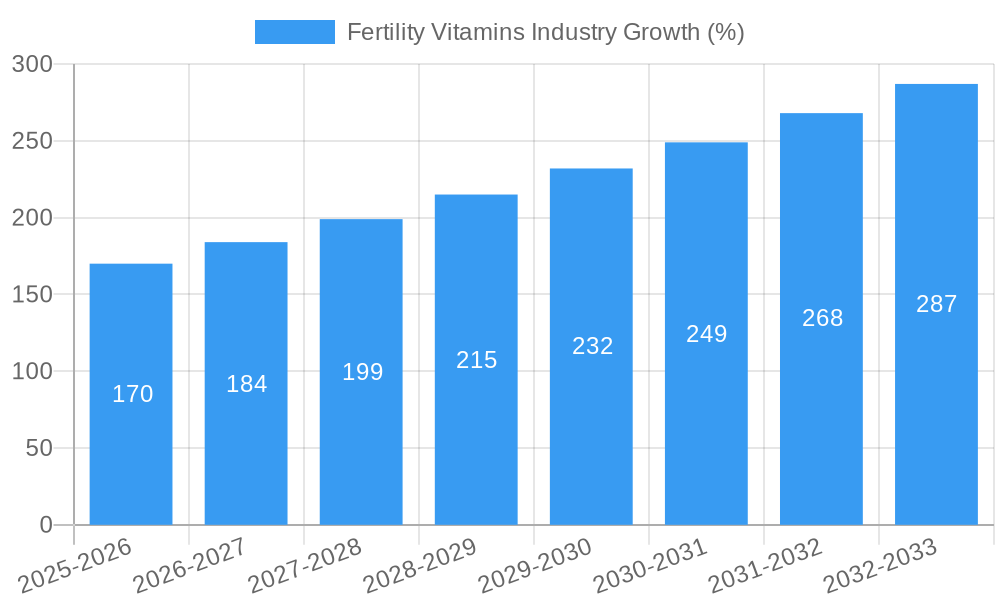
The fertility vitamins market is experiencing robust growth, fueled by several key factors. Rising infertility rates globally are a significant driver, along with increasing awareness of the role of nutrition in reproductive health. Consumer preference for natural and organic ingredients is also impacting product development. Technological advancements in supplement formulation and delivery systems are further boosting market growth. Competitive dynamics are characterized by product differentiation, branding, and marketing strategies. The market penetration rate for fertility vitamins is increasing steadily, currently estimated at xx%, with projections exceeding xx% by 2033. The market exhibits a significant growth trajectory, with a projected CAGR of xx% during the forecast period.
Dominant Regions & Segments in Fertility Vitamins Industry
The North American region currently holds the largest market share in the fertility vitamins industry, driven by high consumer awareness, strong healthcare infrastructure, and a robust retail pharmacy network. Within product segments, capsules and tablets dominate the market, due to convenience and ease of consumption. The natural ingredient segment holds a significant share, fueled by consumer preference for natural and organic products. Retail pharmacies remain the primary distribution channel.
- Leading Region: North America
- Dominant Product Segment: Capsules and Tablets
- Leading Ingredient Segment: Natural Ingredients
- Primary Distribution Channel: Retail Pharmacy
Key Drivers in North America:
- Strong healthcare infrastructure and consumer awareness.
- High disposable income and increasing demand for premium products.
- Robust retail pharmacy distribution network.
Fertility Vitamins Industry Product Innovations
Recent innovations focus on enhanced formulations with increased bioavailability and targeted nutrient combinations to address specific fertility challenges. Advances in encapsulation technology are resulting in improved product stability and enhanced consumer experience. The market is also witnessing the rise of personalized fertility vitamin packs catering to individual nutritional needs, based on genetic profiling and lifestyle factors. These innovations are crucial for driving market growth and enhancing product competitiveness.
Report Scope & Segmentation Analysis
This report segments the fertility vitamins market by ingredient type (Natural, Synthetic, Blend of Natural and Synthetic), product type (Capsules, Tablets, Soft Gels, Other Products), and distribution channel (Retail Pharmacy, E-pharmacy, Other Distribution Channel). Each segment provides detailed analysis of market size, growth projections, and competitive landscape. The market size for each segment is detailed in the full report, with projections demonstrating significant growth across all areas. Competitive dynamics within each segment vary, depending on product differentiation and market penetration.
Key Drivers of Fertility Vitamins Industry Growth
The rising prevalence of infertility globally is a key driver. Increased awareness of the importance of nutrition in reproductive health is also fueling market growth. Technological advancements in supplement formulation and targeted nutrient delivery systems are enhancing product efficacy and market appeal. Furthermore, government initiatives promoting reproductive health and increasing disposable incomes contribute significantly to market expansion.
Challenges in the Fertility Vitamins Industry Sector
Stringent regulatory requirements for dietary supplements pose a challenge, increasing the cost of product development and market entry. Supply chain disruptions can impact raw material availability and manufacturing costs. Intense competition among established players and the emergence of new entrants also create competitive pressures. Fluctuations in raw material prices and counterfeiting of products also represent market challenges.
Emerging Opportunities in Fertility Vitamins Industry
The growing adoption of personalized nutrition and the increasing use of telehealth platforms present significant opportunities. Expansion into emerging markets with high unmet needs offers substantial growth potential. Advancements in targeted nutrient delivery technologies and the development of innovative product formulations are also key opportunities. Exploring new market segments and diversifying product portfolios are crucial for future expansion.
Leading Players in the Fertility Vitamins Industry Market
- Fertility Nutraceuticals LLC (Ovaterra)
- Active Bio Life Science GmbH
- Zenith Nutrition
- Bionova
- Fairhaven Health
- Coast Science
- Orthomol Pharmazeutische Vertriebs GmbH
- LENUS Pharma GesmbH
- Vitabiotics Ltd
- Exeltis USA Inc
Key Developments in Fertility Vitamins Industry
- April 2022: Ovaterra launched two new prenatal vitamin supplements.
- February 2022: EMD Serono launched Slim Pack fertility medication packaging.
Future Outlook for Fertility Vitamins Industry Market
The fertility vitamins market is poised for continued robust growth, driven by factors such as rising infertility rates and increasing consumer awareness. Technological advancements will continue to shape product innovation, improving efficacy and creating opportunities for personalized solutions. Strategic collaborations and market expansion into emerging economies will further enhance growth prospects.
Fertility Vitamins Industry Segmentation
-
1. Ingredient
- 1.1. Natural
- 1.2. Synthetic
- 1.3. Blend of Natural and Synthetic
-
2. Product
- 2.1. Capsules
- 2.2. Tablets
- 2.3. Soft Gels
- 2.4. Other Products
-
3. Distribution Channel
- 3.1. Retail Pharmacy
- 3.2. E-pharmacy
- 3.3. Other Distribution Channel
Fertility Vitamins Industry Segmentation By Geography
-
1. North America
- 1.1. United States
- 1.2. Canada
- 1.3. Mexico
-
2. Europe
- 2.1. United Kingdom
- 2.2. France
- 2.3. Germany
- 2.4. Italy
- 2.5. Spain
- 2.6. Rest of Europe
-
3. Asia Pacific
- 3.1. India
- 3.2. China
- 3.3. Japan
- 3.4. Australia
- 3.5. South Korea
- 3.6. Rest of Asia Pacific
-
4. Middle East and Africa
- 4.1. GCC
- 4.2. South Africa
- 4.3. Rest of Middle East and Africa
-
5. South America
- 5.1. Brazil
- 5.2. Argentina
- 5.3. Rest of South America
Fertility Vitamins Industry REPORT HIGHLIGHTS
| Aspects | Details |
|---|---|
| Study Period | 2019-2033 |
| Base Year | 2024 |
| Estimated Year | 2025 |
| Forecast Period | 2025-2033 |
| Historical Period | 2019-2024 |
| Growth Rate | CAGR of 6.83% from 2019-2033 |
| Segmentation |
|
Table of Contents
- 1. Introduction
- 1.1. Research Scope
- 1.2. Market Segmentation
- 1.3. Research Methodology
- 1.4. Definitions and Assumptions
- 2. Executive Summary
- 2.1. Introduction
- 3. Market Dynamics
- 3.1. Introduction
- 3.2. Market Drivers
- 3.2.1. Increasing Infertility Rate; Increase in Stress Level and Consumption of Alcohol and Frequent Smoking; Increasing Demand for Natural Ingredients
- 3.3. Market Restrains
- 3.3.1. Government Regulations to Control Birth Rate; Lack of Awareness About Available Products
- 3.4. Market Trends
- 3.4.1. E-pharmacy is Expected to Dominate the Fertility Supplement Market Over the Forecast Period
- 4. Market Factor Analysis
- 4.1. Porters Five Forces
- 4.2. Supply/Value Chain
- 4.3. PESTEL analysis
- 4.4. Market Entropy
- 4.5. Patent/Trademark Analysis
- 5. Global Fertility Vitamins Industry Analysis, Insights and Forecast, 2019-2031
- 5.1. Market Analysis, Insights and Forecast - by Ingredient
- 5.1.1. Natural
- 5.1.2. Synthetic
- 5.1.3. Blend of Natural and Synthetic
- 5.2. Market Analysis, Insights and Forecast - by Product
- 5.2.1. Capsules
- 5.2.2. Tablets
- 5.2.3. Soft Gels
- 5.2.4. Other Products
- 5.3. Market Analysis, Insights and Forecast - by Distribution Channel
- 5.3.1. Retail Pharmacy
- 5.3.2. E-pharmacy
- 5.3.3. Other Distribution Channel
- 5.4. Market Analysis, Insights and Forecast - by Region
- 5.4.1. North America
- 5.4.2. Europe
- 5.4.3. Asia Pacific
- 5.4.4. Middle East and Africa
- 5.4.5. South America
- 5.1. Market Analysis, Insights and Forecast - by Ingredient
- 6. North America Fertility Vitamins Industry Analysis, Insights and Forecast, 2019-2031
- 6.1. Market Analysis, Insights and Forecast - by Ingredient
- 6.1.1. Natural
- 6.1.2. Synthetic
- 6.1.3. Blend of Natural and Synthetic
- 6.2. Market Analysis, Insights and Forecast - by Product
- 6.2.1. Capsules
- 6.2.2. Tablets
- 6.2.3. Soft Gels
- 6.2.4. Other Products
- 6.3. Market Analysis, Insights and Forecast - by Distribution Channel
- 6.3.1. Retail Pharmacy
- 6.3.2. E-pharmacy
- 6.3.3. Other Distribution Channel
- 6.1. Market Analysis, Insights and Forecast - by Ingredient
- 7. Europe Fertility Vitamins Industry Analysis, Insights and Forecast, 2019-2031
- 7.1. Market Analysis, Insights and Forecast - by Ingredient
- 7.1.1. Natural
- 7.1.2. Synthetic
- 7.1.3. Blend of Natural and Synthetic
- 7.2. Market Analysis, Insights and Forecast - by Product
- 7.2.1. Capsules
- 7.2.2. Tablets
- 7.2.3. Soft Gels
- 7.2.4. Other Products
- 7.3. Market Analysis, Insights and Forecast - by Distribution Channel
- 7.3.1. Retail Pharmacy
- 7.3.2. E-pharmacy
- 7.3.3. Other Distribution Channel
- 7.1. Market Analysis, Insights and Forecast - by Ingredient
- 8. Asia Pacific Fertility Vitamins Industry Analysis, Insights and Forecast, 2019-2031
- 8.1. Market Analysis, Insights and Forecast - by Ingredient
- 8.1.1. Natural
- 8.1.2. Synthetic
- 8.1.3. Blend of Natural and Synthetic
- 8.2. Market Analysis, Insights and Forecast - by Product
- 8.2.1. Capsules
- 8.2.2. Tablets
- 8.2.3. Soft Gels
- 8.2.4. Other Products
- 8.3. Market Analysis, Insights and Forecast - by Distribution Channel
- 8.3.1. Retail Pharmacy
- 8.3.2. E-pharmacy
- 8.3.3. Other Distribution Channel
- 8.1. Market Analysis, Insights and Forecast - by Ingredient
- 9. Middle East and Africa Fertility Vitamins Industry Analysis, Insights and Forecast, 2019-2031
- 9.1. Market Analysis, Insights and Forecast - by Ingredient
- 9.1.1. Natural
- 9.1.2. Synthetic
- 9.1.3. Blend of Natural and Synthetic
- 9.2. Market Analysis, Insights and Forecast - by Product
- 9.2.1. Capsules
- 9.2.2. Tablets
- 9.2.3. Soft Gels
- 9.2.4. Other Products
- 9.3. Market Analysis, Insights and Forecast - by Distribution Channel
- 9.3.1. Retail Pharmacy
- 9.3.2. E-pharmacy
- 9.3.3. Other Distribution Channel
- 9.1. Market Analysis, Insights and Forecast - by Ingredient
- 10. South America Fertility Vitamins Industry Analysis, Insights and Forecast, 2019-2031
- 10.1. Market Analysis, Insights and Forecast - by Ingredient
- 10.1.1. Natural
- 10.1.2. Synthetic
- 10.1.3. Blend of Natural and Synthetic
- 10.2. Market Analysis, Insights and Forecast - by Product
- 10.2.1. Capsules
- 10.2.2. Tablets
- 10.2.3. Soft Gels
- 10.2.4. Other Products
- 10.3. Market Analysis, Insights and Forecast - by Distribution Channel
- 10.3.1. Retail Pharmacy
- 10.3.2. E-pharmacy
- 10.3.3. Other Distribution Channel
- 10.1. Market Analysis, Insights and Forecast - by Ingredient
- 11. North America Fertility Vitamins Industry Analysis, Insights and Forecast, 2019-2031
- 11.1. Market Analysis, Insights and Forecast - By Country/Sub-region
- 11.1.1 United States
- 11.1.2 Canada
- 11.1.3 Mexico
- 12. Europe Fertility Vitamins Industry Analysis, Insights and Forecast, 2019-2031
- 12.1. Market Analysis, Insights and Forecast - By Country/Sub-region
- 12.1.1 United Kingdom
- 12.1.2 France
- 12.1.3 Germany
- 12.1.4 Italy
- 12.1.5 Spain
- 12.1.6 Rest of Europe
- 13. Asia Pacific Fertility Vitamins Industry Analysis, Insights and Forecast, 2019-2031
- 13.1. Market Analysis, Insights and Forecast - By Country/Sub-region
- 13.1.1 India
- 13.1.2 China
- 13.1.3 Japan
- 13.1.4 Australia
- 13.1.5 South Korea
- 13.1.6 Rest of Asia Pacific
- 14. Middle East and Africa Fertility Vitamins Industry Analysis, Insights and Forecast, 2019-2031
- 14.1. Market Analysis, Insights and Forecast - By Country/Sub-region
- 14.1.1 GCC
- 14.1.2 South Africa
- 14.1.3 Rest of Middle East and Africa
- 15. South America Fertility Vitamins Industry Analysis, Insights and Forecast, 2019-2031
- 15.1. Market Analysis, Insights and Forecast - By Country/Sub-region
- 15.1.1 Brazil
- 15.1.2 Argentina
- 15.1.3 Rest of South America
- 16. Competitive Analysis
- 16.1. Global Market Share Analysis 2024
- 16.2. Company Profiles
- 16.2.1 Fertility Nutraceuticals LLC (Ovaterra)
- 16.2.1.1. Overview
- 16.2.1.2. Products
- 16.2.1.3. SWOT Analysis
- 16.2.1.4. Recent Developments
- 16.2.1.5. Financials (Based on Availability)
- 16.2.2 Active Bio Life Science GmbH
- 16.2.2.1. Overview
- 16.2.2.2. Products
- 16.2.2.3. SWOT Analysis
- 16.2.2.4. Recent Developments
- 16.2.2.5. Financials (Based on Availability)
- 16.2.3 Zenith Nutrition
- 16.2.3.1. Overview
- 16.2.3.2. Products
- 16.2.3.3. SWOT Analysis
- 16.2.3.4. Recent Developments
- 16.2.3.5. Financials (Based on Availability)
- 16.2.4 Bionova
- 16.2.4.1. Overview
- 16.2.4.2. Products
- 16.2.4.3. SWOT Analysis
- 16.2.4.4. Recent Developments
- 16.2.4.5. Financials (Based on Availability)
- 16.2.5 Fairhaven Health
- 16.2.5.1. Overview
- 16.2.5.2. Products
- 16.2.5.3. SWOT Analysis
- 16.2.5.4. Recent Developments
- 16.2.5.5. Financials (Based on Availability)
- 16.2.6 Coast Science
- 16.2.6.1. Overview
- 16.2.6.2. Products
- 16.2.6.3. SWOT Analysis
- 16.2.6.4. Recent Developments
- 16.2.6.5. Financials (Based on Availability)
- 16.2.7 Orthomol Pharmazeutische Vertriebs GmbH
- 16.2.7.1. Overview
- 16.2.7.2. Products
- 16.2.7.3. SWOT Analysis
- 16.2.7.4. Recent Developments
- 16.2.7.5. Financials (Based on Availability)
- 16.2.8 LENUS Pharma GesmbH
- 16.2.8.1. Overview
- 16.2.8.2. Products
- 16.2.8.3. SWOT Analysis
- 16.2.8.4. Recent Developments
- 16.2.8.5. Financials (Based on Availability)
- 16.2.9 Vitabiotics Ltd
- 16.2.9.1. Overview
- 16.2.9.2. Products
- 16.2.9.3. SWOT Analysis
- 16.2.9.4. Recent Developments
- 16.2.9.5. Financials (Based on Availability)
- 16.2.10 Exeltis USA Inc
- 16.2.10.1. Overview
- 16.2.10.2. Products
- 16.2.10.3. SWOT Analysis
- 16.2.10.4. Recent Developments
- 16.2.10.5. Financials (Based on Availability)
- 16.2.1 Fertility Nutraceuticals LLC (Ovaterra)
List of Figures
- Figure 1: Global Fertility Vitamins Industry Revenue Breakdown (Million, %) by Region 2024 & 2032
- Figure 2: North America Fertility Vitamins Industry Revenue (Million), by Country 2024 & 2032
- Figure 3: North America Fertility Vitamins Industry Revenue Share (%), by Country 2024 & 2032
- Figure 4: Europe Fertility Vitamins Industry Revenue (Million), by Country 2024 & 2032
- Figure 5: Europe Fertility Vitamins Industry Revenue Share (%), by Country 2024 & 2032
- Figure 6: Asia Pacific Fertility Vitamins Industry Revenue (Million), by Country 2024 & 2032
- Figure 7: Asia Pacific Fertility Vitamins Industry Revenue Share (%), by Country 2024 & 2032
- Figure 8: Middle East and Africa Fertility Vitamins Industry Revenue (Million), by Country 2024 & 2032
- Figure 9: Middle East and Africa Fertility Vitamins Industry Revenue Share (%), by Country 2024 & 2032
- Figure 10: South America Fertility Vitamins Industry Revenue (Million), by Country 2024 & 2032
- Figure 11: South America Fertility Vitamins Industry Revenue Share (%), by Country 2024 & 2032
- Figure 12: North America Fertility Vitamins Industry Revenue (Million), by Ingredient 2024 & 2032
- Figure 13: North America Fertility Vitamins Industry Revenue Share (%), by Ingredient 2024 & 2032
- Figure 14: North America Fertility Vitamins Industry Revenue (Million), by Product 2024 & 2032
- Figure 15: North America Fertility Vitamins Industry Revenue Share (%), by Product 2024 & 2032
- Figure 16: North America Fertility Vitamins Industry Revenue (Million), by Distribution Channel 2024 & 2032
- Figure 17: North America Fertility Vitamins Industry Revenue Share (%), by Distribution Channel 2024 & 2032
- Figure 18: North America Fertility Vitamins Industry Revenue (Million), by Country 2024 & 2032
- Figure 19: North America Fertility Vitamins Industry Revenue Share (%), by Country 2024 & 2032
- Figure 20: Europe Fertility Vitamins Industry Revenue (Million), by Ingredient 2024 & 2032
- Figure 21: Europe Fertility Vitamins Industry Revenue Share (%), by Ingredient 2024 & 2032
- Figure 22: Europe Fertility Vitamins Industry Revenue (Million), by Product 2024 & 2032
- Figure 23: Europe Fertility Vitamins Industry Revenue Share (%), by Product 2024 & 2032
- Figure 24: Europe Fertility Vitamins Industry Revenue (Million), by Distribution Channel 2024 & 2032
- Figure 25: Europe Fertility Vitamins Industry Revenue Share (%), by Distribution Channel 2024 & 2032
- Figure 26: Europe Fertility Vitamins Industry Revenue (Million), by Country 2024 & 2032
- Figure 27: Europe Fertility Vitamins Industry Revenue Share (%), by Country 2024 & 2032
- Figure 28: Asia Pacific Fertility Vitamins Industry Revenue (Million), by Ingredient 2024 & 2032
- Figure 29: Asia Pacific Fertility Vitamins Industry Revenue Share (%), by Ingredient 2024 & 2032
- Figure 30: Asia Pacific Fertility Vitamins Industry Revenue (Million), by Product 2024 & 2032
- Figure 31: Asia Pacific Fertility Vitamins Industry Revenue Share (%), by Product 2024 & 2032
- Figure 32: Asia Pacific Fertility Vitamins Industry Revenue (Million), by Distribution Channel 2024 & 2032
- Figure 33: Asia Pacific Fertility Vitamins Industry Revenue Share (%), by Distribution Channel 2024 & 2032
- Figure 34: Asia Pacific Fertility Vitamins Industry Revenue (Million), by Country 2024 & 2032
- Figure 35: Asia Pacific Fertility Vitamins Industry Revenue Share (%), by Country 2024 & 2032
- Figure 36: Middle East and Africa Fertility Vitamins Industry Revenue (Million), by Ingredient 2024 & 2032
- Figure 37: Middle East and Africa Fertility Vitamins Industry Revenue Share (%), by Ingredient 2024 & 2032
- Figure 38: Middle East and Africa Fertility Vitamins Industry Revenue (Million), by Product 2024 & 2032
- Figure 39: Middle East and Africa Fertility Vitamins Industry Revenue Share (%), by Product 2024 & 2032
- Figure 40: Middle East and Africa Fertility Vitamins Industry Revenue (Million), by Distribution Channel 2024 & 2032
- Figure 41: Middle East and Africa Fertility Vitamins Industry Revenue Share (%), by Distribution Channel 2024 & 2032
- Figure 42: Middle East and Africa Fertility Vitamins Industry Revenue (Million), by Country 2024 & 2032
- Figure 43: Middle East and Africa Fertility Vitamins Industry Revenue Share (%), by Country 2024 & 2032
- Figure 44: South America Fertility Vitamins Industry Revenue (Million), by Ingredient 2024 & 2032
- Figure 45: South America Fertility Vitamins Industry Revenue Share (%), by Ingredient 2024 & 2032
- Figure 46: South America Fertility Vitamins Industry Revenue (Million), by Product 2024 & 2032
- Figure 47: South America Fertility Vitamins Industry Revenue Share (%), by Product 2024 & 2032
- Figure 48: South America Fertility Vitamins Industry Revenue (Million), by Distribution Channel 2024 & 2032
- Figure 49: South America Fertility Vitamins Industry Revenue Share (%), by Distribution Channel 2024 & 2032
- Figure 50: South America Fertility Vitamins Industry Revenue (Million), by Country 2024 & 2032
- Figure 51: South America Fertility Vitamins Industry Revenue Share (%), by Country 2024 & 2032
List of Tables
- Table 1: Global Fertility Vitamins Industry Revenue Million Forecast, by Region 2019 & 2032
- Table 2: Global Fertility Vitamins Industry Revenue Million Forecast, by Ingredient 2019 & 2032
- Table 3: Global Fertility Vitamins Industry Revenue Million Forecast, by Product 2019 & 2032
- Table 4: Global Fertility Vitamins Industry Revenue Million Forecast, by Distribution Channel 2019 & 2032
- Table 5: Global Fertility Vitamins Industry Revenue Million Forecast, by Region 2019 & 2032
- Table 6: Global Fertility Vitamins Industry Revenue Million Forecast, by Country 2019 & 2032
- Table 7: United States Fertility Vitamins Industry Revenue (Million) Forecast, by Application 2019 & 2032
- Table 8: Canada Fertility Vitamins Industry Revenue (Million) Forecast, by Application 2019 & 2032
- Table 9: Mexico Fertility Vitamins Industry Revenue (Million) Forecast, by Application 2019 & 2032
- Table 10: Global Fertility Vitamins Industry Revenue Million Forecast, by Country 2019 & 2032
- Table 11: United Kingdom Fertility Vitamins Industry Revenue (Million) Forecast, by Application 2019 & 2032
- Table 12: France Fertility Vitamins Industry Revenue (Million) Forecast, by Application 2019 & 2032
- Table 13: Germany Fertility Vitamins Industry Revenue (Million) Forecast, by Application 2019 & 2032
- Table 14: Italy Fertility Vitamins Industry Revenue (Million) Forecast, by Application 2019 & 2032
- Table 15: Spain Fertility Vitamins Industry Revenue (Million) Forecast, by Application 2019 & 2032
- Table 16: Rest of Europe Fertility Vitamins Industry Revenue (Million) Forecast, by Application 2019 & 2032
- Table 17: Global Fertility Vitamins Industry Revenue Million Forecast, by Country 2019 & 2032
- Table 18: India Fertility Vitamins Industry Revenue (Million) Forecast, by Application 2019 & 2032
- Table 19: China Fertility Vitamins Industry Revenue (Million) Forecast, by Application 2019 & 2032
- Table 20: Japan Fertility Vitamins Industry Revenue (Million) Forecast, by Application 2019 & 2032
- Table 21: Australia Fertility Vitamins Industry Revenue (Million) Forecast, by Application 2019 & 2032
- Table 22: South Korea Fertility Vitamins Industry Revenue (Million) Forecast, by Application 2019 & 2032
- Table 23: Rest of Asia Pacific Fertility Vitamins Industry Revenue (Million) Forecast, by Application 2019 & 2032
- Table 24: Global Fertility Vitamins Industry Revenue Million Forecast, by Country 2019 & 2032
- Table 25: GCC Fertility Vitamins Industry Revenue (Million) Forecast, by Application 2019 & 2032
- Table 26: South Africa Fertility Vitamins Industry Revenue (Million) Forecast, by Application 2019 & 2032
- Table 27: Rest of Middle East and Africa Fertility Vitamins Industry Revenue (Million) Forecast, by Application 2019 & 2032
- Table 28: Global Fertility Vitamins Industry Revenue Million Forecast, by Country 2019 & 2032
- Table 29: Brazil Fertility Vitamins Industry Revenue (Million) Forecast, by Application 2019 & 2032
- Table 30: Argentina Fertility Vitamins Industry Revenue (Million) Forecast, by Application 2019 & 2032
- Table 31: Rest of South America Fertility Vitamins Industry Revenue (Million) Forecast, by Application 2019 & 2032
- Table 32: Global Fertility Vitamins Industry Revenue Million Forecast, by Ingredient 2019 & 2032
- Table 33: Global Fertility Vitamins Industry Revenue Million Forecast, by Product 2019 & 2032
- Table 34: Global Fertility Vitamins Industry Revenue Million Forecast, by Distribution Channel 2019 & 2032
- Table 35: Global Fertility Vitamins Industry Revenue Million Forecast, by Country 2019 & 2032
- Table 36: United States Fertility Vitamins Industry Revenue (Million) Forecast, by Application 2019 & 2032
- Table 37: Canada Fertility Vitamins Industry Revenue (Million) Forecast, by Application 2019 & 2032
- Table 38: Mexico Fertility Vitamins Industry Revenue (Million) Forecast, by Application 2019 & 2032
- Table 39: Global Fertility Vitamins Industry Revenue Million Forecast, by Ingredient 2019 & 2032
- Table 40: Global Fertility Vitamins Industry Revenue Million Forecast, by Product 2019 & 2032
- Table 41: Global Fertility Vitamins Industry Revenue Million Forecast, by Distribution Channel 2019 & 2032
- Table 42: Global Fertility Vitamins Industry Revenue Million Forecast, by Country 2019 & 2032
- Table 43: United Kingdom Fertility Vitamins Industry Revenue (Million) Forecast, by Application 2019 & 2032
- Table 44: France Fertility Vitamins Industry Revenue (Million) Forecast, by Application 2019 & 2032
- Table 45: Germany Fertility Vitamins Industry Revenue (Million) Forecast, by Application 2019 & 2032
- Table 46: Italy Fertility Vitamins Industry Revenue (Million) Forecast, by Application 2019 & 2032
- Table 47: Spain Fertility Vitamins Industry Revenue (Million) Forecast, by Application 2019 & 2032
- Table 48: Rest of Europe Fertility Vitamins Industry Revenue (Million) Forecast, by Application 2019 & 2032
- Table 49: Global Fertility Vitamins Industry Revenue Million Forecast, by Ingredient 2019 & 2032
- Table 50: Global Fertility Vitamins Industry Revenue Million Forecast, by Product 2019 & 2032
- Table 51: Global Fertility Vitamins Industry Revenue Million Forecast, by Distribution Channel 2019 & 2032
- Table 52: Global Fertility Vitamins Industry Revenue Million Forecast, by Country 2019 & 2032
- Table 53: India Fertility Vitamins Industry Revenue (Million) Forecast, by Application 2019 & 2032
- Table 54: China Fertility Vitamins Industry Revenue (Million) Forecast, by Application 2019 & 2032
- Table 55: Japan Fertility Vitamins Industry Revenue (Million) Forecast, by Application 2019 & 2032
- Table 56: Australia Fertility Vitamins Industry Revenue (Million) Forecast, by Application 2019 & 2032
- Table 57: South Korea Fertility Vitamins Industry Revenue (Million) Forecast, by Application 2019 & 2032
- Table 58: Rest of Asia Pacific Fertility Vitamins Industry Revenue (Million) Forecast, by Application 2019 & 2032
- Table 59: Global Fertility Vitamins Industry Revenue Million Forecast, by Ingredient 2019 & 2032
- Table 60: Global Fertility Vitamins Industry Revenue Million Forecast, by Product 2019 & 2032
- Table 61: Global Fertility Vitamins Industry Revenue Million Forecast, by Distribution Channel 2019 & 2032
- Table 62: Global Fertility Vitamins Industry Revenue Million Forecast, by Country 2019 & 2032
- Table 63: GCC Fertility Vitamins Industry Revenue (Million) Forecast, by Application 2019 & 2032
- Table 64: South Africa Fertility Vitamins Industry Revenue (Million) Forecast, by Application 2019 & 2032
- Table 65: Rest of Middle East and Africa Fertility Vitamins Industry Revenue (Million) Forecast, by Application 2019 & 2032
- Table 66: Global Fertility Vitamins Industry Revenue Million Forecast, by Ingredient 2019 & 2032
- Table 67: Global Fertility Vitamins Industry Revenue Million Forecast, by Product 2019 & 2032
- Table 68: Global Fertility Vitamins Industry Revenue Million Forecast, by Distribution Channel 2019 & 2032
- Table 69: Global Fertility Vitamins Industry Revenue Million Forecast, by Country 2019 & 2032
- Table 70: Brazil Fertility Vitamins Industry Revenue (Million) Forecast, by Application 2019 & 2032
- Table 71: Argentina Fertility Vitamins Industry Revenue (Million) Forecast, by Application 2019 & 2032
- Table 72: Rest of South America Fertility Vitamins Industry Revenue (Million) Forecast, by Application 2019 & 2032
Frequently Asked Questions
1. What is the projected Compound Annual Growth Rate (CAGR) of the Fertility Vitamins Industry?
The projected CAGR is approximately 6.83%.
2. Which companies are prominent players in the Fertility Vitamins Industry?
Key companies in the market include Fertility Nutraceuticals LLC (Ovaterra), Active Bio Life Science GmbH, Zenith Nutrition, Bionova, Fairhaven Health, Coast Science, Orthomol Pharmazeutische Vertriebs GmbH, LENUS Pharma GesmbH, Vitabiotics Ltd, Exeltis USA Inc.
3. What are the main segments of the Fertility Vitamins Industry?
The market segments include Ingredient, Product , Distribution Channel.
4. Can you provide details about the market size?
The market size is estimated to be USD 2.53 Million as of 2022.
5. What are some drivers contributing to market growth?
Increasing Infertility Rate; Increase in Stress Level and Consumption of Alcohol and Frequent Smoking; Increasing Demand for Natural Ingredients.
6. What are the notable trends driving market growth?
E-pharmacy is Expected to Dominate the Fertility Supplement Market Over the Forecast Period.
7. Are there any restraints impacting market growth?
Government Regulations to Control Birth Rate; Lack of Awareness About Available Products.
8. Can you provide examples of recent developments in the market?
In April 2022, Ovaterra by Fertility Nutraceuticals, a reproductive health company, launched two new prenatal vitamin supplements. They are prenatal capsules formulated with the full recommended daily value of choline for pregnant and nursing women, packaged in individual servings for on-the-go.
9. What pricing options are available for accessing the report?
Pricing options include single-user, multi-user, and enterprise licenses priced at USD 4750, USD 5250, and USD 8750 respectively.
10. Is the market size provided in terms of value or volume?
The market size is provided in terms of value, measured in Million.
11. Are there any specific market keywords associated with the report?
Yes, the market keyword associated with the report is "Fertility Vitamins Industry," which aids in identifying and referencing the specific market segment covered.
12. How do I determine which pricing option suits my needs best?
The pricing options vary based on user requirements and access needs. Individual users may opt for single-user licenses, while businesses requiring broader access may choose multi-user or enterprise licenses for cost-effective access to the report.
13. Are there any additional resources or data provided in the Fertility Vitamins Industry report?
While the report offers comprehensive insights, it's advisable to review the specific contents or supplementary materials provided to ascertain if additional resources or data are available.
14. How can I stay updated on further developments or reports in the Fertility Vitamins Industry?
To stay informed about further developments, trends, and reports in the Fertility Vitamins Industry, consider subscribing to industry newsletters, following relevant companies and organizations, or regularly checking reputable industry news sources and publications.
Methodology
Step 1 - Identification of Relevant Samples Size from Population Database


Step 2 - Approaches for Defining Global Market Size (Value, Volume* & Price*)

Note*: In applicable scenarios
Step 3 - Data Sources
Primary Research
- Web Analytics
- Survey Reports
- Research Institute
- Latest Research Reports
- Opinion Leaders
Secondary Research
- Annual Reports
- White Paper
- Latest Press Release
- Industry Association
- Paid Database
- Investor Presentations

Step 4 - Data Triangulation
Involves using different sources of information in order to increase the validity of a study
These sources are likely to be stakeholders in a program - participants, other researchers, program staff, other community members, and so on.
Then we put all data in single framework & apply various statistical tools to find out the dynamic on the market.
During the analysis stage, feedback from the stakeholder groups would be compared to determine areas of agreement as well as areas of divergence


