
Key Insights
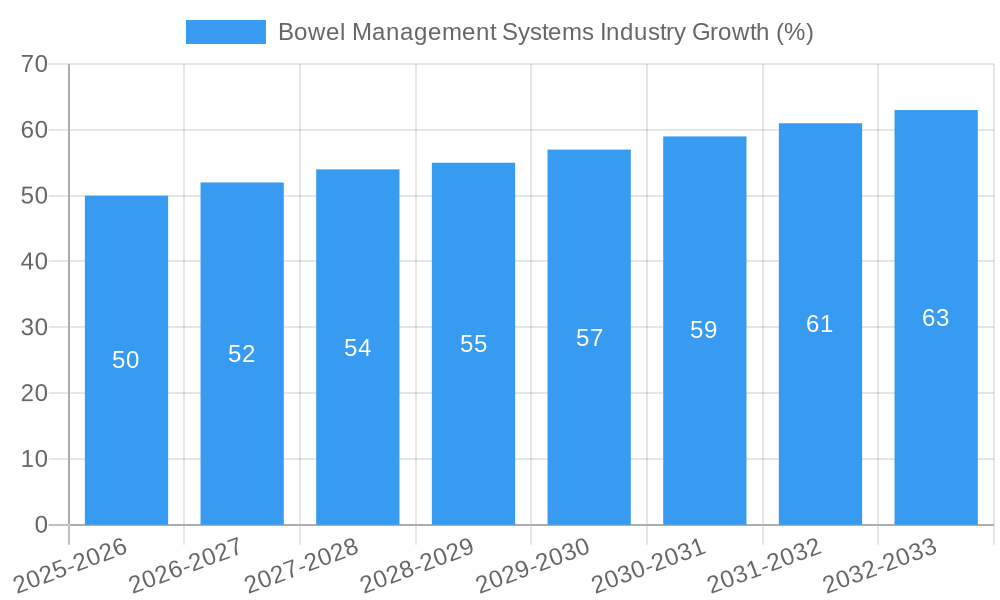
The global bowel management systems market is experiencing steady growth, driven by increasing prevalence of bowel disorders, an aging population requiring specialized care, and advancements in medical technology. The market, estimated at $XX million in 2025, is projected to exhibit a compound annual growth rate (CAGR) of 3.30% from 2025 to 2033. This growth is fueled by several key factors. The rising incidence of colorectal cancer, inflammatory bowel disease (IBD), and other gastrointestinal conditions necessitates effective bowel management solutions. Furthermore, technological advancements, such as the development of improved colostomy bags, sophisticated irrigation systems, and minimally invasive nerve modulation devices, are enhancing patient comfort and improving treatment outcomes. The increasing adoption of minimally invasive surgical techniques also contributes to the market's growth, as these procedures often lead to a higher demand for post-operative bowel management solutions. Hospitals and ambulatory care centers represent significant end-user segments, reflecting the institutionalized nature of bowel management treatment. While the adult patient segment dominates, the paediatric segment is also experiencing growth due to increased awareness and improved treatment options for children with bowel disorders. Geographic variations exist, with North America and Europe currently holding substantial market shares, but the Asia-Pacific region is expected to witness significant growth driven by rising healthcare expenditure and increasing awareness. However, high costs associated with advanced bowel management systems and limited healthcare access in certain regions pose challenges to the market's expansion.
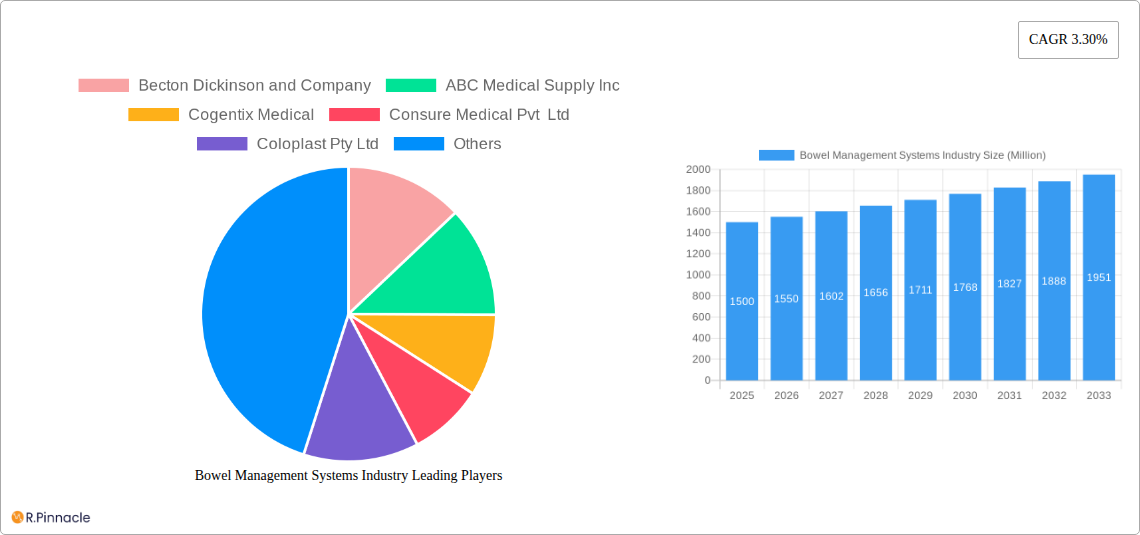
The competitive landscape is relatively consolidated, with key players such as Becton Dickinson, Coloplast, ConvaTec, Medtronic, and Hollister Incorporated holding significant market shares. These companies are focused on innovation, product diversification, and strategic partnerships to maintain their competitive edge. Future market growth will be largely influenced by technological innovation, regulatory approvals for new products, the development of cost-effective solutions, and expansion into emerging markets. Specific growth opportunities exist in developing advanced, user-friendly products that improve patient outcomes and address unmet needs within the bowel management sector. This includes integrating advanced technologies like smart sensors and telehealth platforms to monitor patients and improve care management. Furthermore, exploring new delivery systems and treatment approaches for bowel management holds potential for future market expansion.
Bowel Management Systems Industry: A Comprehensive Market Report (2019-2033)
This comprehensive report provides an in-depth analysis of the global bowel management systems industry, offering invaluable insights for industry professionals, investors, and strategic decision-makers. Covering the period from 2019 to 2033, with a base year of 2025 and a forecast period of 2025-2033, this report meticulously examines market dynamics, segmentation, key players, and future trends. The market is projected to reach xx Million by 2033, exhibiting a robust CAGR of xx% during the forecast period.
Bowel Management Systems Industry Market Structure & Innovation Trends
The bowel management systems market exhibits a moderately concentrated structure, with key players like Becton Dickinson and Company, Coloplast Pty Ltd, ConvaTec Group PLC, Medtronic PLC, and Hollister Incorporated holding significant market share. The estimated combined market share of these top five players is approximately xx%. Innovation is driven by advancements in materials science, miniaturization, and improved user experience. Regulatory frameworks, particularly concerning medical device approvals, significantly influence market dynamics. The market also faces competition from substitute therapies and alternative approaches to bowel management. M&A activity has been moderate, with recent deals valued at approximately xx Million, primarily focused on expanding product portfolios and geographical reach. End-user demographics are shifting towards an aging population, necessitating products tailored for geriatric patients.
- Market Concentration: Moderately concentrated, top 5 players holding approximately xx% market share.
- Innovation Drivers: Advancements in materials, miniaturization, user experience.
- Regulatory Landscape: Stringent medical device approvals significantly impact market access.
- M&A Activity: Moderate activity, recent deals valued at approximately xx Million.
- End-User Demographics: Aging population driving demand for specialized products.
Bowel Management Systems Industry Market Dynamics & Trends
The bowel management systems market is experiencing significant growth, driven by factors such as the rising prevalence of chronic bowel diseases, increased healthcare expenditure, and the growing geriatric population. Technological advancements, such as the development of smart sensors and minimally invasive procedures, are further propelling market expansion. Changing consumer preferences toward improved comfort and ease of use are also influencing product development and market penetration. The market faces challenges from intense competition, pricing pressures, and the need for continuous innovation to maintain a competitive edge. Market penetration rates vary across different segments, with higher rates observed in developed countries compared to emerging economies. The market exhibits a projected CAGR of xx% during the forecast period.
Dominant Regions & Segments in Bowel Management Systems Industry
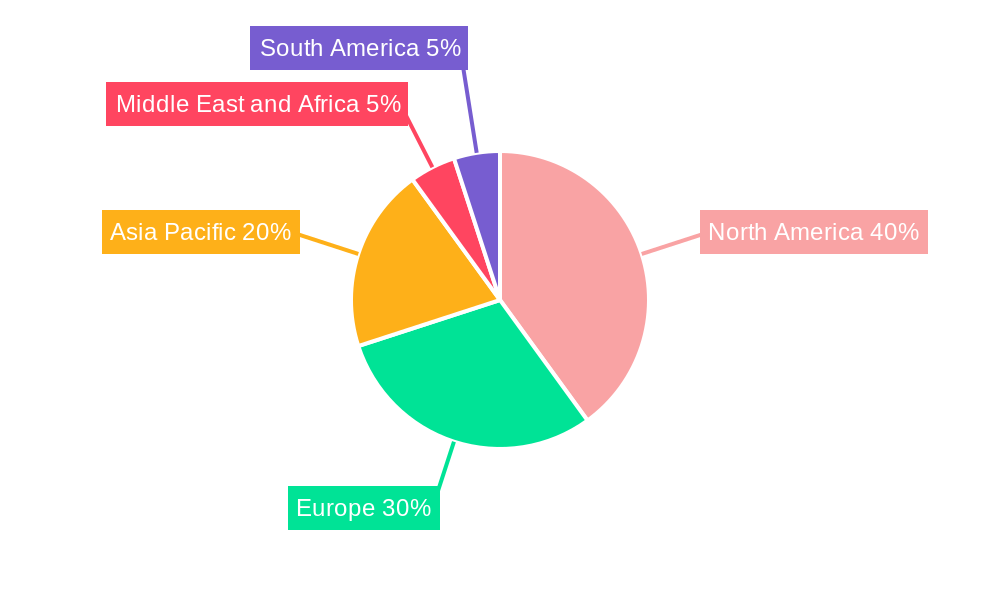
North America currently dominates the bowel management systems market, followed by Europe and Asia Pacific. This dominance is attributed to factors such as advanced healthcare infrastructure, higher healthcare expenditure, and increased awareness of bowel management solutions.
- Leading Region: North America
- Key Drivers (North America): Advanced healthcare infrastructure, high healthcare expenditure, strong regulatory framework.
- Leading Segment (End-User): Hospitals (owing to higher treatment volumes and specialized facilities).
- Leading Segment (Product): Colostomy Bags (due to their widespread use and relatively lower cost).
- Leading Segment (Patient Type): Adults (reflecting the higher prevalence of bowel disorders in the adult population).
Other regions, particularly in Asia Pacific, show strong growth potential, driven by increasing healthcare spending and rising prevalence of chronic diseases.
Bowel Management Systems Industry Product Innovations
Recent product innovations focus on enhancing patient comfort, improving ease of use, and reducing the incidence of complications associated with bowel management. Technological advances include the development of advanced materials for ostomy appliances, improved irrigation systems, and the introduction of minimally invasive nerve modulation devices. These innovations are driving market growth by catering to a broader range of patient needs and preferences. The focus is on providing discreet, convenient, and effective solutions, boosting market acceptance.
Report Scope & Segmentation Analysis
This report comprehensively segments the bowel management systems market based on end-user (Hospitals, Ambulatory Centers, Other End-Users), product type (Colostomy Bags, Irrigation Systems, Nerve Modulation Devices, Other Products), and patient type (Adults, Paediatric). Each segment’s market size, growth projections, and competitive dynamics are thoroughly analyzed, providing a granular understanding of the market landscape.
Key Drivers of Bowel Management Systems Industry Growth
The growth of the bowel management systems industry is fueled by several key factors, including: the rising prevalence of chronic bowel diseases such as Crohn's disease and ulcerative colitis, increased geriatric population requiring specialized care, technological advancements leading to improved product functionalities and patient outcomes, and growing healthcare expenditure globally. Stringent regulatory frameworks promote safety and efficacy, but also necessitate high investment in compliance.
Challenges in the Bowel Management Systems Industry Sector
The bowel management systems industry faces several challenges including stringent regulatory hurdles increasing development costs and timelines, complexities in global supply chains impacting product availability and cost, intense competition among established players and emerging entrants, and high costs associated with advanced products limiting accessibility for some patients. These factors can impact market growth and profitability.
Emerging Opportunities in Bowel Management Systems Industry
Emerging opportunities lie in the development of personalized medicine approaches to bowel management, expansion into underserved markets particularly in developing countries, integration of digital health technologies for remote patient monitoring and management, and exploration of novel therapies and devices to improve treatment outcomes. These trends offer significant potential for growth and innovation.
Leading Players in the Bowel Management Systems Industry Market
- Becton Dickinson and Company
- ABC Medical Supply Inc
- Cogentix Medical
- Consure Medical Pvt Ltd
- Coloplast Pty Ltd
- ConvaTec Group PLC
- Medtronic PLC
- Laborie Inc
- B Braun Melsungen AG
- Hollister Incorporated
Key Developments in Bowel Management Systems Industry
- February 2022: Coloplast launched the SenSura Mio in Singapore, improving ostomy management.
- April 2022: Microbiotica secured funding for inflammatory bowel disease therapies, indicating a shift towards innovative treatments.
Future Outlook for Bowel Management Systems Industry Market
The future of the bowel management systems market is promising, driven by ongoing technological advancements, increasing awareness of bowel health, and the rising prevalence of chronic bowel diseases. Strategic partnerships, focus on personalized medicine, and expansion into emerging markets are expected to drive market growth and create lucrative opportunities for industry players. Continued innovation in materials, design, and therapies will be crucial for maintaining a competitive edge.
Bowel Management Systems Industry Segmentation
-
1. Product
- 1.1. Colostomy Bags
- 1.2. Irrigation Systems
- 1.3. Nerve Modulation Devices
- 1.4. Other Products
-
2. Patient Type
- 2.1. Adults
- 2.2. Paediatric
-
3. End-User
- 3.1. Hospitals
- 3.2. Ambulatory Centers
- 3.3. Other End-Users
Bowel Management Systems Industry Segmentation By Geography
-
1. North America
- 1.1. United States
- 1.2. Canada
- 1.3. Mexico
-
2. Europe
- 2.1. Germany
- 2.2. United Kingdom
- 2.3. France
- 2.4. Italy
- 2.5. Spain
- 2.6. Rest of Europe
-
3. Asia Pacific
- 3.1. China
- 3.2. Japan
- 3.3. India
- 3.4. Australia
- 3.5. South Korea
- 3.6. Rest of Asia Pacific
-
4. Middle East and Africa
- 4.1. GCC
- 4.2. South Africa
- 4.3. Rest of Middle East and Africa
-
5. South America
- 5.1. Brazil
- 5.2. Argentina
- 5.3. Rest of South America
Bowel Management Systems Industry REPORT HIGHLIGHTS
| Aspects | Details |
|---|---|
| Study Period | 2019-2033 |
| Base Year | 2024 |
| Estimated Year | 2025 |
| Forecast Period | 2025-2033 |
| Historical Period | 2019-2024 |
| Growth Rate | CAGR of 3.30% from 2019-2033 |
| Segmentation |
|
Table of Contents
- 1. Introduction
- 1.1. Research Scope
- 1.2. Market Segmentation
- 1.3. Research Methodology
- 1.4. Definitions and Assumptions
- 2. Executive Summary
- 2.1. Introduction
- 3. Market Dynamics
- 3.1. Introduction
- 3.2. Market Drivers
- 3.2.1. High Incidence of Inflammatory Bowel Disease; Rising Geriatric Population
- 3.3. Market Restrains
- 3.3.1. Patient's Greater Preference for Non-invasive Treatment
- 3.4. Market Trends
- 3.4.1. Colostomy Bags Segment Expected to Witness Significant Growth over the Forecast Period
- 4. Market Factor Analysis
- 4.1. Porters Five Forces
- 4.2. Supply/Value Chain
- 4.3. PESTEL analysis
- 4.4. Market Entropy
- 4.5. Patent/Trademark Analysis
- 5. Global Bowel Management Systems Industry Analysis, Insights and Forecast, 2019-2031
- 5.1. Market Analysis, Insights and Forecast - by Product
- 5.1.1. Colostomy Bags
- 5.1.2. Irrigation Systems
- 5.1.3. Nerve Modulation Devices
- 5.1.4. Other Products
- 5.2. Market Analysis, Insights and Forecast - by Patient Type
- 5.2.1. Adults
- 5.2.2. Paediatric
- 5.3. Market Analysis, Insights and Forecast - by End-User
- 5.3.1. Hospitals
- 5.3.2. Ambulatory Centers
- 5.3.3. Other End-Users
- 5.4. Market Analysis, Insights and Forecast - by Region
- 5.4.1. North America
- 5.4.2. Europe
- 5.4.3. Asia Pacific
- 5.4.4. Middle East and Africa
- 5.4.5. South America
- 5.1. Market Analysis, Insights and Forecast - by Product
- 6. North America Bowel Management Systems Industry Analysis, Insights and Forecast, 2019-2031
- 6.1. Market Analysis, Insights and Forecast - by Product
- 6.1.1. Colostomy Bags
- 6.1.2. Irrigation Systems
- 6.1.3. Nerve Modulation Devices
- 6.1.4. Other Products
- 6.2. Market Analysis, Insights and Forecast - by Patient Type
- 6.2.1. Adults
- 6.2.2. Paediatric
- 6.3. Market Analysis, Insights and Forecast - by End-User
- 6.3.1. Hospitals
- 6.3.2. Ambulatory Centers
- 6.3.3. Other End-Users
- 6.1. Market Analysis, Insights and Forecast - by Product
- 7. Europe Bowel Management Systems Industry Analysis, Insights and Forecast, 2019-2031
- 7.1. Market Analysis, Insights and Forecast - by Product
- 7.1.1. Colostomy Bags
- 7.1.2. Irrigation Systems
- 7.1.3. Nerve Modulation Devices
- 7.1.4. Other Products
- 7.2. Market Analysis, Insights and Forecast - by Patient Type
- 7.2.1. Adults
- 7.2.2. Paediatric
- 7.3. Market Analysis, Insights and Forecast - by End-User
- 7.3.1. Hospitals
- 7.3.2. Ambulatory Centers
- 7.3.3. Other End-Users
- 7.1. Market Analysis, Insights and Forecast - by Product
- 8. Asia Pacific Bowel Management Systems Industry Analysis, Insights and Forecast, 2019-2031
- 8.1. Market Analysis, Insights and Forecast - by Product
- 8.1.1. Colostomy Bags
- 8.1.2. Irrigation Systems
- 8.1.3. Nerve Modulation Devices
- 8.1.4. Other Products
- 8.2. Market Analysis, Insights and Forecast - by Patient Type
- 8.2.1. Adults
- 8.2.2. Paediatric
- 8.3. Market Analysis, Insights and Forecast - by End-User
- 8.3.1. Hospitals
- 8.3.2. Ambulatory Centers
- 8.3.3. Other End-Users
- 8.1. Market Analysis, Insights and Forecast - by Product
- 9. Middle East and Africa Bowel Management Systems Industry Analysis, Insights and Forecast, 2019-2031
- 9.1. Market Analysis, Insights and Forecast - by Product
- 9.1.1. Colostomy Bags
- 9.1.2. Irrigation Systems
- 9.1.3. Nerve Modulation Devices
- 9.1.4. Other Products
- 9.2. Market Analysis, Insights and Forecast - by Patient Type
- 9.2.1. Adults
- 9.2.2. Paediatric
- 9.3. Market Analysis, Insights and Forecast - by End-User
- 9.3.1. Hospitals
- 9.3.2. Ambulatory Centers
- 9.3.3. Other End-Users
- 9.1. Market Analysis, Insights and Forecast - by Product
- 10. South America Bowel Management Systems Industry Analysis, Insights and Forecast, 2019-2031
- 10.1. Market Analysis, Insights and Forecast - by Product
- 10.1.1. Colostomy Bags
- 10.1.2. Irrigation Systems
- 10.1.3. Nerve Modulation Devices
- 10.1.4. Other Products
- 10.2. Market Analysis, Insights and Forecast - by Patient Type
- 10.2.1. Adults
- 10.2.2. Paediatric
- 10.3. Market Analysis, Insights and Forecast - by End-User
- 10.3.1. Hospitals
- 10.3.2. Ambulatory Centers
- 10.3.3. Other End-Users
- 10.1. Market Analysis, Insights and Forecast - by Product
- 11. North America Bowel Management Systems Industry Analysis, Insights and Forecast, 2019-2031
- 11.1. Market Analysis, Insights and Forecast - By Country/Sub-region
- 11.1.1. undefined
- 12. Europe Bowel Management Systems Industry Analysis, Insights and Forecast, 2019-2031
- 12.1. Market Analysis, Insights and Forecast - By Country/Sub-region
- 12.1.1. undefined
- 13. Asia Pacific Bowel Management Systems Industry Analysis, Insights and Forecast, 2019-2031
- 13.1. Market Analysis, Insights and Forecast - By Country/Sub-region
- 13.1.1. undefined
- 14. Middle East and Africa Bowel Management Systems Industry Analysis, Insights and Forecast, 2019-2031
- 14.1. Market Analysis, Insights and Forecast - By Country/Sub-region
- 14.1.1. undefined
- 15. South America Bowel Management Systems Industry Analysis, Insights and Forecast, 2019-2031
- 15.1. Market Analysis, Insights and Forecast - By Country/Sub-region
- 15.1.1. undefined
- 16. Competitive Analysis
- 16.1. Global Market Share Analysis 2024
- 16.2. Company Profiles
- 16.2.1 Becton Dickinson and Company
- 16.2.1.1. Overview
- 16.2.1.2. Products
- 16.2.1.3. SWOT Analysis
- 16.2.1.4. Recent Developments
- 16.2.1.5. Financials (Based on Availability)
- 16.2.2 ABC Medical Supply Inc
- 16.2.2.1. Overview
- 16.2.2.2. Products
- 16.2.2.3. SWOT Analysis
- 16.2.2.4. Recent Developments
- 16.2.2.5. Financials (Based on Availability)
- 16.2.3 Cogentix Medical
- 16.2.3.1. Overview
- 16.2.3.2. Products
- 16.2.3.3. SWOT Analysis
- 16.2.3.4. Recent Developments
- 16.2.3.5. Financials (Based on Availability)
- 16.2.4 Consure Medical Pvt Ltd
- 16.2.4.1. Overview
- 16.2.4.2. Products
- 16.2.4.3. SWOT Analysis
- 16.2.4.4. Recent Developments
- 16.2.4.5. Financials (Based on Availability)
- 16.2.5 Coloplast Pty Ltd
- 16.2.5.1. Overview
- 16.2.5.2. Products
- 16.2.5.3. SWOT Analysis
- 16.2.5.4. Recent Developments
- 16.2.5.5. Financials (Based on Availability)
- 16.2.6 ConvaTec Group PLC
- 16.2.6.1. Overview
- 16.2.6.2. Products
- 16.2.6.3. SWOT Analysis
- 16.2.6.4. Recent Developments
- 16.2.6.5. Financials (Based on Availability)
- 16.2.7 Medtronic PLC
- 16.2.7.1. Overview
- 16.2.7.2. Products
- 16.2.7.3. SWOT Analysis
- 16.2.7.4. Recent Developments
- 16.2.7.5. Financials (Based on Availability)
- 16.2.8 Laborie Inc
- 16.2.8.1. Overview
- 16.2.8.2. Products
- 16.2.8.3. SWOT Analysis
- 16.2.8.4. Recent Developments
- 16.2.8.5. Financials (Based on Availability)
- 16.2.9 B Braun Melsungen AG
- 16.2.9.1. Overview
- 16.2.9.2. Products
- 16.2.9.3. SWOT Analysis
- 16.2.9.4. Recent Developments
- 16.2.9.5. Financials (Based on Availability)
- 16.2.10 Hollister Incorporated
- 16.2.10.1. Overview
- 16.2.10.2. Products
- 16.2.10.3. SWOT Analysis
- 16.2.10.4. Recent Developments
- 16.2.10.5. Financials (Based on Availability)
- 16.2.1 Becton Dickinson and Company
List of Figures
- Figure 1: Global Bowel Management Systems Industry Revenue Breakdown (Million, %) by Region 2024 & 2032
- Figure 2: Global Bowel Management Systems Industry Volume Breakdown (K Unit, %) by Region 2024 & 2032
- Figure 3: North America Bowel Management Systems Industry Revenue (Million), by Country 2024 & 2032
- Figure 4: North America Bowel Management Systems Industry Volume (K Unit), by Country 2024 & 2032
- Figure 5: North America Bowel Management Systems Industry Revenue Share (%), by Country 2024 & 2032
- Figure 6: North America Bowel Management Systems Industry Volume Share (%), by Country 2024 & 2032
- Figure 7: Europe Bowel Management Systems Industry Revenue (Million), by Country 2024 & 2032
- Figure 8: Europe Bowel Management Systems Industry Volume (K Unit), by Country 2024 & 2032
- Figure 9: Europe Bowel Management Systems Industry Revenue Share (%), by Country 2024 & 2032
- Figure 10: Europe Bowel Management Systems Industry Volume Share (%), by Country 2024 & 2032
- Figure 11: Asia Pacific Bowel Management Systems Industry Revenue (Million), by Country 2024 & 2032
- Figure 12: Asia Pacific Bowel Management Systems Industry Volume (K Unit), by Country 2024 & 2032
- Figure 13: Asia Pacific Bowel Management Systems Industry Revenue Share (%), by Country 2024 & 2032
- Figure 14: Asia Pacific Bowel Management Systems Industry Volume Share (%), by Country 2024 & 2032
- Figure 15: Middle East and Africa Bowel Management Systems Industry Revenue (Million), by Country 2024 & 2032
- Figure 16: Middle East and Africa Bowel Management Systems Industry Volume (K Unit), by Country 2024 & 2032
- Figure 17: Middle East and Africa Bowel Management Systems Industry Revenue Share (%), by Country 2024 & 2032
- Figure 18: Middle East and Africa Bowel Management Systems Industry Volume Share (%), by Country 2024 & 2032
- Figure 19: South America Bowel Management Systems Industry Revenue (Million), by Country 2024 & 2032
- Figure 20: South America Bowel Management Systems Industry Volume (K Unit), by Country 2024 & 2032
- Figure 21: South America Bowel Management Systems Industry Revenue Share (%), by Country 2024 & 2032
- Figure 22: South America Bowel Management Systems Industry Volume Share (%), by Country 2024 & 2032
- Figure 23: North America Bowel Management Systems Industry Revenue (Million), by Product 2024 & 2032
- Figure 24: North America Bowel Management Systems Industry Volume (K Unit), by Product 2024 & 2032
- Figure 25: North America Bowel Management Systems Industry Revenue Share (%), by Product 2024 & 2032
- Figure 26: North America Bowel Management Systems Industry Volume Share (%), by Product 2024 & 2032
- Figure 27: North America Bowel Management Systems Industry Revenue (Million), by Patient Type 2024 & 2032
- Figure 28: North America Bowel Management Systems Industry Volume (K Unit), by Patient Type 2024 & 2032
- Figure 29: North America Bowel Management Systems Industry Revenue Share (%), by Patient Type 2024 & 2032
- Figure 30: North America Bowel Management Systems Industry Volume Share (%), by Patient Type 2024 & 2032
- Figure 31: North America Bowel Management Systems Industry Revenue (Million), by End-User 2024 & 2032
- Figure 32: North America Bowel Management Systems Industry Volume (K Unit), by End-User 2024 & 2032
- Figure 33: North America Bowel Management Systems Industry Revenue Share (%), by End-User 2024 & 2032
- Figure 34: North America Bowel Management Systems Industry Volume Share (%), by End-User 2024 & 2032
- Figure 35: North America Bowel Management Systems Industry Revenue (Million), by Country 2024 & 2032
- Figure 36: North America Bowel Management Systems Industry Volume (K Unit), by Country 2024 & 2032
- Figure 37: North America Bowel Management Systems Industry Revenue Share (%), by Country 2024 & 2032
- Figure 38: North America Bowel Management Systems Industry Volume Share (%), by Country 2024 & 2032
- Figure 39: Europe Bowel Management Systems Industry Revenue (Million), by Product 2024 & 2032
- Figure 40: Europe Bowel Management Systems Industry Volume (K Unit), by Product 2024 & 2032
- Figure 41: Europe Bowel Management Systems Industry Revenue Share (%), by Product 2024 & 2032
- Figure 42: Europe Bowel Management Systems Industry Volume Share (%), by Product 2024 & 2032
- Figure 43: Europe Bowel Management Systems Industry Revenue (Million), by Patient Type 2024 & 2032
- Figure 44: Europe Bowel Management Systems Industry Volume (K Unit), by Patient Type 2024 & 2032
- Figure 45: Europe Bowel Management Systems Industry Revenue Share (%), by Patient Type 2024 & 2032
- Figure 46: Europe Bowel Management Systems Industry Volume Share (%), by Patient Type 2024 & 2032
- Figure 47: Europe Bowel Management Systems Industry Revenue (Million), by End-User 2024 & 2032
- Figure 48: Europe Bowel Management Systems Industry Volume (K Unit), by End-User 2024 & 2032
- Figure 49: Europe Bowel Management Systems Industry Revenue Share (%), by End-User 2024 & 2032
- Figure 50: Europe Bowel Management Systems Industry Volume Share (%), by End-User 2024 & 2032
- Figure 51: Europe Bowel Management Systems Industry Revenue (Million), by Country 2024 & 2032
- Figure 52: Europe Bowel Management Systems Industry Volume (K Unit), by Country 2024 & 2032
- Figure 53: Europe Bowel Management Systems Industry Revenue Share (%), by Country 2024 & 2032
- Figure 54: Europe Bowel Management Systems Industry Volume Share (%), by Country 2024 & 2032
- Figure 55: Asia Pacific Bowel Management Systems Industry Revenue (Million), by Product 2024 & 2032
- Figure 56: Asia Pacific Bowel Management Systems Industry Volume (K Unit), by Product 2024 & 2032
- Figure 57: Asia Pacific Bowel Management Systems Industry Revenue Share (%), by Product 2024 & 2032
- Figure 58: Asia Pacific Bowel Management Systems Industry Volume Share (%), by Product 2024 & 2032
- Figure 59: Asia Pacific Bowel Management Systems Industry Revenue (Million), by Patient Type 2024 & 2032
- Figure 60: Asia Pacific Bowel Management Systems Industry Volume (K Unit), by Patient Type 2024 & 2032
- Figure 61: Asia Pacific Bowel Management Systems Industry Revenue Share (%), by Patient Type 2024 & 2032
- Figure 62: Asia Pacific Bowel Management Systems Industry Volume Share (%), by Patient Type 2024 & 2032
- Figure 63: Asia Pacific Bowel Management Systems Industry Revenue (Million), by End-User 2024 & 2032
- Figure 64: Asia Pacific Bowel Management Systems Industry Volume (K Unit), by End-User 2024 & 2032
- Figure 65: Asia Pacific Bowel Management Systems Industry Revenue Share (%), by End-User 2024 & 2032
- Figure 66: Asia Pacific Bowel Management Systems Industry Volume Share (%), by End-User 2024 & 2032
- Figure 67: Asia Pacific Bowel Management Systems Industry Revenue (Million), by Country 2024 & 2032
- Figure 68: Asia Pacific Bowel Management Systems Industry Volume (K Unit), by Country 2024 & 2032
- Figure 69: Asia Pacific Bowel Management Systems Industry Revenue Share (%), by Country 2024 & 2032
- Figure 70: Asia Pacific Bowel Management Systems Industry Volume Share (%), by Country 2024 & 2032
- Figure 71: Middle East and Africa Bowel Management Systems Industry Revenue (Million), by Product 2024 & 2032
- Figure 72: Middle East and Africa Bowel Management Systems Industry Volume (K Unit), by Product 2024 & 2032
- Figure 73: Middle East and Africa Bowel Management Systems Industry Revenue Share (%), by Product 2024 & 2032
- Figure 74: Middle East and Africa Bowel Management Systems Industry Volume Share (%), by Product 2024 & 2032
- Figure 75: Middle East and Africa Bowel Management Systems Industry Revenue (Million), by Patient Type 2024 & 2032
- Figure 76: Middle East and Africa Bowel Management Systems Industry Volume (K Unit), by Patient Type 2024 & 2032
- Figure 77: Middle East and Africa Bowel Management Systems Industry Revenue Share (%), by Patient Type 2024 & 2032
- Figure 78: Middle East and Africa Bowel Management Systems Industry Volume Share (%), by Patient Type 2024 & 2032
- Figure 79: Middle East and Africa Bowel Management Systems Industry Revenue (Million), by End-User 2024 & 2032
- Figure 80: Middle East and Africa Bowel Management Systems Industry Volume (K Unit), by End-User 2024 & 2032
- Figure 81: Middle East and Africa Bowel Management Systems Industry Revenue Share (%), by End-User 2024 & 2032
- Figure 82: Middle East and Africa Bowel Management Systems Industry Volume Share (%), by End-User 2024 & 2032
- Figure 83: Middle East and Africa Bowel Management Systems Industry Revenue (Million), by Country 2024 & 2032
- Figure 84: Middle East and Africa Bowel Management Systems Industry Volume (K Unit), by Country 2024 & 2032
- Figure 85: Middle East and Africa Bowel Management Systems Industry Revenue Share (%), by Country 2024 & 2032
- Figure 86: Middle East and Africa Bowel Management Systems Industry Volume Share (%), by Country 2024 & 2032
- Figure 87: South America Bowel Management Systems Industry Revenue (Million), by Product 2024 & 2032
- Figure 88: South America Bowel Management Systems Industry Volume (K Unit), by Product 2024 & 2032
- Figure 89: South America Bowel Management Systems Industry Revenue Share (%), by Product 2024 & 2032
- Figure 90: South America Bowel Management Systems Industry Volume Share (%), by Product 2024 & 2032
- Figure 91: South America Bowel Management Systems Industry Revenue (Million), by Patient Type 2024 & 2032
- Figure 92: South America Bowel Management Systems Industry Volume (K Unit), by Patient Type 2024 & 2032
- Figure 93: South America Bowel Management Systems Industry Revenue Share (%), by Patient Type 2024 & 2032
- Figure 94: South America Bowel Management Systems Industry Volume Share (%), by Patient Type 2024 & 2032
- Figure 95: South America Bowel Management Systems Industry Revenue (Million), by End-User 2024 & 2032
- Figure 96: South America Bowel Management Systems Industry Volume (K Unit), by End-User 2024 & 2032
- Figure 97: South America Bowel Management Systems Industry Revenue Share (%), by End-User 2024 & 2032
- Figure 98: South America Bowel Management Systems Industry Volume Share (%), by End-User 2024 & 2032
- Figure 99: South America Bowel Management Systems Industry Revenue (Million), by Country 2024 & 2032
- Figure 100: South America Bowel Management Systems Industry Volume (K Unit), by Country 2024 & 2032
- Figure 101: South America Bowel Management Systems Industry Revenue Share (%), by Country 2024 & 2032
- Figure 102: South America Bowel Management Systems Industry Volume Share (%), by Country 2024 & 2032
List of Tables
- Table 1: Global Bowel Management Systems Industry Revenue Million Forecast, by Region 2019 & 2032
- Table 2: Global Bowel Management Systems Industry Volume K Unit Forecast, by Region 2019 & 2032
- Table 3: Global Bowel Management Systems Industry Revenue Million Forecast, by Product 2019 & 2032
- Table 4: Global Bowel Management Systems Industry Volume K Unit Forecast, by Product 2019 & 2032
- Table 5: Global Bowel Management Systems Industry Revenue Million Forecast, by Patient Type 2019 & 2032
- Table 6: Global Bowel Management Systems Industry Volume K Unit Forecast, by Patient Type 2019 & 2032
- Table 7: Global Bowel Management Systems Industry Revenue Million Forecast, by End-User 2019 & 2032
- Table 8: Global Bowel Management Systems Industry Volume K Unit Forecast, by End-User 2019 & 2032
- Table 9: Global Bowel Management Systems Industry Revenue Million Forecast, by Region 2019 & 2032
- Table 10: Global Bowel Management Systems Industry Volume K Unit Forecast, by Region 2019 & 2032
- Table 11: Global Bowel Management Systems Industry Revenue Million Forecast, by Country 2019 & 2032
- Table 12: Global Bowel Management Systems Industry Volume K Unit Forecast, by Country 2019 & 2032
- Table 13: Global Bowel Management Systems Industry Revenue Million Forecast, by Country 2019 & 2032
- Table 14: Global Bowel Management Systems Industry Volume K Unit Forecast, by Country 2019 & 2032
- Table 15: Global Bowel Management Systems Industry Revenue Million Forecast, by Country 2019 & 2032
- Table 16: Global Bowel Management Systems Industry Volume K Unit Forecast, by Country 2019 & 2032
- Table 17: Global Bowel Management Systems Industry Revenue Million Forecast, by Country 2019 & 2032
- Table 18: Global Bowel Management Systems Industry Volume K Unit Forecast, by Country 2019 & 2032
- Table 19: Global Bowel Management Systems Industry Revenue Million Forecast, by Country 2019 & 2032
- Table 20: Global Bowel Management Systems Industry Volume K Unit Forecast, by Country 2019 & 2032
- Table 21: Global Bowel Management Systems Industry Revenue Million Forecast, by Product 2019 & 2032
- Table 22: Global Bowel Management Systems Industry Volume K Unit Forecast, by Product 2019 & 2032
- Table 23: Global Bowel Management Systems Industry Revenue Million Forecast, by Patient Type 2019 & 2032
- Table 24: Global Bowel Management Systems Industry Volume K Unit Forecast, by Patient Type 2019 & 2032
- Table 25: Global Bowel Management Systems Industry Revenue Million Forecast, by End-User 2019 & 2032
- Table 26: Global Bowel Management Systems Industry Volume K Unit Forecast, by End-User 2019 & 2032
- Table 27: Global Bowel Management Systems Industry Revenue Million Forecast, by Country 2019 & 2032
- Table 28: Global Bowel Management Systems Industry Volume K Unit Forecast, by Country 2019 & 2032
- Table 29: United States Bowel Management Systems Industry Revenue (Million) Forecast, by Application 2019 & 2032
- Table 30: United States Bowel Management Systems Industry Volume (K Unit) Forecast, by Application 2019 & 2032
- Table 31: Canada Bowel Management Systems Industry Revenue (Million) Forecast, by Application 2019 & 2032
- Table 32: Canada Bowel Management Systems Industry Volume (K Unit) Forecast, by Application 2019 & 2032
- Table 33: Mexico Bowel Management Systems Industry Revenue (Million) Forecast, by Application 2019 & 2032
- Table 34: Mexico Bowel Management Systems Industry Volume (K Unit) Forecast, by Application 2019 & 2032
- Table 35: Global Bowel Management Systems Industry Revenue Million Forecast, by Product 2019 & 2032
- Table 36: Global Bowel Management Systems Industry Volume K Unit Forecast, by Product 2019 & 2032
- Table 37: Global Bowel Management Systems Industry Revenue Million Forecast, by Patient Type 2019 & 2032
- Table 38: Global Bowel Management Systems Industry Volume K Unit Forecast, by Patient Type 2019 & 2032
- Table 39: Global Bowel Management Systems Industry Revenue Million Forecast, by End-User 2019 & 2032
- Table 40: Global Bowel Management Systems Industry Volume K Unit Forecast, by End-User 2019 & 2032
- Table 41: Global Bowel Management Systems Industry Revenue Million Forecast, by Country 2019 & 2032
- Table 42: Global Bowel Management Systems Industry Volume K Unit Forecast, by Country 2019 & 2032
- Table 43: Germany Bowel Management Systems Industry Revenue (Million) Forecast, by Application 2019 & 2032
- Table 44: Germany Bowel Management Systems Industry Volume (K Unit) Forecast, by Application 2019 & 2032
- Table 45: United Kingdom Bowel Management Systems Industry Revenue (Million) Forecast, by Application 2019 & 2032
- Table 46: United Kingdom Bowel Management Systems Industry Volume (K Unit) Forecast, by Application 2019 & 2032
- Table 47: France Bowel Management Systems Industry Revenue (Million) Forecast, by Application 2019 & 2032
- Table 48: France Bowel Management Systems Industry Volume (K Unit) Forecast, by Application 2019 & 2032
- Table 49: Italy Bowel Management Systems Industry Revenue (Million) Forecast, by Application 2019 & 2032
- Table 50: Italy Bowel Management Systems Industry Volume (K Unit) Forecast, by Application 2019 & 2032
- Table 51: Spain Bowel Management Systems Industry Revenue (Million) Forecast, by Application 2019 & 2032
- Table 52: Spain Bowel Management Systems Industry Volume (K Unit) Forecast, by Application 2019 & 2032
- Table 53: Rest of Europe Bowel Management Systems Industry Revenue (Million) Forecast, by Application 2019 & 2032
- Table 54: Rest of Europe Bowel Management Systems Industry Volume (K Unit) Forecast, by Application 2019 & 2032
- Table 55: Global Bowel Management Systems Industry Revenue Million Forecast, by Product 2019 & 2032
- Table 56: Global Bowel Management Systems Industry Volume K Unit Forecast, by Product 2019 & 2032
- Table 57: Global Bowel Management Systems Industry Revenue Million Forecast, by Patient Type 2019 & 2032
- Table 58: Global Bowel Management Systems Industry Volume K Unit Forecast, by Patient Type 2019 & 2032
- Table 59: Global Bowel Management Systems Industry Revenue Million Forecast, by End-User 2019 & 2032
- Table 60: Global Bowel Management Systems Industry Volume K Unit Forecast, by End-User 2019 & 2032
- Table 61: Global Bowel Management Systems Industry Revenue Million Forecast, by Country 2019 & 2032
- Table 62: Global Bowel Management Systems Industry Volume K Unit Forecast, by Country 2019 & 2032
- Table 63: China Bowel Management Systems Industry Revenue (Million) Forecast, by Application 2019 & 2032
- Table 64: China Bowel Management Systems Industry Volume (K Unit) Forecast, by Application 2019 & 2032
- Table 65: Japan Bowel Management Systems Industry Revenue (Million) Forecast, by Application 2019 & 2032
- Table 66: Japan Bowel Management Systems Industry Volume (K Unit) Forecast, by Application 2019 & 2032
- Table 67: India Bowel Management Systems Industry Revenue (Million) Forecast, by Application 2019 & 2032
- Table 68: India Bowel Management Systems Industry Volume (K Unit) Forecast, by Application 2019 & 2032
- Table 69: Australia Bowel Management Systems Industry Revenue (Million) Forecast, by Application 2019 & 2032
- Table 70: Australia Bowel Management Systems Industry Volume (K Unit) Forecast, by Application 2019 & 2032
- Table 71: South Korea Bowel Management Systems Industry Revenue (Million) Forecast, by Application 2019 & 2032
- Table 72: South Korea Bowel Management Systems Industry Volume (K Unit) Forecast, by Application 2019 & 2032
- Table 73: Rest of Asia Pacific Bowel Management Systems Industry Revenue (Million) Forecast, by Application 2019 & 2032
- Table 74: Rest of Asia Pacific Bowel Management Systems Industry Volume (K Unit) Forecast, by Application 2019 & 2032
- Table 75: Global Bowel Management Systems Industry Revenue Million Forecast, by Product 2019 & 2032
- Table 76: Global Bowel Management Systems Industry Volume K Unit Forecast, by Product 2019 & 2032
- Table 77: Global Bowel Management Systems Industry Revenue Million Forecast, by Patient Type 2019 & 2032
- Table 78: Global Bowel Management Systems Industry Volume K Unit Forecast, by Patient Type 2019 & 2032
- Table 79: Global Bowel Management Systems Industry Revenue Million Forecast, by End-User 2019 & 2032
- Table 80: Global Bowel Management Systems Industry Volume K Unit Forecast, by End-User 2019 & 2032
- Table 81: Global Bowel Management Systems Industry Revenue Million Forecast, by Country 2019 & 2032
- Table 82: Global Bowel Management Systems Industry Volume K Unit Forecast, by Country 2019 & 2032
- Table 83: GCC Bowel Management Systems Industry Revenue (Million) Forecast, by Application 2019 & 2032
- Table 84: GCC Bowel Management Systems Industry Volume (K Unit) Forecast, by Application 2019 & 2032
- Table 85: South Africa Bowel Management Systems Industry Revenue (Million) Forecast, by Application 2019 & 2032
- Table 86: South Africa Bowel Management Systems Industry Volume (K Unit) Forecast, by Application 2019 & 2032
- Table 87: Rest of Middle East and Africa Bowel Management Systems Industry Revenue (Million) Forecast, by Application 2019 & 2032
- Table 88: Rest of Middle East and Africa Bowel Management Systems Industry Volume (K Unit) Forecast, by Application 2019 & 2032
- Table 89: Global Bowel Management Systems Industry Revenue Million Forecast, by Product 2019 & 2032
- Table 90: Global Bowel Management Systems Industry Volume K Unit Forecast, by Product 2019 & 2032
- Table 91: Global Bowel Management Systems Industry Revenue Million Forecast, by Patient Type 2019 & 2032
- Table 92: Global Bowel Management Systems Industry Volume K Unit Forecast, by Patient Type 2019 & 2032
- Table 93: Global Bowel Management Systems Industry Revenue Million Forecast, by End-User 2019 & 2032
- Table 94: Global Bowel Management Systems Industry Volume K Unit Forecast, by End-User 2019 & 2032
- Table 95: Global Bowel Management Systems Industry Revenue Million Forecast, by Country 2019 & 2032
- Table 96: Global Bowel Management Systems Industry Volume K Unit Forecast, by Country 2019 & 2032
- Table 97: Brazil Bowel Management Systems Industry Revenue (Million) Forecast, by Application 2019 & 2032
- Table 98: Brazil Bowel Management Systems Industry Volume (K Unit) Forecast, by Application 2019 & 2032
- Table 99: Argentina Bowel Management Systems Industry Revenue (Million) Forecast, by Application 2019 & 2032
- Table 100: Argentina Bowel Management Systems Industry Volume (K Unit) Forecast, by Application 2019 & 2032
- Table 101: Rest of South America Bowel Management Systems Industry Revenue (Million) Forecast, by Application 2019 & 2032
- Table 102: Rest of South America Bowel Management Systems Industry Volume (K Unit) Forecast, by Application 2019 & 2032
Frequently Asked Questions
1. What is the projected Compound Annual Growth Rate (CAGR) of the Bowel Management Systems Industry?
The projected CAGR is approximately 3.30%.
2. Which companies are prominent players in the Bowel Management Systems Industry?
Key companies in the market include Becton Dickinson and Company, ABC Medical Supply Inc, Cogentix Medical, Consure Medical Pvt Ltd, Coloplast Pty Ltd, ConvaTec Group PLC, Medtronic PLC, Laborie Inc , B Braun Melsungen AG, Hollister Incorporated.
3. What are the main segments of the Bowel Management Systems Industry?
The market segments include Product, Patient Type, End-User.
4. Can you provide details about the market size?
The market size is estimated to be USD XX Million as of 2022.
5. What are some drivers contributing to market growth?
High Incidence of Inflammatory Bowel Disease; Rising Geriatric Population.
6. What are the notable trends driving market growth?
Colostomy Bags Segment Expected to Witness Significant Growth over the Forecast Period.
7. Are there any restraints impacting market growth?
Patient's Greater Preference for Non-invasive Treatment.
8. Can you provide examples of recent developments in the market?
April 2022: Microbiotica received project funding from the Crohn's and Colitis Foundation as a part of their inflammatory bowel disease ventures program for the development of therapies to treat inflammatory bowel disease.
9. What pricing options are available for accessing the report?
Pricing options include single-user, multi-user, and enterprise licenses priced at USD 4750, USD 5250, and USD 8750 respectively.
10. Is the market size provided in terms of value or volume?
The market size is provided in terms of value, measured in Million and volume, measured in K Unit.
11. Are there any specific market keywords associated with the report?
Yes, the market keyword associated with the report is "Bowel Management Systems Industry," which aids in identifying and referencing the specific market segment covered.
12. How do I determine which pricing option suits my needs best?
The pricing options vary based on user requirements and access needs. Individual users may opt for single-user licenses, while businesses requiring broader access may choose multi-user or enterprise licenses for cost-effective access to the report.
13. Are there any additional resources or data provided in the Bowel Management Systems Industry report?
While the report offers comprehensive insights, it's advisable to review the specific contents or supplementary materials provided to ascertain if additional resources or data are available.
14. How can I stay updated on further developments or reports in the Bowel Management Systems Industry?
To stay informed about further developments, trends, and reports in the Bowel Management Systems Industry, consider subscribing to industry newsletters, following relevant companies and organizations, or regularly checking reputable industry news sources and publications.
Methodology
Step 1 - Identification of Relevant Samples Size from Population Database


Step 2 - Approaches for Defining Global Market Size (Value, Volume* & Price*)

Note*: In applicable scenarios
Step 3 - Data Sources
Primary Research
- Web Analytics
- Survey Reports
- Research Institute
- Latest Research Reports
- Opinion Leaders
Secondary Research
- Annual Reports
- White Paper
- Latest Press Release
- Industry Association
- Paid Database
- Investor Presentations

Step 4 - Data Triangulation
Involves using different sources of information in order to increase the validity of a study
These sources are likely to be stakeholders in a program - participants, other researchers, program staff, other community members, and so on.
Then we put all data in single framework & apply various statistical tools to find out the dynamic on the market.
During the analysis stage, feedback from the stakeholder groups would be compared to determine areas of agreement as well as areas of divergence


