
Key Insights
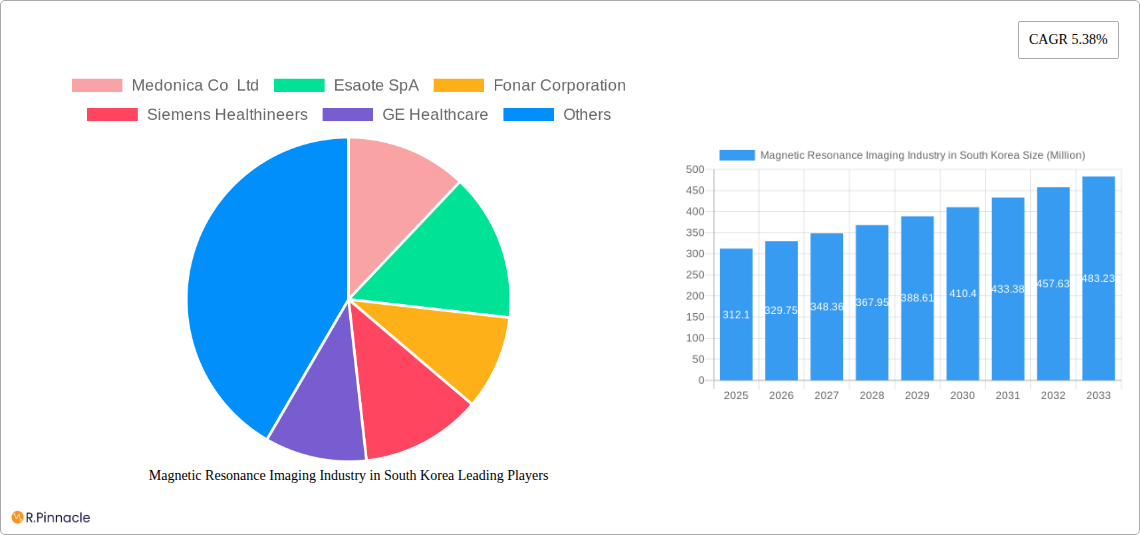
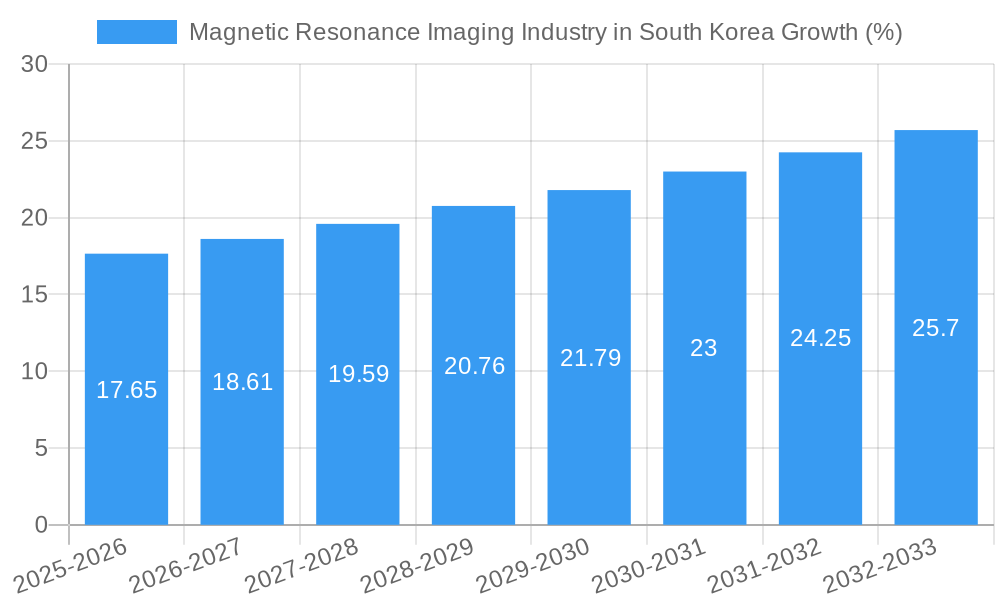
The South Korean Magnetic Resonance Imaging (MRI) market, valued at $312.10 million in 2025, is projected to experience robust growth, driven by factors such as increasing prevalence of chronic diseases necessitating advanced diagnostic tools, rising healthcare expenditure, and technological advancements leading to improved image quality and faster scan times. The market's Compound Annual Growth Rate (CAGR) of 5.38% from 2019-2024 suggests a sustained demand for MRI systems across various applications. This growth is further fueled by government initiatives promoting advanced healthcare infrastructure and increasing adoption of minimally invasive procedures which often require precise MRI-guided interventions. The segmentation reveals a significant market share held by high-field MRI systems, reflecting a preference for superior image resolution and diagnostic capabilities. Key players like Samsung Medison, Siemens Healthineers, and GE Healthcare are strategically investing in research and development, focusing on innovative technologies like artificial intelligence-powered image analysis and improved patient comfort features to maintain a competitive edge. The ongoing expansion of private healthcare facilities and increasing insurance coverage also contribute positively to market growth.
Looking ahead to 2033, the South Korean MRI market is expected to continue its upward trajectory, driven by the aging population and an increasing prevalence of neurological and cardiovascular diseases. The demand for open MRI systems, which are particularly beneficial for claustrophobic patients and pediatric cases, is also projected to rise. However, the market might face challenges related to high equipment costs, stringent regulatory approvals, and the need for skilled radiologists and technicians. Despite these restraints, the long-term outlook for the South Korean MRI market remains optimistic, with continued technological innovation and supportive government policies paving the way for substantial growth. The focus on specialized applications like oncology and neurology will also significantly contribute to the market's expansion, especially with the increasing emphasis on early diagnosis and personalized treatment.
Magnetic Resonance Imaging (MRI) Industry in South Korea: A Comprehensive Market Report (2019-2033)
This in-depth report provides a comprehensive analysis of the Magnetic Resonance Imaging (MRI) industry in South Korea, offering valuable insights for industry professionals, investors, and strategic decision-makers. The report covers the period 2019-2033, with a base year of 2025 and a forecast period of 2025-2033. It leverages extensive market data to provide actionable intelligence and strategic recommendations. The South Korean MRI market is segmented by architecture (Closed and Open MRI Systems), field strength (Low, High, Very High, and Ultra-high Field MRI Systems), and application (Oncology, Neurology, Cardiology, Gastroenterology, Musculoskeletal, and Other Applications). Key players analyzed include Medonica Co Ltd, Esaote SpA, Fonar Corporation, Siemens Healthineers, GE Healthcare, Neusoft Medical Systems Co Ltd, Koninklijke Philips NV, Canon Medical Systems Corporation, and Fujifilm Holdings Corporation. The report projects a market value of xx Million by 2033.
Magnetic Resonance Imaging Industry in South Korea Market Structure & Innovation Trends
This section analyzes the competitive landscape, innovation drivers, and regulatory environment of the South Korean MRI market. Market concentration is assessed, revealing the market share held by major players. The report examines the impact of mergers and acquisitions (M&A) activities, including deal values, on market dynamics. Innovation drivers, such as technological advancements and government initiatives, are explored. The regulatory framework governing the MRI industry in South Korea is analyzed, including its influence on market growth and product development. Furthermore, the report investigates the presence and impact of product substitutes and analyzes end-user demographics impacting market demand.
- Market Concentration: The market is moderately concentrated, with the top 5 players holding approximately xx% of the market share in 2024.
- M&A Activity: The report details significant M&A deals, including deal values and their implications for the market. For example, while specific deal values aren't readily available for all M&A activities in this sector, the report includes estimates and analysis of their impact. A predicted total M&A deal value for the period 2019-2024 is estimated at xx Million.
- Innovation Drivers: Key drivers include advancements in MRI technology, such as higher field strength systems and AI-powered image analysis, and government support for healthcare infrastructure development.
- Regulatory Framework: The report details the key regulations impacting the MRI market in South Korea, including those related to medical device approval and reimbursement policies.
Magnetic Resonance Imaging Industry in South Korea Market Dynamics & Trends
This section delves into the market's growth trajectory, technological disruptions, consumer preferences, and competitive dynamics. The report identifies key growth drivers, such as rising prevalence of chronic diseases and increasing healthcare expenditure. It also analyzes technological disruptions, including the adoption of AI and advanced imaging techniques. Consumer preferences influencing demand for specific MRI systems are examined. The competitive dynamics are analyzed, including pricing strategies, product differentiation, and market positioning of key players. The report provides insights into the Compound Annual Growth Rate (CAGR) and market penetration rates for various MRI segments. The predicted CAGR for the forecast period (2025-2033) is estimated at xx%. Market penetration of high-field MRI systems is projected to increase from xx% in 2024 to xx% in 2033.
Dominant Regions & Segments in Magnetic Resonance Imaging Industry in South Korea
This section identifies the leading regions and segments within the South Korean MRI market. Detailed analysis is provided for each segment (architecture, field strength, and application), highlighting factors contributing to their dominance.
Dominant Segments:
- Architecture: Closed MRI systems are expected to retain the largest market share due to higher image quality and established clinical practice.
- Field Strength: High-field MRI systems (1.5T and 3.0T) are projected to dominate due to their superior image resolution and clinical capabilities.
- Application: Oncology and neurology are currently the largest application segments, driven by increasing incidence rates of related diseases.
Key Drivers for Dominant Segments:
- Economic Policies: Government investment in healthcare infrastructure and supportive reimbursement policies drive market growth.
- Infrastructure: The presence of well-established healthcare facilities and skilled medical professionals contributes to the market's expansion.
Magnetic Resonance Imaging Industry in South Korea Product Innovations
Recent product developments in the South Korean MRI market reflect a trend towards higher field strength systems, improved image quality, and more efficient workflows. Manufacturers are increasingly incorporating AI and machine learning capabilities into their systems to enhance diagnostic accuracy and reduce examination times. These innovations are designed to cater to the growing demand for advanced imaging solutions and improve clinical outcomes. The market sees a competitive landscape with players focused on differentiated features and value propositions.
Report Scope & Segmentation Analysis
This report segments the South Korean MRI market by architecture (Closed and Open MRI Systems), field strength (Low, High, Very High, and Ultra-high Field MRI Systems), and application (Oncology, Neurology, Cardiology, Gastroenterology, Musculoskeletal, and Other Applications). Each segment's growth projections, market size (in Million USD), and competitive dynamics are detailed within the report. For example, the closed MRI systems segment is expected to witness a xx% CAGR during the forecast period, driven by its widespread adoption across various healthcare settings.
Key Drivers of Magnetic Resonance Imaging Industry in South Korea Growth
The South Korean MRI market's growth is fueled by several key factors. Rising prevalence of chronic diseases like cancer and neurological disorders increases the demand for diagnostic imaging. Technological advancements leading to improved image quality, faster scan times, and advanced functionalities contribute significantly. Government initiatives promoting healthcare infrastructure development and supportive reimbursement policies also stimulate market expansion.
Challenges in the Magnetic Resonance Imaging Industry in South Korea Sector
The South Korean MRI market faces challenges, including high capital investment costs for advanced systems, reimbursement policies impacting affordability, and intense competition among various players. Supply chain disruptions can also impact the availability and cost of MRI equipment and related consumables. Regulatory hurdles and stringent approval processes can slow down product launches and market penetration. These factors collectively impact overall market growth, leading to potential bottlenecks in the sector's expansion.
Emerging Opportunities in Magnetic Resonance Imaging Industry in South Korea
The South Korean MRI market presents significant opportunities. The increasing adoption of AI and machine learning in MRI technology offers potential for improved diagnostic accuracy and efficiency. Growth in the private healthcare sector creates new market avenues for advanced imaging services. Furthermore, the development of new applications, such as functional MRI (fMRI) and diffusion tensor imaging (DTI), presents expansion prospects.
Leading Players in the Magnetic Resonance Imaging Industry in South Korea Market
- Medonica Co Ltd
- Esaote SpA
- Fonar Corporation
- Siemens Healthineers
- GE Healthcare
- Neusoft Medical Systems Co Ltd
- Koninklijke Philips NV
- Canon Medical Systems Corporation
- Fujifilm Holdings Corporation
Key Developments in Magnetic Resonance Imaging Industry in South Korea Industry
- August 2022: AIRS Medical secures USD 20 Million in Series B funding. This signals investor confidence in the South Korean healthcare technology sector and indicates potential for further innovation and market expansion.
- February 2021: Elektra launches its next-generation 1.5T MRI device, Unity, in South Korea. This launch signifies ongoing technological advancements in the MRI market and increased competition.
Future Outlook for Magnetic Resonance Imaging Industry in South Korea Market
The future of the South Korean MRI market is promising, driven by continuous technological innovation, increasing healthcare expenditure, and growing awareness of advanced diagnostic capabilities. Strategic partnerships, product diversification, and expansion into new application areas are key growth accelerators for market players. The market is poised for robust growth, driven by favorable demographics, technological advancements, and government support for healthcare infrastructure. The market is projected to experience significant growth in the coming years, with continued demand for high-field MRI systems and advanced imaging techniques.
Magnetic Resonance Imaging Industry in South Korea Segmentation
-
1. Architecture
- 1.1. Closed MRI Systems
- 1.2. Open MRI Systems
-
2. Field Strength
- 2.1. Low Field MRI Systems
- 2.2. High Field MRI Systems
- 2.3. Very Hig
-
3. Application
- 3.1. Oncology
- 3.2. Neurology
- 3.3. Cardiology
- 3.4. Gastroenterology
- 3.5. Musculoskeletal
- 3.6. Other Applications
Magnetic Resonance Imaging Industry in South Korea Segmentation By Geography
-
1. North America
- 1.1. United States
- 1.2. Canada
- 1.3. Mexico
-
2. South America
- 2.1. Brazil
- 2.2. Argentina
- 2.3. Rest of South America
-
3. Europe
- 3.1. United Kingdom
- 3.2. Germany
- 3.3. France
- 3.4. Italy
- 3.5. Spain
- 3.6. Russia
- 3.7. Benelux
- 3.8. Nordics
- 3.9. Rest of Europe
-
4. Middle East & Africa
- 4.1. Turkey
- 4.2. Israel
- 4.3. GCC
- 4.4. North Africa
- 4.5. South Africa
- 4.6. Rest of Middle East & Africa
-
5. Asia Pacific
- 5.1. China
- 5.2. India
- 5.3. Japan
- 5.4. South Korea
- 5.5. ASEAN
- 5.6. Oceania
- 5.7. Rest of Asia Pacific
Magnetic Resonance Imaging Industry in South Korea REPORT HIGHLIGHTS
| Aspects | Details |
|---|---|
| Study Period | 2019-2033 |
| Base Year | 2024 |
| Estimated Year | 2025 |
| Forecast Period | 2025-2033 |
| Historical Period | 2019-2024 |
| Growth Rate | CAGR of 5.38% from 2019-2033 |
| Segmentation |
|
Table of Contents
- 1. Introduction
- 1.1. Research Scope
- 1.2. Market Segmentation
- 1.3. Research Methodology
- 1.4. Definitions and Assumptions
- 2. Executive Summary
- 2.1. Introduction
- 3. Market Dynamics
- 3.1. Introduction
- 3.2. Market Drivers
- 3.2.1. Introduction of Hybrid MRI Systems; Increasing Prevalence of Chronic Diseases and Rising Geriatric Population
- 3.3. Market Restrains
- 3.3.1. High Cost of MRI Systems
- 3.4. Market Trends
- 3.4.1. High-Field MRI Systems are Expected to Witness Healthy Growth Over the Forecast Period
- 4. Market Factor Analysis
- 4.1. Porters Five Forces
- 4.2. Supply/Value Chain
- 4.3. PESTEL analysis
- 4.4. Market Entropy
- 4.5. Patent/Trademark Analysis
- 5. Global Magnetic Resonance Imaging Industry in South Korea Analysis, Insights and Forecast, 2019-2031
- 5.1. Market Analysis, Insights and Forecast - by Architecture
- 5.1.1. Closed MRI Systems
- 5.1.2. Open MRI Systems
- 5.2. Market Analysis, Insights and Forecast - by Field Strength
- 5.2.1. Low Field MRI Systems
- 5.2.2. High Field MRI Systems
- 5.2.3. Very Hig
- 5.3. Market Analysis, Insights and Forecast - by Application
- 5.3.1. Oncology
- 5.3.2. Neurology
- 5.3.3. Cardiology
- 5.3.4. Gastroenterology
- 5.3.5. Musculoskeletal
- 5.3.6. Other Applications
- 5.4. Market Analysis, Insights and Forecast - by Region
- 5.4.1. North America
- 5.4.2. South America
- 5.4.3. Europe
- 5.4.4. Middle East & Africa
- 5.4.5. Asia Pacific
- 5.1. Market Analysis, Insights and Forecast - by Architecture
- 6. North America Magnetic Resonance Imaging Industry in South Korea Analysis, Insights and Forecast, 2019-2031
- 6.1. Market Analysis, Insights and Forecast - by Architecture
- 6.1.1. Closed MRI Systems
- 6.1.2. Open MRI Systems
- 6.2. Market Analysis, Insights and Forecast - by Field Strength
- 6.2.1. Low Field MRI Systems
- 6.2.2. High Field MRI Systems
- 6.2.3. Very Hig
- 6.3. Market Analysis, Insights and Forecast - by Application
- 6.3.1. Oncology
- 6.3.2. Neurology
- 6.3.3. Cardiology
- 6.3.4. Gastroenterology
- 6.3.5. Musculoskeletal
- 6.3.6. Other Applications
- 6.1. Market Analysis, Insights and Forecast - by Architecture
- 7. South America Magnetic Resonance Imaging Industry in South Korea Analysis, Insights and Forecast, 2019-2031
- 7.1. Market Analysis, Insights and Forecast - by Architecture
- 7.1.1. Closed MRI Systems
- 7.1.2. Open MRI Systems
- 7.2. Market Analysis, Insights and Forecast - by Field Strength
- 7.2.1. Low Field MRI Systems
- 7.2.2. High Field MRI Systems
- 7.2.3. Very Hig
- 7.3. Market Analysis, Insights and Forecast - by Application
- 7.3.1. Oncology
- 7.3.2. Neurology
- 7.3.3. Cardiology
- 7.3.4. Gastroenterology
- 7.3.5. Musculoskeletal
- 7.3.6. Other Applications
- 7.1. Market Analysis, Insights and Forecast - by Architecture
- 8. Europe Magnetic Resonance Imaging Industry in South Korea Analysis, Insights and Forecast, 2019-2031
- 8.1. Market Analysis, Insights and Forecast - by Architecture
- 8.1.1. Closed MRI Systems
- 8.1.2. Open MRI Systems
- 8.2. Market Analysis, Insights and Forecast - by Field Strength
- 8.2.1. Low Field MRI Systems
- 8.2.2. High Field MRI Systems
- 8.2.3. Very Hig
- 8.3. Market Analysis, Insights and Forecast - by Application
- 8.3.1. Oncology
- 8.3.2. Neurology
- 8.3.3. Cardiology
- 8.3.4. Gastroenterology
- 8.3.5. Musculoskeletal
- 8.3.6. Other Applications
- 8.1. Market Analysis, Insights and Forecast - by Architecture
- 9. Middle East & Africa Magnetic Resonance Imaging Industry in South Korea Analysis, Insights and Forecast, 2019-2031
- 9.1. Market Analysis, Insights and Forecast - by Architecture
- 9.1.1. Closed MRI Systems
- 9.1.2. Open MRI Systems
- 9.2. Market Analysis, Insights and Forecast - by Field Strength
- 9.2.1. Low Field MRI Systems
- 9.2.2. High Field MRI Systems
- 9.2.3. Very Hig
- 9.3. Market Analysis, Insights and Forecast - by Application
- 9.3.1. Oncology
- 9.3.2. Neurology
- 9.3.3. Cardiology
- 9.3.4. Gastroenterology
- 9.3.5. Musculoskeletal
- 9.3.6. Other Applications
- 9.1. Market Analysis, Insights and Forecast - by Architecture
- 10. Asia Pacific Magnetic Resonance Imaging Industry in South Korea Analysis, Insights and Forecast, 2019-2031
- 10.1. Market Analysis, Insights and Forecast - by Architecture
- 10.1.1. Closed MRI Systems
- 10.1.2. Open MRI Systems
- 10.2. Market Analysis, Insights and Forecast - by Field Strength
- 10.2.1. Low Field MRI Systems
- 10.2.2. High Field MRI Systems
- 10.2.3. Very Hig
- 10.3. Market Analysis, Insights and Forecast - by Application
- 10.3.1. Oncology
- 10.3.2. Neurology
- 10.3.3. Cardiology
- 10.3.4. Gastroenterology
- 10.3.5. Musculoskeletal
- 10.3.6. Other Applications
- 10.1. Market Analysis, Insights and Forecast - by Architecture
- 11. Competitive Analysis
- 11.1. Global Market Share Analysis 2024
- 11.2. Company Profiles
- 11.2.1 Medonica Co Ltd
- 11.2.1.1. Overview
- 11.2.1.2. Products
- 11.2.1.3. SWOT Analysis
- 11.2.1.4. Recent Developments
- 11.2.1.5. Financials (Based on Availability)
- 11.2.2 Esaote SpA
- 11.2.2.1. Overview
- 11.2.2.2. Products
- 11.2.2.3. SWOT Analysis
- 11.2.2.4. Recent Developments
- 11.2.2.5. Financials (Based on Availability)
- 11.2.3 Fonar Corporation
- 11.2.3.1. Overview
- 11.2.3.2. Products
- 11.2.3.3. SWOT Analysis
- 11.2.3.4. Recent Developments
- 11.2.3.5. Financials (Based on Availability)
- 11.2.4 Siemens Healthineers
- 11.2.4.1. Overview
- 11.2.4.2. Products
- 11.2.4.3. SWOT Analysis
- 11.2.4.4. Recent Developments
- 11.2.4.5. Financials (Based on Availability)
- 11.2.5 GE Healthcare
- 11.2.5.1. Overview
- 11.2.5.2. Products
- 11.2.5.3. SWOT Analysis
- 11.2.5.4. Recent Developments
- 11.2.5.5. Financials (Based on Availability)
- 11.2.6 Neusoft Medical Systems Co Ltd
- 11.2.6.1. Overview
- 11.2.6.2. Products
- 11.2.6.3. SWOT Analysis
- 11.2.6.4. Recent Developments
- 11.2.6.5. Financials (Based on Availability)
- 11.2.7 Koninklijke Philips NV
- 11.2.7.1. Overview
- 11.2.7.2. Products
- 11.2.7.3. SWOT Analysis
- 11.2.7.4. Recent Developments
- 11.2.7.5. Financials (Based on Availability)
- 11.2.8 Canon Medical Systems Corporation
- 11.2.8.1. Overview
- 11.2.8.2. Products
- 11.2.8.3. SWOT Analysis
- 11.2.8.4. Recent Developments
- 11.2.8.5. Financials (Based on Availability)
- 11.2.9 Fujifilm Holdings Corporation
- 11.2.9.1. Overview
- 11.2.9.2. Products
- 11.2.9.3. SWOT Analysis
- 11.2.9.4. Recent Developments
- 11.2.9.5. Financials (Based on Availability)
- 11.2.1 Medonica Co Ltd
List of Figures
- Figure 1: Global Magnetic Resonance Imaging Industry in South Korea Revenue Breakdown (Million, %) by Region 2024 & 2032
- Figure 2: South Korea Magnetic Resonance Imaging Industry in South Korea Revenue (Million), by Country 2024 & 2032
- Figure 3: South Korea Magnetic Resonance Imaging Industry in South Korea Revenue Share (%), by Country 2024 & 2032
- Figure 4: North America Magnetic Resonance Imaging Industry in South Korea Revenue (Million), by Architecture 2024 & 2032
- Figure 5: North America Magnetic Resonance Imaging Industry in South Korea Revenue Share (%), by Architecture 2024 & 2032
- Figure 6: North America Magnetic Resonance Imaging Industry in South Korea Revenue (Million), by Field Strength 2024 & 2032
- Figure 7: North America Magnetic Resonance Imaging Industry in South Korea Revenue Share (%), by Field Strength 2024 & 2032
- Figure 8: North America Magnetic Resonance Imaging Industry in South Korea Revenue (Million), by Application 2024 & 2032
- Figure 9: North America Magnetic Resonance Imaging Industry in South Korea Revenue Share (%), by Application 2024 & 2032
- Figure 10: North America Magnetic Resonance Imaging Industry in South Korea Revenue (Million), by Country 2024 & 2032
- Figure 11: North America Magnetic Resonance Imaging Industry in South Korea Revenue Share (%), by Country 2024 & 2032
- Figure 12: South America Magnetic Resonance Imaging Industry in South Korea Revenue (Million), by Architecture 2024 & 2032
- Figure 13: South America Magnetic Resonance Imaging Industry in South Korea Revenue Share (%), by Architecture 2024 & 2032
- Figure 14: South America Magnetic Resonance Imaging Industry in South Korea Revenue (Million), by Field Strength 2024 & 2032
- Figure 15: South America Magnetic Resonance Imaging Industry in South Korea Revenue Share (%), by Field Strength 2024 & 2032
- Figure 16: South America Magnetic Resonance Imaging Industry in South Korea Revenue (Million), by Application 2024 & 2032
- Figure 17: South America Magnetic Resonance Imaging Industry in South Korea Revenue Share (%), by Application 2024 & 2032
- Figure 18: South America Magnetic Resonance Imaging Industry in South Korea Revenue (Million), by Country 2024 & 2032
- Figure 19: South America Magnetic Resonance Imaging Industry in South Korea Revenue Share (%), by Country 2024 & 2032
- Figure 20: Europe Magnetic Resonance Imaging Industry in South Korea Revenue (Million), by Architecture 2024 & 2032
- Figure 21: Europe Magnetic Resonance Imaging Industry in South Korea Revenue Share (%), by Architecture 2024 & 2032
- Figure 22: Europe Magnetic Resonance Imaging Industry in South Korea Revenue (Million), by Field Strength 2024 & 2032
- Figure 23: Europe Magnetic Resonance Imaging Industry in South Korea Revenue Share (%), by Field Strength 2024 & 2032
- Figure 24: Europe Magnetic Resonance Imaging Industry in South Korea Revenue (Million), by Application 2024 & 2032
- Figure 25: Europe Magnetic Resonance Imaging Industry in South Korea Revenue Share (%), by Application 2024 & 2032
- Figure 26: Europe Magnetic Resonance Imaging Industry in South Korea Revenue (Million), by Country 2024 & 2032
- Figure 27: Europe Magnetic Resonance Imaging Industry in South Korea Revenue Share (%), by Country 2024 & 2032
- Figure 28: Middle East & Africa Magnetic Resonance Imaging Industry in South Korea Revenue (Million), by Architecture 2024 & 2032
- Figure 29: Middle East & Africa Magnetic Resonance Imaging Industry in South Korea Revenue Share (%), by Architecture 2024 & 2032
- Figure 30: Middle East & Africa Magnetic Resonance Imaging Industry in South Korea Revenue (Million), by Field Strength 2024 & 2032
- Figure 31: Middle East & Africa Magnetic Resonance Imaging Industry in South Korea Revenue Share (%), by Field Strength 2024 & 2032
- Figure 32: Middle East & Africa Magnetic Resonance Imaging Industry in South Korea Revenue (Million), by Application 2024 & 2032
- Figure 33: Middle East & Africa Magnetic Resonance Imaging Industry in South Korea Revenue Share (%), by Application 2024 & 2032
- Figure 34: Middle East & Africa Magnetic Resonance Imaging Industry in South Korea Revenue (Million), by Country 2024 & 2032
- Figure 35: Middle East & Africa Magnetic Resonance Imaging Industry in South Korea Revenue Share (%), by Country 2024 & 2032
- Figure 36: Asia Pacific Magnetic Resonance Imaging Industry in South Korea Revenue (Million), by Architecture 2024 & 2032
- Figure 37: Asia Pacific Magnetic Resonance Imaging Industry in South Korea Revenue Share (%), by Architecture 2024 & 2032
- Figure 38: Asia Pacific Magnetic Resonance Imaging Industry in South Korea Revenue (Million), by Field Strength 2024 & 2032
- Figure 39: Asia Pacific Magnetic Resonance Imaging Industry in South Korea Revenue Share (%), by Field Strength 2024 & 2032
- Figure 40: Asia Pacific Magnetic Resonance Imaging Industry in South Korea Revenue (Million), by Application 2024 & 2032
- Figure 41: Asia Pacific Magnetic Resonance Imaging Industry in South Korea Revenue Share (%), by Application 2024 & 2032
- Figure 42: Asia Pacific Magnetic Resonance Imaging Industry in South Korea Revenue (Million), by Country 2024 & 2032
- Figure 43: Asia Pacific Magnetic Resonance Imaging Industry in South Korea Revenue Share (%), by Country 2024 & 2032
List of Tables
- Table 1: Global Magnetic Resonance Imaging Industry in South Korea Revenue Million Forecast, by Region 2019 & 2032
- Table 2: Global Magnetic Resonance Imaging Industry in South Korea Revenue Million Forecast, by Architecture 2019 & 2032
- Table 3: Global Magnetic Resonance Imaging Industry in South Korea Revenue Million Forecast, by Field Strength 2019 & 2032
- Table 4: Global Magnetic Resonance Imaging Industry in South Korea Revenue Million Forecast, by Application 2019 & 2032
- Table 5: Global Magnetic Resonance Imaging Industry in South Korea Revenue Million Forecast, by Region 2019 & 2032
- Table 6: Global Magnetic Resonance Imaging Industry in South Korea Revenue Million Forecast, by Country 2019 & 2032
- Table 7: Global Magnetic Resonance Imaging Industry in South Korea Revenue Million Forecast, by Architecture 2019 & 2032
- Table 8: Global Magnetic Resonance Imaging Industry in South Korea Revenue Million Forecast, by Field Strength 2019 & 2032
- Table 9: Global Magnetic Resonance Imaging Industry in South Korea Revenue Million Forecast, by Application 2019 & 2032
- Table 10: Global Magnetic Resonance Imaging Industry in South Korea Revenue Million Forecast, by Country 2019 & 2032
- Table 11: United States Magnetic Resonance Imaging Industry in South Korea Revenue (Million) Forecast, by Application 2019 & 2032
- Table 12: Canada Magnetic Resonance Imaging Industry in South Korea Revenue (Million) Forecast, by Application 2019 & 2032
- Table 13: Mexico Magnetic Resonance Imaging Industry in South Korea Revenue (Million) Forecast, by Application 2019 & 2032
- Table 14: Global Magnetic Resonance Imaging Industry in South Korea Revenue Million Forecast, by Architecture 2019 & 2032
- Table 15: Global Magnetic Resonance Imaging Industry in South Korea Revenue Million Forecast, by Field Strength 2019 & 2032
- Table 16: Global Magnetic Resonance Imaging Industry in South Korea Revenue Million Forecast, by Application 2019 & 2032
- Table 17: Global Magnetic Resonance Imaging Industry in South Korea Revenue Million Forecast, by Country 2019 & 2032
- Table 18: Brazil Magnetic Resonance Imaging Industry in South Korea Revenue (Million) Forecast, by Application 2019 & 2032
- Table 19: Argentina Magnetic Resonance Imaging Industry in South Korea Revenue (Million) Forecast, by Application 2019 & 2032
- Table 20: Rest of South America Magnetic Resonance Imaging Industry in South Korea Revenue (Million) Forecast, by Application 2019 & 2032
- Table 21: Global Magnetic Resonance Imaging Industry in South Korea Revenue Million Forecast, by Architecture 2019 & 2032
- Table 22: Global Magnetic Resonance Imaging Industry in South Korea Revenue Million Forecast, by Field Strength 2019 & 2032
- Table 23: Global Magnetic Resonance Imaging Industry in South Korea Revenue Million Forecast, by Application 2019 & 2032
- Table 24: Global Magnetic Resonance Imaging Industry in South Korea Revenue Million Forecast, by Country 2019 & 2032
- Table 25: United Kingdom Magnetic Resonance Imaging Industry in South Korea Revenue (Million) Forecast, by Application 2019 & 2032
- Table 26: Germany Magnetic Resonance Imaging Industry in South Korea Revenue (Million) Forecast, by Application 2019 & 2032
- Table 27: France Magnetic Resonance Imaging Industry in South Korea Revenue (Million) Forecast, by Application 2019 & 2032
- Table 28: Italy Magnetic Resonance Imaging Industry in South Korea Revenue (Million) Forecast, by Application 2019 & 2032
- Table 29: Spain Magnetic Resonance Imaging Industry in South Korea Revenue (Million) Forecast, by Application 2019 & 2032
- Table 30: Russia Magnetic Resonance Imaging Industry in South Korea Revenue (Million) Forecast, by Application 2019 & 2032
- Table 31: Benelux Magnetic Resonance Imaging Industry in South Korea Revenue (Million) Forecast, by Application 2019 & 2032
- Table 32: Nordics Magnetic Resonance Imaging Industry in South Korea Revenue (Million) Forecast, by Application 2019 & 2032
- Table 33: Rest of Europe Magnetic Resonance Imaging Industry in South Korea Revenue (Million) Forecast, by Application 2019 & 2032
- Table 34: Global Magnetic Resonance Imaging Industry in South Korea Revenue Million Forecast, by Architecture 2019 & 2032
- Table 35: Global Magnetic Resonance Imaging Industry in South Korea Revenue Million Forecast, by Field Strength 2019 & 2032
- Table 36: Global Magnetic Resonance Imaging Industry in South Korea Revenue Million Forecast, by Application 2019 & 2032
- Table 37: Global Magnetic Resonance Imaging Industry in South Korea Revenue Million Forecast, by Country 2019 & 2032
- Table 38: Turkey Magnetic Resonance Imaging Industry in South Korea Revenue (Million) Forecast, by Application 2019 & 2032
- Table 39: Israel Magnetic Resonance Imaging Industry in South Korea Revenue (Million) Forecast, by Application 2019 & 2032
- Table 40: GCC Magnetic Resonance Imaging Industry in South Korea Revenue (Million) Forecast, by Application 2019 & 2032
- Table 41: North Africa Magnetic Resonance Imaging Industry in South Korea Revenue (Million) Forecast, by Application 2019 & 2032
- Table 42: South Africa Magnetic Resonance Imaging Industry in South Korea Revenue (Million) Forecast, by Application 2019 & 2032
- Table 43: Rest of Middle East & Africa Magnetic Resonance Imaging Industry in South Korea Revenue (Million) Forecast, by Application 2019 & 2032
- Table 44: Global Magnetic Resonance Imaging Industry in South Korea Revenue Million Forecast, by Architecture 2019 & 2032
- Table 45: Global Magnetic Resonance Imaging Industry in South Korea Revenue Million Forecast, by Field Strength 2019 & 2032
- Table 46: Global Magnetic Resonance Imaging Industry in South Korea Revenue Million Forecast, by Application 2019 & 2032
- Table 47: Global Magnetic Resonance Imaging Industry in South Korea Revenue Million Forecast, by Country 2019 & 2032
- Table 48: China Magnetic Resonance Imaging Industry in South Korea Revenue (Million) Forecast, by Application 2019 & 2032
- Table 49: India Magnetic Resonance Imaging Industry in South Korea Revenue (Million) Forecast, by Application 2019 & 2032
- Table 50: Japan Magnetic Resonance Imaging Industry in South Korea Revenue (Million) Forecast, by Application 2019 & 2032
- Table 51: South Korea Magnetic Resonance Imaging Industry in South Korea Revenue (Million) Forecast, by Application 2019 & 2032
- Table 52: ASEAN Magnetic Resonance Imaging Industry in South Korea Revenue (Million) Forecast, by Application 2019 & 2032
- Table 53: Oceania Magnetic Resonance Imaging Industry in South Korea Revenue (Million) Forecast, by Application 2019 & 2032
- Table 54: Rest of Asia Pacific Magnetic Resonance Imaging Industry in South Korea Revenue (Million) Forecast, by Application 2019 & 2032
Frequently Asked Questions
1. What is the projected Compound Annual Growth Rate (CAGR) of the Magnetic Resonance Imaging Industry in South Korea?
The projected CAGR is approximately 5.38%.
2. Which companies are prominent players in the Magnetic Resonance Imaging Industry in South Korea?
Key companies in the market include Medonica Co Ltd, Esaote SpA, Fonar Corporation, Siemens Healthineers, GE Healthcare, Neusoft Medical Systems Co Ltd, Koninklijke Philips NV, Canon Medical Systems Corporation, Fujifilm Holdings Corporation.
3. What are the main segments of the Magnetic Resonance Imaging Industry in South Korea?
The market segments include Architecture, Field Strength, Application.
4. Can you provide details about the market size?
The market size is estimated to be USD 312.10 Million as of 2022.
5. What are some drivers contributing to market growth?
Introduction of Hybrid MRI Systems; Increasing Prevalence of Chronic Diseases and Rising Geriatric Population.
6. What are the notable trends driving market growth?
High-Field MRI Systems are Expected to Witness Healthy Growth Over the Forecast Period.
7. Are there any restraints impacting market growth?
High Cost of MRI Systems.
8. Can you provide examples of recent developments in the market?
In August 2022, South Korea-based healthcare start-up AIRS Medical has secured around USD 20 million in a Series B funding round that included existing investor Klim Ventures.
9. What pricing options are available for accessing the report?
Pricing options include single-user, multi-user, and enterprise licenses priced at USD 3800, USD 4500, and USD 5800 respectively.
10. Is the market size provided in terms of value or volume?
The market size is provided in terms of value, measured in Million.
11. Are there any specific market keywords associated with the report?
Yes, the market keyword associated with the report is "Magnetic Resonance Imaging Industry in South Korea," which aids in identifying and referencing the specific market segment covered.
12. How do I determine which pricing option suits my needs best?
The pricing options vary based on user requirements and access needs. Individual users may opt for single-user licenses, while businesses requiring broader access may choose multi-user or enterprise licenses for cost-effective access to the report.
13. Are there any additional resources or data provided in the Magnetic Resonance Imaging Industry in South Korea report?
While the report offers comprehensive insights, it's advisable to review the specific contents or supplementary materials provided to ascertain if additional resources or data are available.
14. How can I stay updated on further developments or reports in the Magnetic Resonance Imaging Industry in South Korea?
To stay informed about further developments, trends, and reports in the Magnetic Resonance Imaging Industry in South Korea, consider subscribing to industry newsletters, following relevant companies and organizations, or regularly checking reputable industry news sources and publications.
Methodology
Step 1 - Identification of Relevant Samples Size from Population Database


Step 2 - Approaches for Defining Global Market Size (Value, Volume* & Price*)

Note*: In applicable scenarios
Step 3 - Data Sources
Primary Research
- Web Analytics
- Survey Reports
- Research Institute
- Latest Research Reports
- Opinion Leaders
Secondary Research
- Annual Reports
- White Paper
- Latest Press Release
- Industry Association
- Paid Database
- Investor Presentations

Step 4 - Data Triangulation
Involves using different sources of information in order to increase the validity of a study
These sources are likely to be stakeholders in a program - participants, other researchers, program staff, other community members, and so on.
Then we put all data in single framework & apply various statistical tools to find out the dynamic on the market.
During the analysis stage, feedback from the stakeholder groups would be compared to determine areas of agreement as well as areas of divergence


