
Key Insights
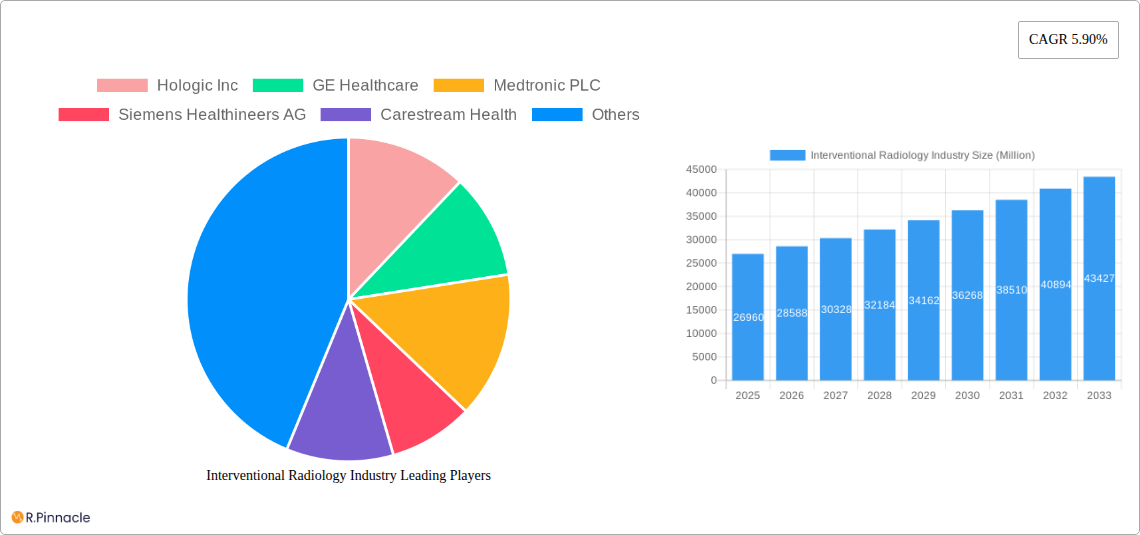
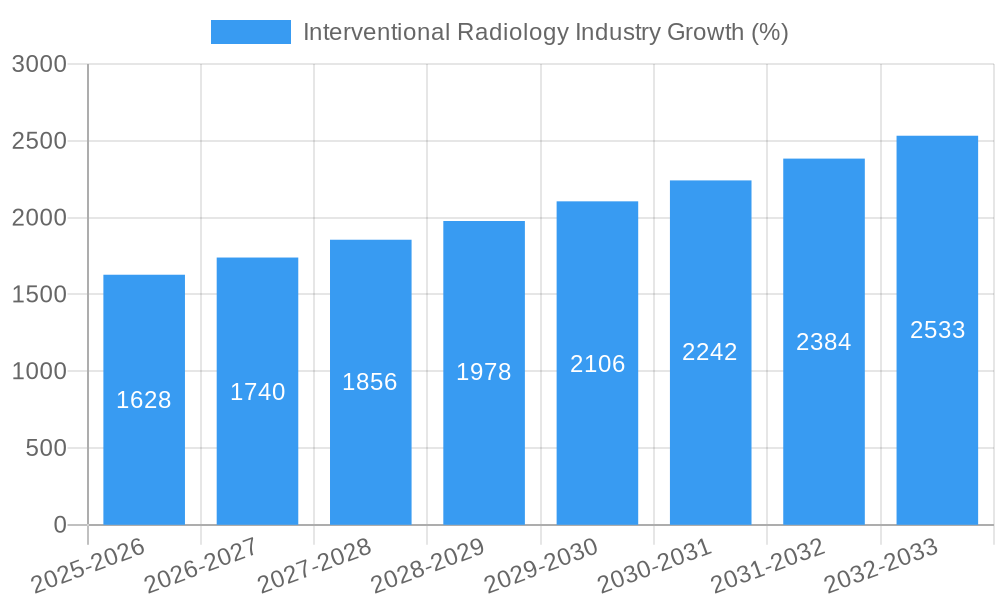
The interventional radiology market, valued at $26.96 billion in 2025, is poised for robust growth, projected to expand at a compound annual growth rate (CAGR) of 5.90% from 2025 to 2033. This expansion is driven by several key factors. Technological advancements in imaging systems, such as MRI, CT scanners, and ultrasound, are enabling minimally invasive procedures, leading to shorter recovery times and improved patient outcomes. The aging global population, coupled with an increasing prevalence of chronic diseases like cardiovascular ailments and cancer, fuels the demand for interventional radiology procedures. Furthermore, the rising adoption of advanced imaging techniques like angiography and fluoroscopy, along with sophisticated biopsy devices, contributes significantly to market growth. A growing preference for outpatient procedures and a shift towards value-based healthcare further bolster market expansion. However, challenges such as high equipment costs, stringent regulatory approvals, and the need for skilled professionals can potentially restrain growth.
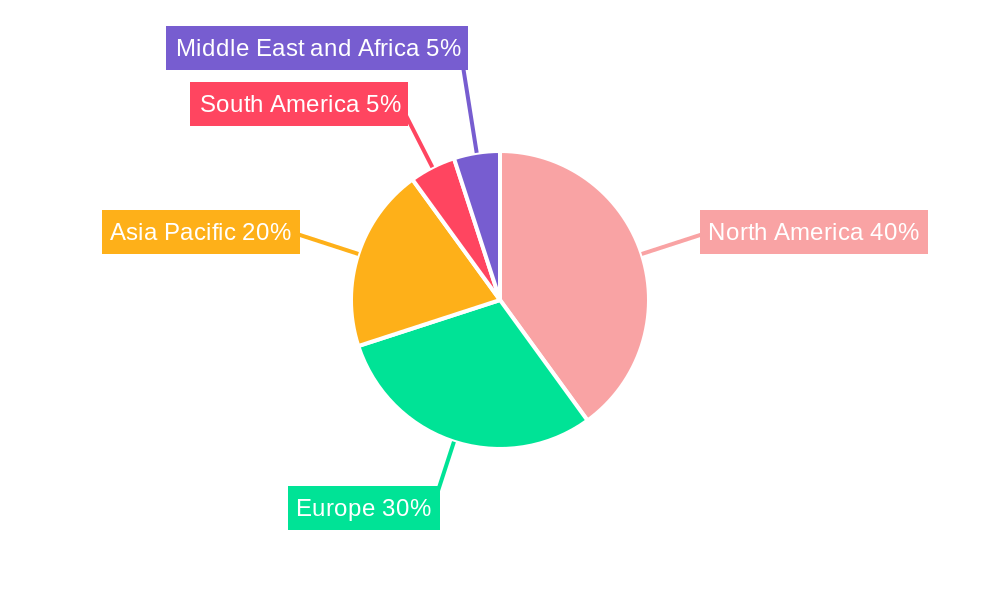
Geographic distribution reveals a concentration of market share in developed regions such as North America and Europe, driven by advanced healthcare infrastructure and higher per capita healthcare expenditure. However, rapidly developing economies in Asia Pacific, particularly China and India, are witnessing significant growth owing to increasing healthcare investments and rising awareness about minimally invasive procedures. The market segmentation reflects a strong demand for various products, including MRI systems, ultrasound imaging systems, and angiography systems, across multiple applications, with cardiology, oncology, and gastroenterology representing prominent segments. Competitive landscape analysis highlights the presence of key players such as GE Healthcare, Siemens Healthineers, and Philips, which are continuously investing in research and development to maintain their market position and launch innovative products. This competitive landscape ensures continuous innovation and enhances the overall quality and affordability of interventional radiology services globally.
Interventional Radiology Industry Market Report: 2019-2033
This comprehensive report provides a detailed analysis of the Interventional Radiology industry, encompassing market size, growth projections, key players, technological advancements, and future outlook. The study period covers 2019-2033, with a base year of 2025 and a forecast period of 2025-2033. This report is essential for industry professionals, investors, and strategic decision-makers seeking actionable insights into this dynamic market. The global market is projected to reach xx Million by 2033.
Interventional Radiology Industry Market Structure & Innovation Trends
The Interventional Radiology market is characterized by a moderately concentrated structure, with several multinational corporations holding significant market share. Key players such as GE Healthcare, Medtronic PLC, Siemens Healthineers AG, and Koninklijke Philips NV dominate the landscape. However, smaller, specialized companies are also contributing significantly through innovation and niche applications.
- Market Share: GE Healthcare holds an estimated 18% market share in 2025, followed by Medtronic PLC with 15%, and Siemens Healthineers AG with 12%. The remaining share is distributed among other players including Hologic Inc., Carestream Health, Canon Medical Systems Corporation, Cook Medical, Esaote SPA, Shimadzu Corporation, Samsung Medison (Samsung Electronics Co Ltd), and Fujifilm Holdings Corporation.
- Innovation Drivers: Technological advancements, including AI-powered image analysis, minimally invasive procedures, and robotic-assisted surgery are major drivers of market growth. Regulatory approvals for new devices and procedures also contribute to expansion.
- M&A Activity: The industry has witnessed considerable M&A activity in recent years, with deal values exceeding xx Million in the period 2019-2024, primarily focused on acquiring smaller companies with specialized technologies. This consolidation strengthens market players and expands their product portfolios.
- Regulatory Frameworks: Stringent regulatory approvals for medical devices and procedures create a high barrier to entry but also ensure patient safety and product efficacy. Compliance with these regulations is crucial for market participation.
- Product Substitutes: While no direct substitutes exist for interventional radiology procedures, alternative treatment modalities, such as open surgery, might influence market growth depending on specific applications.
- End-User Demographics: The aging global population, along with the increasing prevalence of chronic diseases, drives a higher demand for interventional radiology services.
Interventional Radiology Industry Market Dynamics & Trends
The Interventional Radiology market is experiencing robust growth, driven by several key factors. Technological advancements, particularly in image guidance systems and minimally invasive procedures, are significantly enhancing the precision and efficacy of interventions, leading to improved patient outcomes and reduced recovery times. The increasing prevalence of chronic diseases like cardiovascular disease, cancer, and neurological disorders fuels demand for these procedures.
Market growth is further propelled by the rising adoption of advanced imaging technologies, such as MRI, CT, and ultrasound, which provide detailed anatomical information for precise targeting during interventions. Government initiatives to improve healthcare infrastructure and expand access to advanced medical technologies also contribute significantly to market expansion. The increasing preference for minimally invasive procedures over traditional open surgery due to reduced trauma, shorter hospital stays, and faster recovery times is another significant factor.
The competitive landscape is dynamic, with existing players focusing on innovation, strategic partnerships, and acquisitions to expand their market share and product portfolios. Technological disruptions, especially the integration of artificial intelligence and machine learning in image analysis and treatment planning, are reshaping the market dynamics. The CAGR for the Interventional Radiology market is estimated at xx% during the forecast period (2025-2033), with market penetration in developed economies nearing saturation while emerging markets offering substantial growth opportunities.
Dominant Regions & Segments in Interventional Radiology Industry
North America currently dominates the Interventional Radiology market, followed by Europe and Asia-Pacific. The dominance of North America is attributed to factors including high healthcare expenditure, advanced medical infrastructure, and a significant number of specialized centers.
Key Drivers for North America:
- High healthcare expenditure
- Advanced medical infrastructure
- High adoption of advanced imaging and treatment technologies
- Strong presence of key market players
- Favorable regulatory environment
Dominant Product Segments: Angiography Systems and Ultrasound Imaging Systems currently hold the largest market share among product segments, due to their widespread use in various interventional radiology procedures. However, the Biopsy Devices segment is expected to experience significant growth due to advancements in minimally invasive biopsy techniques and increasing demand.
Dominant Application Segments: Cardiology and Oncology represent the largest application segments, driven by the prevalence of cardiovascular diseases and cancer. However, Gastroenterology and Urology and Nephrology are also showing substantial growth potential.
Interventional Radiology Industry Product Innovations
Recent years have witnessed significant product innovations in the Interventional Radiology industry, with a strong focus on enhancing image quality, improving procedural precision, and minimizing invasiveness. The introduction of AI-powered image analysis tools is automating image interpretation and improving diagnostic accuracy. Robotic-assisted systems are increasing the precision and control of interventional procedures, leading to better patient outcomes. Miniaturized devices are allowing access to previously difficult-to-reach anatomical locations, expanding treatment options. These innovations are improving the overall efficiency and efficacy of interventional radiology procedures, attracting wider adoption, and enhancing market penetration.
Report Scope & Segmentation Analysis
This report comprehensively segments the Interventional Radiology market by product (MRI Systems, Ultrasound Imaging Systems, CT Scanners, Angiography Systems, Fluoroscopy Systems, Biopsy Devices, Other Products) and application (Cardiology, Urology and Nephrology, Oncology, Gastroenterology, Other Applications). Each segment is analyzed based on market size, growth projections, and competitive landscape. Growth projections for each segment are based on extensive market research and analysis of current trends and future potential. The report provides detailed competitive analysis for each segment, highlighting key players, market share, and competitive strategies.
Key Drivers of Interventional Radiology Industry Growth
Several factors contribute to the robust growth of the Interventional Radiology industry. Technological advancements, such as AI-powered image analysis and minimally invasive devices, are improving procedure efficacy and patient outcomes. The increasing prevalence of chronic diseases necessitates more interventional procedures. Government initiatives supporting healthcare infrastructure development and investments in advanced medical technologies further boost market expansion. Moreover, the rising preference for minimally invasive interventions over open surgeries, due to shorter recovery times and reduced trauma, significantly fuels market demand.
Challenges in the Interventional Radiology Industry Sector
The Interventional Radiology industry faces several challenges. Stringent regulatory approvals for new devices and procedures increase development costs and timelines, hindering market entry for new players. Supply chain disruptions, especially in sourcing specialized components for medical devices, can impact production and availability. The competitive landscape is intensely dynamic, with existing players actively engaged in innovation and acquisitions to maintain market dominance, putting pressure on smaller firms. The high cost of advanced imaging systems and procedures presents a barrier for some healthcare providers.
Emerging Opportunities in Interventional Radiology Industry
Emerging opportunities abound in the Interventional Radiology industry. The integration of AI and machine learning is opening new avenues for image analysis, treatment planning, and procedural automation. The development of novel minimally invasive devices is expanding treatment options and improving patient outcomes. Growing demand for remote healthcare and telemedicine is fostering the development of remote intervention capabilities. Finally, untapped markets in developing economies present substantial growth potential for manufacturers and providers.
Leading Players in the Interventional Radiology Industry Market
- Hologic Inc
- GE Healthcare
- Medtronic PLC
- Siemens Healthineers AG
- Carestream Health
- Koninklijke Philips NV
- Canon Medical Systems Corporation
- Cook Medical
- Esaote SPA
- Shimadzu Corporation
- Samsung Medison (Samsung Electronics Co Ltd)
- Fujifilm Holdings Corporation
Key Developments in Interventional Radiology Industry
- November 2022: Konica Minolta Healthcare Americas launched the Sonimage MX1 Platinum point-of-care ultrasound system.
- November 2022: Fujifilm Healthcare Americas Corporation launched the Scenaria View Focus Edition CT system with Cardio StillShot.
- October 2022: GE Healthcare launched the Omni Legend all-digital PET/CT platform.
These developments reflect a trend towards advanced imaging technologies and enhanced operational efficiency, impacting market dynamics by improving diagnostic capabilities and streamlining workflows.
Future Outlook for Interventional Radiology Industry Market
The future of the Interventional Radiology market appears bright, driven by continued technological innovation, increasing prevalence of chronic diseases, and expanding access to healthcare in emerging markets. Strategic partnerships and acquisitions among leading players will continue to shape the competitive landscape. The focus on minimally invasive procedures and the integration of artificial intelligence will drive significant growth. Expansion into new applications and markets, coupled with improvements in healthcare infrastructure, will further accelerate market expansion in the coming years.
Interventional Radiology Industry Segmentation
-
1. Product
- 1.1. MRI Systems
- 1.2. Ultrasound Imaging Systems
- 1.3. CT Scanners
- 1.4. Angiography Systems
- 1.5. Fluoroscopy Systems
- 1.6. Biopsy Devices
- 1.7. Other Products
-
2. Application
- 2.1. Cardiology
- 2.2. Urology and Nephrology
- 2.3. Oncology
- 2.4. Gastroenterology
- 2.5. Other Applications
Interventional Radiology Industry Segmentation By Geography
-
1. North America
- 1.1. United States
- 1.2. Canada
- 1.3. Mexico
-
2. Europe
- 2.1. Germany
- 2.2. United Kingdom
- 2.3. France
- 2.4. Italy
- 2.5. Spain
- 2.6. Rest of Europe
-
3. Asia Pacific
- 3.1. China
- 3.2. Japan
- 3.3. India
- 3.4. Australia
- 3.5. South Korea
- 3.6. Rest of Asia Pacific
-
4. Middle East and Africa
- 4.1. GCC
- 4.2. South Africa
- 4.3. Rest of Middle East and Africa
-
5. South America
- 5.1. Brazil
- 5.2. Argentina
- 5.3. Rest of South America
Interventional Radiology Industry REPORT HIGHLIGHTS
| Aspects | Details |
|---|---|
| Study Period | 2019-2033 |
| Base Year | 2024 |
| Estimated Year | 2025 |
| Forecast Period | 2025-2033 |
| Historical Period | 2019-2024 |
| Growth Rate | CAGR of 5.90% from 2019-2033 |
| Segmentation |
|
Table of Contents
- 1. Introduction
- 1.1. Research Scope
- 1.2. Market Segmentation
- 1.3. Research Methodology
- 1.4. Definitions and Assumptions
- 2. Executive Summary
- 2.1. Introduction
- 3. Market Dynamics
- 3.1. Introduction
- 3.2. Market Drivers
- 3.2.1. Increasing Burden of Chronic Diseases; Technological Advancements in Interventional Radiology Devices
- 3.3. Market Restrains
- 3.3.1. Risk of High Radiation Exposure; High Cost of Equipment
- 3.4. Market Trends
- 3.4.1. The Cardiology Application is Expected to Witness High Growth Over the Forecast Period
- 4. Market Factor Analysis
- 4.1. Porters Five Forces
- 4.2. Supply/Value Chain
- 4.3. PESTEL analysis
- 4.4. Market Entropy
- 4.5. Patent/Trademark Analysis
- 5. Global Interventional Radiology Industry Analysis, Insights and Forecast, 2019-2031
- 5.1. Market Analysis, Insights and Forecast - by Product
- 5.1.1. MRI Systems
- 5.1.2. Ultrasound Imaging Systems
- 5.1.3. CT Scanners
- 5.1.4. Angiography Systems
- 5.1.5. Fluoroscopy Systems
- 5.1.6. Biopsy Devices
- 5.1.7. Other Products
- 5.2. Market Analysis, Insights and Forecast - by Application
- 5.2.1. Cardiology
- 5.2.2. Urology and Nephrology
- 5.2.3. Oncology
- 5.2.4. Gastroenterology
- 5.2.5. Other Applications
- 5.3. Market Analysis, Insights and Forecast - by Region
- 5.3.1. North America
- 5.3.2. Europe
- 5.3.3. Asia Pacific
- 5.3.4. Middle East and Africa
- 5.3.5. South America
- 5.1. Market Analysis, Insights and Forecast - by Product
- 6. North America Interventional Radiology Industry Analysis, Insights and Forecast, 2019-2031
- 6.1. Market Analysis, Insights and Forecast - by Product
- 6.1.1. MRI Systems
- 6.1.2. Ultrasound Imaging Systems
- 6.1.3. CT Scanners
- 6.1.4. Angiography Systems
- 6.1.5. Fluoroscopy Systems
- 6.1.6. Biopsy Devices
- 6.1.7. Other Products
- 6.2. Market Analysis, Insights and Forecast - by Application
- 6.2.1. Cardiology
- 6.2.2. Urology and Nephrology
- 6.2.3. Oncology
- 6.2.4. Gastroenterology
- 6.2.5. Other Applications
- 6.1. Market Analysis, Insights and Forecast - by Product
- 7. Europe Interventional Radiology Industry Analysis, Insights and Forecast, 2019-2031
- 7.1. Market Analysis, Insights and Forecast - by Product
- 7.1.1. MRI Systems
- 7.1.2. Ultrasound Imaging Systems
- 7.1.3. CT Scanners
- 7.1.4. Angiography Systems
- 7.1.5. Fluoroscopy Systems
- 7.1.6. Biopsy Devices
- 7.1.7. Other Products
- 7.2. Market Analysis, Insights and Forecast - by Application
- 7.2.1. Cardiology
- 7.2.2. Urology and Nephrology
- 7.2.3. Oncology
- 7.2.4. Gastroenterology
- 7.2.5. Other Applications
- 7.1. Market Analysis, Insights and Forecast - by Product
- 8. Asia Pacific Interventional Radiology Industry Analysis, Insights and Forecast, 2019-2031
- 8.1. Market Analysis, Insights and Forecast - by Product
- 8.1.1. MRI Systems
- 8.1.2. Ultrasound Imaging Systems
- 8.1.3. CT Scanners
- 8.1.4. Angiography Systems
- 8.1.5. Fluoroscopy Systems
- 8.1.6. Biopsy Devices
- 8.1.7. Other Products
- 8.2. Market Analysis, Insights and Forecast - by Application
- 8.2.1. Cardiology
- 8.2.2. Urology and Nephrology
- 8.2.3. Oncology
- 8.2.4. Gastroenterology
- 8.2.5. Other Applications
- 8.1. Market Analysis, Insights and Forecast - by Product
- 9. Middle East and Africa Interventional Radiology Industry Analysis, Insights and Forecast, 2019-2031
- 9.1. Market Analysis, Insights and Forecast - by Product
- 9.1.1. MRI Systems
- 9.1.2. Ultrasound Imaging Systems
- 9.1.3. CT Scanners
- 9.1.4. Angiography Systems
- 9.1.5. Fluoroscopy Systems
- 9.1.6. Biopsy Devices
- 9.1.7. Other Products
- 9.2. Market Analysis, Insights and Forecast - by Application
- 9.2.1. Cardiology
- 9.2.2. Urology and Nephrology
- 9.2.3. Oncology
- 9.2.4. Gastroenterology
- 9.2.5. Other Applications
- 9.1. Market Analysis, Insights and Forecast - by Product
- 10. South America Interventional Radiology Industry Analysis, Insights and Forecast, 2019-2031
- 10.1. Market Analysis, Insights and Forecast - by Product
- 10.1.1. MRI Systems
- 10.1.2. Ultrasound Imaging Systems
- 10.1.3. CT Scanners
- 10.1.4. Angiography Systems
- 10.1.5. Fluoroscopy Systems
- 10.1.6. Biopsy Devices
- 10.1.7. Other Products
- 10.2. Market Analysis, Insights and Forecast - by Application
- 10.2.1. Cardiology
- 10.2.2. Urology and Nephrology
- 10.2.3. Oncology
- 10.2.4. Gastroenterology
- 10.2.5. Other Applications
- 10.1. Market Analysis, Insights and Forecast - by Product
- 11. North America Interventional Radiology Industry Analysis, Insights and Forecast, 2019-2031
- 11.1. Market Analysis, Insights and Forecast - By Country/Sub-region
- 11.1.1 United States
- 11.1.2 Canada
- 11.1.3 Mexico
- 12. Europe Interventional Radiology Industry Analysis, Insights and Forecast, 2019-2031
- 12.1. Market Analysis, Insights and Forecast - By Country/Sub-region
- 12.1.1 Germany
- 12.1.2 United Kingdom
- 12.1.3 France
- 12.1.4 Italy
- 12.1.5 Spain
- 12.1.6 Rest of Europe
- 13. Asia Pacific Interventional Radiology Industry Analysis, Insights and Forecast, 2019-2031
- 13.1. Market Analysis, Insights and Forecast - By Country/Sub-region
- 13.1.1 China
- 13.1.2 Japan
- 13.1.3 India
- 13.1.4 Australia
- 13.1.5 South Korea
- 13.1.6 Rest of Asia Pacific
- 14. South America Interventional Radiology Industry Analysis, Insights and Forecast, 2019-2031
- 14.1. Market Analysis, Insights and Forecast - By Country/Sub-region
- 14.1.1 Brazil
- 14.1.2 Argentina
- 14.1.3 Rest of South America
- 15. Middle East and Africa Interventional Radiology Industry Analysis, Insights and Forecast, 2019-2031
- 15.1. Market Analysis, Insights and Forecast - By Country/Sub-region
- 15.1.1 GCC
- 15.1.2 South Africa
- 15.1.3 Rest of Middle East and Africa
- 16. Competitive Analysis
- 16.1. Global Market Share Analysis 2024
- 16.2. Company Profiles
- 16.2.1 Hologic Inc
- 16.2.1.1. Overview
- 16.2.1.2. Products
- 16.2.1.3. SWOT Analysis
- 16.2.1.4. Recent Developments
- 16.2.1.5. Financials (Based on Availability)
- 16.2.2 GE Healthcare
- 16.2.2.1. Overview
- 16.2.2.2. Products
- 16.2.2.3. SWOT Analysis
- 16.2.2.4. Recent Developments
- 16.2.2.5. Financials (Based on Availability)
- 16.2.3 Medtronic PLC
- 16.2.3.1. Overview
- 16.2.3.2. Products
- 16.2.3.3. SWOT Analysis
- 16.2.3.4. Recent Developments
- 16.2.3.5. Financials (Based on Availability)
- 16.2.4 Siemens Healthineers AG
- 16.2.4.1. Overview
- 16.2.4.2. Products
- 16.2.4.3. SWOT Analysis
- 16.2.4.4. Recent Developments
- 16.2.4.5. Financials (Based on Availability)
- 16.2.5 Carestream Health
- 16.2.5.1. Overview
- 16.2.5.2. Products
- 16.2.5.3. SWOT Analysis
- 16.2.5.4. Recent Developments
- 16.2.5.5. Financials (Based on Availability)
- 16.2.6 Koninklijke Philips NV
- 16.2.6.1. Overview
- 16.2.6.2. Products
- 16.2.6.3. SWOT Analysis
- 16.2.6.4. Recent Developments
- 16.2.6.5. Financials (Based on Availability)
- 16.2.7 Canon Medical Systems Corporation
- 16.2.7.1. Overview
- 16.2.7.2. Products
- 16.2.7.3. SWOT Analysis
- 16.2.7.4. Recent Developments
- 16.2.7.5. Financials (Based on Availability)
- 16.2.8 Cook Medical
- 16.2.8.1. Overview
- 16.2.8.2. Products
- 16.2.8.3. SWOT Analysis
- 16.2.8.4. Recent Developments
- 16.2.8.5. Financials (Based on Availability)
- 16.2.9 Esaote SPA
- 16.2.9.1. Overview
- 16.2.9.2. Products
- 16.2.9.3. SWOT Analysis
- 16.2.9.4. Recent Developments
- 16.2.9.5. Financials (Based on Availability)
- 16.2.10 Shimadzu Corporation
- 16.2.10.1. Overview
- 16.2.10.2. Products
- 16.2.10.3. SWOT Analysis
- 16.2.10.4. Recent Developments
- 16.2.10.5. Financials (Based on Availability)
- 16.2.11 Samsung Medison (Samsung Electronics Co Ltd)
- 16.2.11.1. Overview
- 16.2.11.2. Products
- 16.2.11.3. SWOT Analysis
- 16.2.11.4. Recent Developments
- 16.2.11.5. Financials (Based on Availability)
- 16.2.12 Fujifilm Holdings Corporation
- 16.2.12.1. Overview
- 16.2.12.2. Products
- 16.2.12.3. SWOT Analysis
- 16.2.12.4. Recent Developments
- 16.2.12.5. Financials (Based on Availability)
- 16.2.1 Hologic Inc
List of Figures
- Figure 1: Global Interventional Radiology Industry Revenue Breakdown (Million, %) by Region 2024 & 2032
- Figure 2: North America Interventional Radiology Industry Revenue (Million), by Country 2024 & 2032
- Figure 3: North America Interventional Radiology Industry Revenue Share (%), by Country 2024 & 2032
- Figure 4: Europe Interventional Radiology Industry Revenue (Million), by Country 2024 & 2032
- Figure 5: Europe Interventional Radiology Industry Revenue Share (%), by Country 2024 & 2032
- Figure 6: Asia Pacific Interventional Radiology Industry Revenue (Million), by Country 2024 & 2032
- Figure 7: Asia Pacific Interventional Radiology Industry Revenue Share (%), by Country 2024 & 2032
- Figure 8: South America Interventional Radiology Industry Revenue (Million), by Country 2024 & 2032
- Figure 9: South America Interventional Radiology Industry Revenue Share (%), by Country 2024 & 2032
- Figure 10: Middle East and Africa Interventional Radiology Industry Revenue (Million), by Country 2024 & 2032
- Figure 11: Middle East and Africa Interventional Radiology Industry Revenue Share (%), by Country 2024 & 2032
- Figure 12: North America Interventional Radiology Industry Revenue (Million), by Product 2024 & 2032
- Figure 13: North America Interventional Radiology Industry Revenue Share (%), by Product 2024 & 2032
- Figure 14: North America Interventional Radiology Industry Revenue (Million), by Application 2024 & 2032
- Figure 15: North America Interventional Radiology Industry Revenue Share (%), by Application 2024 & 2032
- Figure 16: North America Interventional Radiology Industry Revenue (Million), by Country 2024 & 2032
- Figure 17: North America Interventional Radiology Industry Revenue Share (%), by Country 2024 & 2032
- Figure 18: Europe Interventional Radiology Industry Revenue (Million), by Product 2024 & 2032
- Figure 19: Europe Interventional Radiology Industry Revenue Share (%), by Product 2024 & 2032
- Figure 20: Europe Interventional Radiology Industry Revenue (Million), by Application 2024 & 2032
- Figure 21: Europe Interventional Radiology Industry Revenue Share (%), by Application 2024 & 2032
- Figure 22: Europe Interventional Radiology Industry Revenue (Million), by Country 2024 & 2032
- Figure 23: Europe Interventional Radiology Industry Revenue Share (%), by Country 2024 & 2032
- Figure 24: Asia Pacific Interventional Radiology Industry Revenue (Million), by Product 2024 & 2032
- Figure 25: Asia Pacific Interventional Radiology Industry Revenue Share (%), by Product 2024 & 2032
- Figure 26: Asia Pacific Interventional Radiology Industry Revenue (Million), by Application 2024 & 2032
- Figure 27: Asia Pacific Interventional Radiology Industry Revenue Share (%), by Application 2024 & 2032
- Figure 28: Asia Pacific Interventional Radiology Industry Revenue (Million), by Country 2024 & 2032
- Figure 29: Asia Pacific Interventional Radiology Industry Revenue Share (%), by Country 2024 & 2032
- Figure 30: Middle East and Africa Interventional Radiology Industry Revenue (Million), by Product 2024 & 2032
- Figure 31: Middle East and Africa Interventional Radiology Industry Revenue Share (%), by Product 2024 & 2032
- Figure 32: Middle East and Africa Interventional Radiology Industry Revenue (Million), by Application 2024 & 2032
- Figure 33: Middle East and Africa Interventional Radiology Industry Revenue Share (%), by Application 2024 & 2032
- Figure 34: Middle East and Africa Interventional Radiology Industry Revenue (Million), by Country 2024 & 2032
- Figure 35: Middle East and Africa Interventional Radiology Industry Revenue Share (%), by Country 2024 & 2032
- Figure 36: South America Interventional Radiology Industry Revenue (Million), by Product 2024 & 2032
- Figure 37: South America Interventional Radiology Industry Revenue Share (%), by Product 2024 & 2032
- Figure 38: South America Interventional Radiology Industry Revenue (Million), by Application 2024 & 2032
- Figure 39: South America Interventional Radiology Industry Revenue Share (%), by Application 2024 & 2032
- Figure 40: South America Interventional Radiology Industry Revenue (Million), by Country 2024 & 2032
- Figure 41: South America Interventional Radiology Industry Revenue Share (%), by Country 2024 & 2032
List of Tables
- Table 1: Global Interventional Radiology Industry Revenue Million Forecast, by Region 2019 & 2032
- Table 2: Global Interventional Radiology Industry Revenue Million Forecast, by Product 2019 & 2032
- Table 3: Global Interventional Radiology Industry Revenue Million Forecast, by Application 2019 & 2032
- Table 4: Global Interventional Radiology Industry Revenue Million Forecast, by Region 2019 & 2032
- Table 5: Global Interventional Radiology Industry Revenue Million Forecast, by Country 2019 & 2032
- Table 6: United States Interventional Radiology Industry Revenue (Million) Forecast, by Application 2019 & 2032
- Table 7: Canada Interventional Radiology Industry Revenue (Million) Forecast, by Application 2019 & 2032
- Table 8: Mexico Interventional Radiology Industry Revenue (Million) Forecast, by Application 2019 & 2032
- Table 9: Global Interventional Radiology Industry Revenue Million Forecast, by Country 2019 & 2032
- Table 10: Germany Interventional Radiology Industry Revenue (Million) Forecast, by Application 2019 & 2032
- Table 11: United Kingdom Interventional Radiology Industry Revenue (Million) Forecast, by Application 2019 & 2032
- Table 12: France Interventional Radiology Industry Revenue (Million) Forecast, by Application 2019 & 2032
- Table 13: Italy Interventional Radiology Industry Revenue (Million) Forecast, by Application 2019 & 2032
- Table 14: Spain Interventional Radiology Industry Revenue (Million) Forecast, by Application 2019 & 2032
- Table 15: Rest of Europe Interventional Radiology Industry Revenue (Million) Forecast, by Application 2019 & 2032
- Table 16: Global Interventional Radiology Industry Revenue Million Forecast, by Country 2019 & 2032
- Table 17: China Interventional Radiology Industry Revenue (Million) Forecast, by Application 2019 & 2032
- Table 18: Japan Interventional Radiology Industry Revenue (Million) Forecast, by Application 2019 & 2032
- Table 19: India Interventional Radiology Industry Revenue (Million) Forecast, by Application 2019 & 2032
- Table 20: Australia Interventional Radiology Industry Revenue (Million) Forecast, by Application 2019 & 2032
- Table 21: South Korea Interventional Radiology Industry Revenue (Million) Forecast, by Application 2019 & 2032
- Table 22: Rest of Asia Pacific Interventional Radiology Industry Revenue (Million) Forecast, by Application 2019 & 2032
- Table 23: Global Interventional Radiology Industry Revenue Million Forecast, by Country 2019 & 2032
- Table 24: Brazil Interventional Radiology Industry Revenue (Million) Forecast, by Application 2019 & 2032
- Table 25: Argentina Interventional Radiology Industry Revenue (Million) Forecast, by Application 2019 & 2032
- Table 26: Rest of South America Interventional Radiology Industry Revenue (Million) Forecast, by Application 2019 & 2032
- Table 27: Global Interventional Radiology Industry Revenue Million Forecast, by Country 2019 & 2032
- Table 28: GCC Interventional Radiology Industry Revenue (Million) Forecast, by Application 2019 & 2032
- Table 29: South Africa Interventional Radiology Industry Revenue (Million) Forecast, by Application 2019 & 2032
- Table 30: Rest of Middle East and Africa Interventional Radiology Industry Revenue (Million) Forecast, by Application 2019 & 2032
- Table 31: Global Interventional Radiology Industry Revenue Million Forecast, by Product 2019 & 2032
- Table 32: Global Interventional Radiology Industry Revenue Million Forecast, by Application 2019 & 2032
- Table 33: Global Interventional Radiology Industry Revenue Million Forecast, by Country 2019 & 2032
- Table 34: United States Interventional Radiology Industry Revenue (Million) Forecast, by Application 2019 & 2032
- Table 35: Canada Interventional Radiology Industry Revenue (Million) Forecast, by Application 2019 & 2032
- Table 36: Mexico Interventional Radiology Industry Revenue (Million) Forecast, by Application 2019 & 2032
- Table 37: Global Interventional Radiology Industry Revenue Million Forecast, by Product 2019 & 2032
- Table 38: Global Interventional Radiology Industry Revenue Million Forecast, by Application 2019 & 2032
- Table 39: Global Interventional Radiology Industry Revenue Million Forecast, by Country 2019 & 2032
- Table 40: Germany Interventional Radiology Industry Revenue (Million) Forecast, by Application 2019 & 2032
- Table 41: United Kingdom Interventional Radiology Industry Revenue (Million) Forecast, by Application 2019 & 2032
- Table 42: France Interventional Radiology Industry Revenue (Million) Forecast, by Application 2019 & 2032
- Table 43: Italy Interventional Radiology Industry Revenue (Million) Forecast, by Application 2019 & 2032
- Table 44: Spain Interventional Radiology Industry Revenue (Million) Forecast, by Application 2019 & 2032
- Table 45: Rest of Europe Interventional Radiology Industry Revenue (Million) Forecast, by Application 2019 & 2032
- Table 46: Global Interventional Radiology Industry Revenue Million Forecast, by Product 2019 & 2032
- Table 47: Global Interventional Radiology Industry Revenue Million Forecast, by Application 2019 & 2032
- Table 48: Global Interventional Radiology Industry Revenue Million Forecast, by Country 2019 & 2032
- Table 49: China Interventional Radiology Industry Revenue (Million) Forecast, by Application 2019 & 2032
- Table 50: Japan Interventional Radiology Industry Revenue (Million) Forecast, by Application 2019 & 2032
- Table 51: India Interventional Radiology Industry Revenue (Million) Forecast, by Application 2019 & 2032
- Table 52: Australia Interventional Radiology Industry Revenue (Million) Forecast, by Application 2019 & 2032
- Table 53: South Korea Interventional Radiology Industry Revenue (Million) Forecast, by Application 2019 & 2032
- Table 54: Rest of Asia Pacific Interventional Radiology Industry Revenue (Million) Forecast, by Application 2019 & 2032
- Table 55: Global Interventional Radiology Industry Revenue Million Forecast, by Product 2019 & 2032
- Table 56: Global Interventional Radiology Industry Revenue Million Forecast, by Application 2019 & 2032
- Table 57: Global Interventional Radiology Industry Revenue Million Forecast, by Country 2019 & 2032
- Table 58: GCC Interventional Radiology Industry Revenue (Million) Forecast, by Application 2019 & 2032
- Table 59: South Africa Interventional Radiology Industry Revenue (Million) Forecast, by Application 2019 & 2032
- Table 60: Rest of Middle East and Africa Interventional Radiology Industry Revenue (Million) Forecast, by Application 2019 & 2032
- Table 61: Global Interventional Radiology Industry Revenue Million Forecast, by Product 2019 & 2032
- Table 62: Global Interventional Radiology Industry Revenue Million Forecast, by Application 2019 & 2032
- Table 63: Global Interventional Radiology Industry Revenue Million Forecast, by Country 2019 & 2032
- Table 64: Brazil Interventional Radiology Industry Revenue (Million) Forecast, by Application 2019 & 2032
- Table 65: Argentina Interventional Radiology Industry Revenue (Million) Forecast, by Application 2019 & 2032
- Table 66: Rest of South America Interventional Radiology Industry Revenue (Million) Forecast, by Application 2019 & 2032
Frequently Asked Questions
1. What is the projected Compound Annual Growth Rate (CAGR) of the Interventional Radiology Industry?
The projected CAGR is approximately 5.90%.
2. Which companies are prominent players in the Interventional Radiology Industry?
Key companies in the market include Hologic Inc, GE Healthcare, Medtronic PLC, Siemens Healthineers AG, Carestream Health, Koninklijke Philips NV, Canon Medical Systems Corporation, Cook Medical, Esaote SPA, Shimadzu Corporation, Samsung Medison (Samsung Electronics Co Ltd), Fujifilm Holdings Corporation.
3. What are the main segments of the Interventional Radiology Industry?
The market segments include Product, Application.
4. Can you provide details about the market size?
The market size is estimated to be USD 26.96 Million as of 2022.
5. What are some drivers contributing to market growth?
Increasing Burden of Chronic Diseases; Technological Advancements in Interventional Radiology Devices.
6. What are the notable trends driving market growth?
The Cardiology Application is Expected to Witness High Growth Over the Forecast Period.
7. Are there any restraints impacting market growth?
Risk of High Radiation Exposure; High Cost of Equipment.
8. Can you provide examples of recent developments in the market?
November 2022: Konica Minolta Healthcare Americas launched a new point-of-care ultrasound system called Sonimage MX1 Platinum.
9. What pricing options are available for accessing the report?
Pricing options include single-user, multi-user, and enterprise licenses priced at USD 4750, USD 5250, and USD 8750 respectively.
10. Is the market size provided in terms of value or volume?
The market size is provided in terms of value, measured in Million.
11. Are there any specific market keywords associated with the report?
Yes, the market keyword associated with the report is "Interventional Radiology Industry," which aids in identifying and referencing the specific market segment covered.
12. How do I determine which pricing option suits my needs best?
The pricing options vary based on user requirements and access needs. Individual users may opt for single-user licenses, while businesses requiring broader access may choose multi-user or enterprise licenses for cost-effective access to the report.
13. Are there any additional resources or data provided in the Interventional Radiology Industry report?
While the report offers comprehensive insights, it's advisable to review the specific contents or supplementary materials provided to ascertain if additional resources or data are available.
14. How can I stay updated on further developments or reports in the Interventional Radiology Industry?
To stay informed about further developments, trends, and reports in the Interventional Radiology Industry, consider subscribing to industry newsletters, following relevant companies and organizations, or regularly checking reputable industry news sources and publications.
Methodology
Step 1 - Identification of Relevant Samples Size from Population Database


Step 2 - Approaches for Defining Global Market Size (Value, Volume* & Price*)

Note*: In applicable scenarios
Step 3 - Data Sources
Primary Research
- Web Analytics
- Survey Reports
- Research Institute
- Latest Research Reports
- Opinion Leaders
Secondary Research
- Annual Reports
- White Paper
- Latest Press Release
- Industry Association
- Paid Database
- Investor Presentations

Step 4 - Data Triangulation
Involves using different sources of information in order to increase the validity of a study
These sources are likely to be stakeholders in a program - participants, other researchers, program staff, other community members, and so on.
Then we put all data in single framework & apply various statistical tools to find out the dynamic on the market.
During the analysis stage, feedback from the stakeholder groups would be compared to determine areas of agreement as well as areas of divergence


