
Key Insights
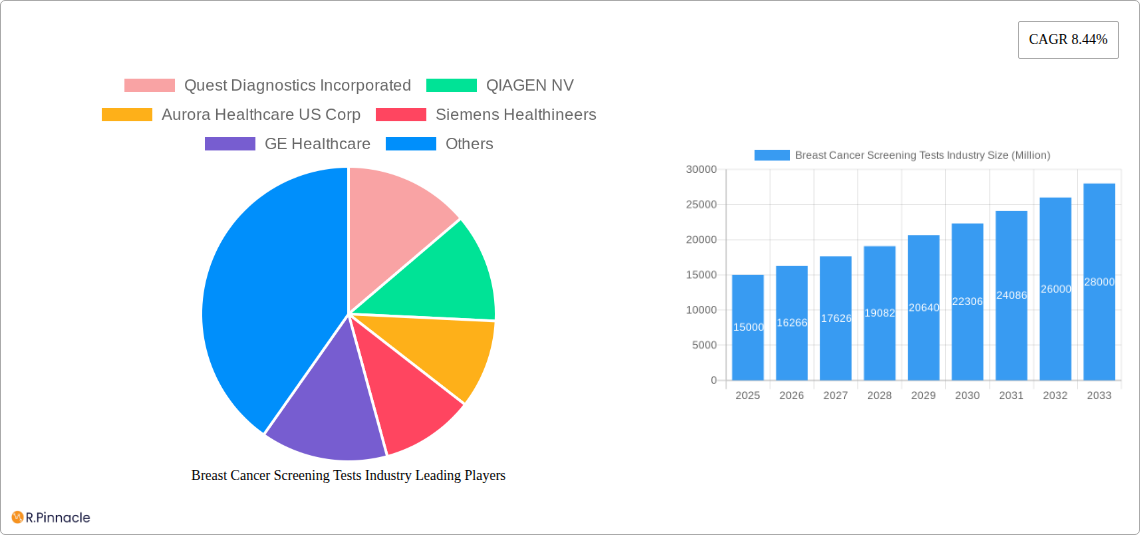
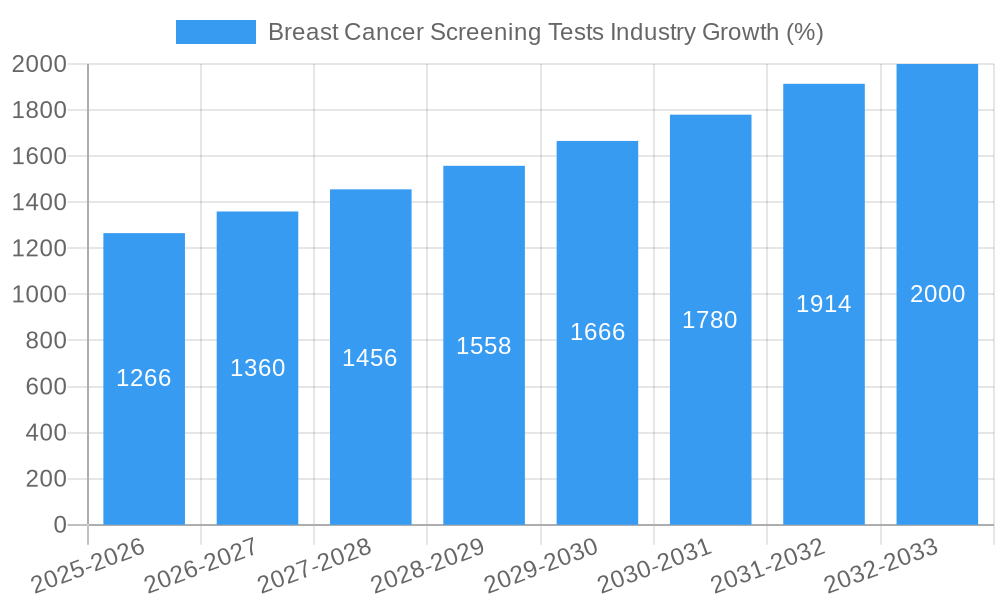
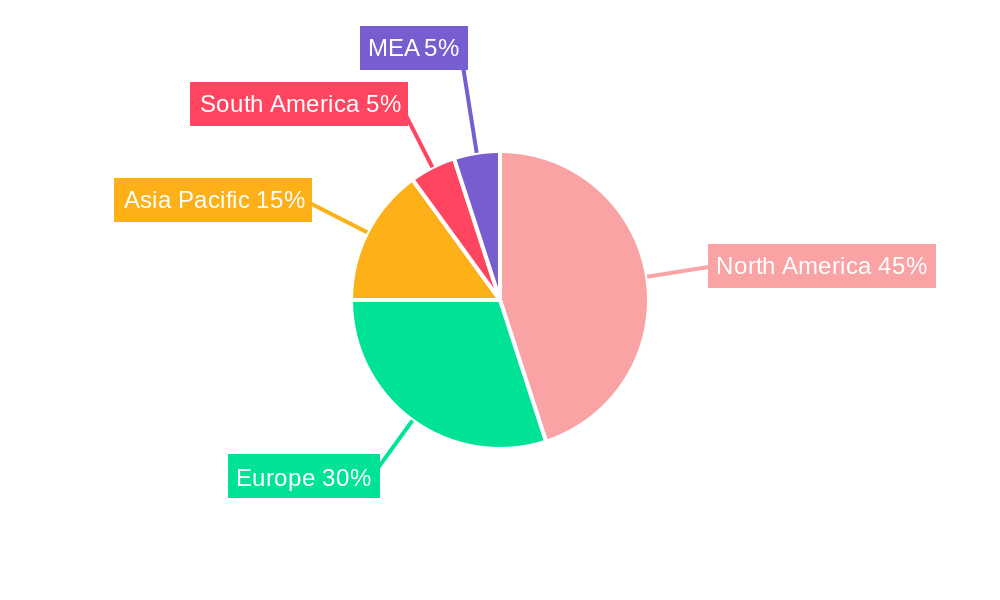
The global breast cancer screening tests market is experiencing robust growth, driven by rising breast cancer incidence rates worldwide, increased awareness about early detection, and advancements in screening technologies. The market's Compound Annual Growth Rate (CAGR) of 8.44% from 2019-2024 indicates a significant expansion, projected to continue over the forecast period (2025-2033). Key segments within the market include genomic tests, offering increasingly precise risk assessment and personalized treatment options, and imaging tests, such as mammography and ultrasound, providing crucial visual diagnostic capabilities. The market is significantly influenced by technological innovations; the development of AI-powered diagnostic tools, for instance, promises improved accuracy and efficiency in detecting cancerous lesions. Furthermore, the growing adoption of preventative healthcare measures and government initiatives promoting early detection are fueling market growth. Geographic variations in market size are expected, with North America and Europe currently holding substantial shares due to established healthcare infrastructure and high awareness levels. However, rapid economic development and improving healthcare infrastructure in Asia-Pacific and other emerging markets are anticipated to drive significant growth in these regions during the forecast period. Competition is fierce, with major players like Quest Diagnostics, QIAGEN, and Siemens Healthineers leading the market, constantly innovating to improve test accuracy, accessibility, and affordability.
The continued increase in breast cancer diagnosis necessitates improvements in screening methodologies. Challenges remain in ensuring equitable access to screening, especially in underserved populations. Cost remains a significant barrier for widespread adoption in certain regions, though the long-term cost-effectiveness of early detection and treatment outweighs the initial investment. Ongoing research and development focusing on non-invasive and less expensive testing methods, alongside improved reimbursement policies, are expected to alleviate these restraints and further accelerate market growth in the coming years. The market is expected to witness a steady influx of new technologies and strategic collaborations among players, focusing on developing innovative solutions that improve diagnostic capabilities, reduce costs and broaden accessibility. This will ultimately lead to earlier diagnosis and improved patient outcomes.
This in-depth report provides a comprehensive analysis of the Breast Cancer Screening Tests industry, offering invaluable insights for industry professionals, investors, and strategists. The report covers the period 2019-2033, with a focus on the 2025-2033 forecast period. The base year for this analysis is 2025. Expect detailed market sizing in Millions (USD) throughout.
Breast Cancer Screening Tests Industry Market Structure & Innovation Trends
The global breast cancer screening tests market exhibits a moderately concentrated structure, with key players like Quest Diagnostics Incorporated, QIAGEN NV, and Hologic Inc. holding significant market share. However, the market also features several smaller, specialized companies focusing on niche segments like genomic testing or specific imaging modalities. The combined market share of the top five players is estimated to be around xx%. Recent years have witnessed several mergers and acquisitions (M&A) activities, with deal values ranging from xx Million to xx Million, primarily driven by the need to expand product portfolios and geographical reach. Innovation is a key driver, fueled by advancements in genomics, AI-powered imaging, and personalized medicine. Regulatory frameworks, particularly concerning the approval and reimbursement of new tests, significantly influence market dynamics. The market faces competition from alternative screening methods and increasing pressure to reduce costs. End-user demographics are shifting towards an aging population with increased breast cancer awareness, driving demand.
- Market Concentration: Moderately concentrated, top 5 players holding approximately xx% market share.
- M&A Activity: Several deals valued between xx Million and xx Million in recent years.
- Innovation Drivers: Genomics, AI-powered imaging, personalized medicine.
- Regulatory Framework: Significant influence on market access and reimbursement.
- Product Substitutes: Alternative screening methods pose competitive pressure.
Breast Cancer Screening Tests Industry Market Dynamics & Trends
The breast cancer screening tests market is experiencing robust growth, driven by several key factors. The rising prevalence of breast cancer globally, coupled with increased awareness and early detection initiatives, is a primary driver. Technological advancements, particularly in genomic testing and AI-integrated imaging, are enhancing diagnostic accuracy and efficiency, leading to improved patient outcomes and fueling market expansion. Consumer preferences are shifting towards minimally invasive, faster, and more accurate testing methods. The competitive landscape is dynamic, with companies investing heavily in R&D to develop innovative products and expand market reach. The Compound Annual Growth Rate (CAGR) for the forecast period (2025-2033) is estimated at xx%, with market penetration expected to reach xx% by 2033.
Dominant Regions & Segments in Breast Cancer Screening Tests Industry
The North American market currently holds the largest share of the global breast cancer screening tests market, driven by factors such as robust healthcare infrastructure, high healthcare expenditure, and advanced technological capabilities. Within the testing segments:
Genomic Tests: The North American market is the dominant region due to high adoption rates of advanced genomic technologies and well-established healthcare infrastructure. Key drivers include:
- Extensive research funding and advanced genomics capabilities.
- High healthcare expenditure per capita.
- Increased awareness among healthcare providers and patients.
Imaging Tests: The North American market remains dominant due to its extensive network of radiology facilities and high adoption rates of advanced imaging technologies. Key drivers include:
- Advanced imaging facilities and high adoption rates of cutting-edge technology.
- High prevalence of breast cancer and increased screening rates.
- Favorable regulatory environment and reimbursement policies.
Within countries, the US holds the largest market share within North America.
Breast Cancer Screening Tests Industry Product Innovations
Recent product innovations focus on improving the accuracy, speed, and accessibility of breast cancer screening. This includes AI-powered image analysis for faster and more precise mammogram interpretation, advanced genomic tests providing personalized risk assessment and treatment guidance, and portable, point-of-care imaging devices expanding access to screening in underserved areas. These innovations are enhancing the effectiveness of breast cancer detection and management, increasing their market appeal and competitive advantage.
Report Scope & Segmentation Analysis
This report segments the breast cancer screening tests market by test type (Genomic Tests and Imaging Tests).
Genomic Tests: This segment encompasses various genomic assays used for risk assessment, diagnosis, and prognosis of breast cancer. The market is expected to witness significant growth driven by advancements in genomic technologies and increasing demand for personalized medicine. Competitive dynamics are shaped by the development of advanced assays and efficient diagnostic panels.
Imaging Tests: This segment includes mammography, ultrasound, MRI, and other imaging techniques used for breast cancer detection and diagnosis. Market growth is driven by technological advancements resulting in improved image quality, faster acquisition times, and reduced radiation exposure. The market is characterized by intense competition among major medical device companies. Growth projections for both segments are significant, with the genomic testing market expected to experience a xx% CAGR and the imaging testing market to experience a xx% CAGR over the forecast period.
Key Drivers of Breast Cancer Screening Tests Industry Growth
The breast cancer screening tests market is propelled by a confluence of factors. The rising incidence of breast cancer globally is a major driver, along with increased awareness and screening programs. Technological advancements, including AI-powered imaging and sophisticated genomic tests, improve accuracy and efficiency. Furthermore, favorable government policies and increased healthcare spending in many regions contribute to market expansion.
Challenges in the Breast Cancer Screening Tests Industry Sector
The industry faces challenges including the high cost of advanced testing, stringent regulatory approvals, potential reimbursement issues, and the complexities of integrating new technologies into existing healthcare workflows. Supply chain disruptions also contribute to price volatility and availability challenges. Competition is fierce, with companies constantly striving to differentiate themselves through innovation. The impact of these challenges can lead to xx Million in potential lost revenue annually, which is a conservative estimate.
Emerging Opportunities in Breast Cancer Screening Tests Industry
Emerging opportunities include the development of liquid biopsies, the expansion of point-of-care testing, and the integration of artificial intelligence and machine learning for improved diagnostics and personalized treatment. The growing demand for early detection and personalized medicine, particularly in developing countries, presents significant potential for market expansion.
Leading Players in the Breast Cancer Screening Tests Industry Market
- Quest Diagnostics Incorporated
- QIAGEN NV
- Aurora Healthcare US Corp
- Siemens Healthineers
- GE Healthcare
- Hologic Inc
- Analogic Corporation
- Agendia Inc
- Myriad Genetics
- Allengers Medical Systems Limited
- Fujifilm Holdings Corporation
Key Developments in Breast Cancer Screening Tests Industry
February 2023: Abdul Latif Jameel Health's distribution agreement with iSono Health to leverage AI-powered automated imaging for breast care signifies a significant step towards improving accessibility and efficiency in breast cancer screening. This development is expected to increase market adoption of AI-powered solutions.
October 2022: The collaboration between the University of Texas MD Anderson Cancer Center and the WHO to reduce the global burden of women's cancers will likely drive increased investment and initiatives in breast cancer screening and early detection, particularly in underserved regions. This will contribute to long-term market growth.
Future Outlook for Breast Cancer Screening Tests Industry Market
The future outlook for the breast cancer screening tests market is highly positive, driven by continuous technological advancements, rising prevalence of breast cancer, and increasing focus on early detection and personalized medicine. The market is poised for substantial growth, driven by both innovation and increasing awareness. Strategic partnerships, acquisitions, and expansion into new geographical markets will be critical for continued success in this evolving landscape.
Breast Cancer Screening Tests Industry Segmentation
-
1. Test
- 1.1. Genomic Tests
-
1.2. Imaging Test
- 1.2.1. Mammogram
- 1.2.2. Ultrasound
- 1.2.3. MRI
- 1.2.4. Tomography
- 1.2.5. Other Imaging Tests
-
2. Geography
- 2.1. United States
- 2.2. Canada
- 2.3. Mexico
Breast Cancer Screening Tests Industry Segmentation By Geography
- 1. United States
- 2. Canada
- 3. Mexico
Breast Cancer Screening Tests Industry REPORT HIGHLIGHTS
| Aspects | Details |
|---|---|
| Study Period | 2019-2033 |
| Base Year | 2024 |
| Estimated Year | 2025 |
| Forecast Period | 2025-2033 |
| Historical Period | 2019-2024 |
| Growth Rate | CAGR of 8.44% from 2019-2033 |
| Segmentation |
|
Table of Contents
- 1. Introduction
- 1.1. Research Scope
- 1.2. Market Segmentation
- 1.3. Research Methodology
- 1.4. Definitions and Assumptions
- 2. Executive Summary
- 2.1. Introduction
- 3. Market Dynamics
- 3.1. Introduction
- 3.2. Market Drivers
- 3.2.1. Rising Incidence of Breast Cancer; Technological Advancements in Breast Cancer Screening
- 3.3. Market Restrains
- 3.3.1. Controversies Related to Mammography; Side Effects of Radiation during Screening Tests and Errors in Screening
- 3.4. Market Trends
- 3.4.1. Mammogram is Expected to Hold a Significant Share Over the Forecast Period
- 4. Market Factor Analysis
- 4.1. Porters Five Forces
- 4.2. Supply/Value Chain
- 4.3. PESTEL analysis
- 4.4. Market Entropy
- 4.5. Patent/Trademark Analysis
- 5. Global Breast Cancer Screening Tests Industry Analysis, Insights and Forecast, 2019-2031
- 5.1. Market Analysis, Insights and Forecast - by Test
- 5.1.1. Genomic Tests
- 5.1.2. Imaging Test
- 5.1.2.1. Mammogram
- 5.1.2.2. Ultrasound
- 5.1.2.3. MRI
- 5.1.2.4. Tomography
- 5.1.2.5. Other Imaging Tests
- 5.2. Market Analysis, Insights and Forecast - by Geography
- 5.2.1. United States
- 5.2.2. Canada
- 5.2.3. Mexico
- 5.3. Market Analysis, Insights and Forecast - by Region
- 5.3.1. United States
- 5.3.2. Canada
- 5.3.3. Mexico
- 5.1. Market Analysis, Insights and Forecast - by Test
- 6. United States Breast Cancer Screening Tests Industry Analysis, Insights and Forecast, 2019-2031
- 6.1. Market Analysis, Insights and Forecast - by Test
- 6.1.1. Genomic Tests
- 6.1.2. Imaging Test
- 6.1.2.1. Mammogram
- 6.1.2.2. Ultrasound
- 6.1.2.3. MRI
- 6.1.2.4. Tomography
- 6.1.2.5. Other Imaging Tests
- 6.2. Market Analysis, Insights and Forecast - by Geography
- 6.2.1. United States
- 6.2.2. Canada
- 6.2.3. Mexico
- 6.1. Market Analysis, Insights and Forecast - by Test
- 7. Canada Breast Cancer Screening Tests Industry Analysis, Insights and Forecast, 2019-2031
- 7.1. Market Analysis, Insights and Forecast - by Test
- 7.1.1. Genomic Tests
- 7.1.2. Imaging Test
- 7.1.2.1. Mammogram
- 7.1.2.2. Ultrasound
- 7.1.2.3. MRI
- 7.1.2.4. Tomography
- 7.1.2.5. Other Imaging Tests
- 7.2. Market Analysis, Insights and Forecast - by Geography
- 7.2.1. United States
- 7.2.2. Canada
- 7.2.3. Mexico
- 7.1. Market Analysis, Insights and Forecast - by Test
- 8. Mexico Breast Cancer Screening Tests Industry Analysis, Insights and Forecast, 2019-2031
- 8.1. Market Analysis, Insights and Forecast - by Test
- 8.1.1. Genomic Tests
- 8.1.2. Imaging Test
- 8.1.2.1. Mammogram
- 8.1.2.2. Ultrasound
- 8.1.2.3. MRI
- 8.1.2.4. Tomography
- 8.1.2.5. Other Imaging Tests
- 8.2. Market Analysis, Insights and Forecast - by Geography
- 8.2.1. United States
- 8.2.2. Canada
- 8.2.3. Mexico
- 8.1. Market Analysis, Insights and Forecast - by Test
- 9. North America Breast Cancer Screening Tests Industry Analysis, Insights and Forecast, 2019-2031
- 9.1. Market Analysis, Insights and Forecast - By Country/Sub-region
- 9.1.1 United States
- 9.1.2 Canada
- 9.1.3 Mexico
- 10. Europe Breast Cancer Screening Tests Industry Analysis, Insights and Forecast, 2019-2031
- 10.1. Market Analysis, Insights and Forecast - By Country/Sub-region
- 10.1.1 Germany
- 10.1.2 United Kingdom
- 10.1.3 France
- 10.1.4 Spain
- 10.1.5 Italy
- 10.1.6 Spain
- 10.1.7 Belgium
- 10.1.8 Netherland
- 10.1.9 Nordics
- 10.1.10 Rest of Europe
- 11. Asia Pacific Breast Cancer Screening Tests Industry Analysis, Insights and Forecast, 2019-2031
- 11.1. Market Analysis, Insights and Forecast - By Country/Sub-region
- 11.1.1 China
- 11.1.2 Japan
- 11.1.3 India
- 11.1.4 South Korea
- 11.1.5 Southeast Asia
- 11.1.6 Australia
- 11.1.7 Indonesia
- 11.1.8 Phillipes
- 11.1.9 Singapore
- 11.1.10 Thailandc
- 11.1.11 Rest of Asia Pacific
- 12. South America Breast Cancer Screening Tests Industry Analysis, Insights and Forecast, 2019-2031
- 12.1. Market Analysis, Insights and Forecast - By Country/Sub-region
- 12.1.1 Brazil
- 12.1.2 Argentina
- 12.1.3 Peru
- 12.1.4 Chile
- 12.1.5 Colombia
- 12.1.6 Ecuador
- 12.1.7 Venezuela
- 12.1.8 Rest of South America
- 13. North America Breast Cancer Screening Tests Industry Analysis, Insights and Forecast, 2019-2031
- 13.1. Market Analysis, Insights and Forecast - By Country/Sub-region
- 13.1.1 United States
- 13.1.2 Canada
- 13.1.3 Mexico
- 14. MEA Breast Cancer Screening Tests Industry Analysis, Insights and Forecast, 2019-2031
- 14.1. Market Analysis, Insights and Forecast - By Country/Sub-region
- 14.1.1 United Arab Emirates
- 14.1.2 Saudi Arabia
- 14.1.3 South Africa
- 14.1.4 Rest of Middle East and Africa
- 15. Competitive Analysis
- 15.1. Global Market Share Analysis 2024
- 15.2. Company Profiles
- 15.2.1 Quest Diagnostics Incorporated
- 15.2.1.1. Overview
- 15.2.1.2. Products
- 15.2.1.3. SWOT Analysis
- 15.2.1.4. Recent Developments
- 15.2.1.5. Financials (Based on Availability)
- 15.2.2 QIAGEN NV
- 15.2.2.1. Overview
- 15.2.2.2. Products
- 15.2.2.3. SWOT Analysis
- 15.2.2.4. Recent Developments
- 15.2.2.5. Financials (Based on Availability)
- 15.2.3 Aurora Healthcare US Corp
- 15.2.3.1. Overview
- 15.2.3.2. Products
- 15.2.3.3. SWOT Analysis
- 15.2.3.4. Recent Developments
- 15.2.3.5. Financials (Based on Availability)
- 15.2.4 Siemens Healthineers
- 15.2.4.1. Overview
- 15.2.4.2. Products
- 15.2.4.3. SWOT Analysis
- 15.2.4.4. Recent Developments
- 15.2.4.5. Financials (Based on Availability)
- 15.2.5 GE Healthcare
- 15.2.5.1. Overview
- 15.2.5.2. Products
- 15.2.5.3. SWOT Analysis
- 15.2.5.4. Recent Developments
- 15.2.5.5. Financials (Based on Availability)
- 15.2.6 Hologic Inc
- 15.2.6.1. Overview
- 15.2.6.2. Products
- 15.2.6.3. SWOT Analysis
- 15.2.6.4. Recent Developments
- 15.2.6.5. Financials (Based on Availability)
- 15.2.7 Analogic Corporation
- 15.2.7.1. Overview
- 15.2.7.2. Products
- 15.2.7.3. SWOT Analysis
- 15.2.7.4. Recent Developments
- 15.2.7.5. Financials (Based on Availability)
- 15.2.8 Agendia Inc
- 15.2.8.1. Overview
- 15.2.8.2. Products
- 15.2.8.3. SWOT Analysis
- 15.2.8.4. Recent Developments
- 15.2.8.5. Financials (Based on Availability)
- 15.2.9 Myriad Genetics
- 15.2.9.1. Overview
- 15.2.9.2. Products
- 15.2.9.3. SWOT Analysis
- 15.2.9.4. Recent Developments
- 15.2.9.5. Financials (Based on Availability)
- 15.2.10 Allengers Medical Systems Limited
- 15.2.10.1. Overview
- 15.2.10.2. Products
- 15.2.10.3. SWOT Analysis
- 15.2.10.4. Recent Developments
- 15.2.10.5. Financials (Based on Availability)
- 15.2.11 Fujifilm Holdings Corporation
- 15.2.11.1. Overview
- 15.2.11.2. Products
- 15.2.11.3. SWOT Analysis
- 15.2.11.4. Recent Developments
- 15.2.11.5. Financials (Based on Availability)
- 15.2.1 Quest Diagnostics Incorporated
List of Figures
- Figure 1: Global Breast Cancer Screening Tests Industry Revenue Breakdown (Million, %) by Region 2024 & 2032
- Figure 2: Global Breast Cancer Screening Tests Industry Volume Breakdown (K Unit, %) by Region 2024 & 2032
- Figure 3: North America Breast Cancer Screening Tests Industry Revenue (Million), by Country 2024 & 2032
- Figure 4: North America Breast Cancer Screening Tests Industry Volume (K Unit), by Country 2024 & 2032
- Figure 5: North America Breast Cancer Screening Tests Industry Revenue Share (%), by Country 2024 & 2032
- Figure 6: North America Breast Cancer Screening Tests Industry Volume Share (%), by Country 2024 & 2032
- Figure 7: Europe Breast Cancer Screening Tests Industry Revenue (Million), by Country 2024 & 2032
- Figure 8: Europe Breast Cancer Screening Tests Industry Volume (K Unit), by Country 2024 & 2032
- Figure 9: Europe Breast Cancer Screening Tests Industry Revenue Share (%), by Country 2024 & 2032
- Figure 10: Europe Breast Cancer Screening Tests Industry Volume Share (%), by Country 2024 & 2032
- Figure 11: Asia Pacific Breast Cancer Screening Tests Industry Revenue (Million), by Country 2024 & 2032
- Figure 12: Asia Pacific Breast Cancer Screening Tests Industry Volume (K Unit), by Country 2024 & 2032
- Figure 13: Asia Pacific Breast Cancer Screening Tests Industry Revenue Share (%), by Country 2024 & 2032
- Figure 14: Asia Pacific Breast Cancer Screening Tests Industry Volume Share (%), by Country 2024 & 2032
- Figure 15: South America Breast Cancer Screening Tests Industry Revenue (Million), by Country 2024 & 2032
- Figure 16: South America Breast Cancer Screening Tests Industry Volume (K Unit), by Country 2024 & 2032
- Figure 17: South America Breast Cancer Screening Tests Industry Revenue Share (%), by Country 2024 & 2032
- Figure 18: South America Breast Cancer Screening Tests Industry Volume Share (%), by Country 2024 & 2032
- Figure 19: North America Breast Cancer Screening Tests Industry Revenue (Million), by Country 2024 & 2032
- Figure 20: North America Breast Cancer Screening Tests Industry Volume (K Unit), by Country 2024 & 2032
- Figure 21: North America Breast Cancer Screening Tests Industry Revenue Share (%), by Country 2024 & 2032
- Figure 22: North America Breast Cancer Screening Tests Industry Volume Share (%), by Country 2024 & 2032
- Figure 23: MEA Breast Cancer Screening Tests Industry Revenue (Million), by Country 2024 & 2032
- Figure 24: MEA Breast Cancer Screening Tests Industry Volume (K Unit), by Country 2024 & 2032
- Figure 25: MEA Breast Cancer Screening Tests Industry Revenue Share (%), by Country 2024 & 2032
- Figure 26: MEA Breast Cancer Screening Tests Industry Volume Share (%), by Country 2024 & 2032
- Figure 27: United States Breast Cancer Screening Tests Industry Revenue (Million), by Test 2024 & 2032
- Figure 28: United States Breast Cancer Screening Tests Industry Volume (K Unit), by Test 2024 & 2032
- Figure 29: United States Breast Cancer Screening Tests Industry Revenue Share (%), by Test 2024 & 2032
- Figure 30: United States Breast Cancer Screening Tests Industry Volume Share (%), by Test 2024 & 2032
- Figure 31: United States Breast Cancer Screening Tests Industry Revenue (Million), by Geography 2024 & 2032
- Figure 32: United States Breast Cancer Screening Tests Industry Volume (K Unit), by Geography 2024 & 2032
- Figure 33: United States Breast Cancer Screening Tests Industry Revenue Share (%), by Geography 2024 & 2032
- Figure 34: United States Breast Cancer Screening Tests Industry Volume Share (%), by Geography 2024 & 2032
- Figure 35: United States Breast Cancer Screening Tests Industry Revenue (Million), by Country 2024 & 2032
- Figure 36: United States Breast Cancer Screening Tests Industry Volume (K Unit), by Country 2024 & 2032
- Figure 37: United States Breast Cancer Screening Tests Industry Revenue Share (%), by Country 2024 & 2032
- Figure 38: United States Breast Cancer Screening Tests Industry Volume Share (%), by Country 2024 & 2032
- Figure 39: Canada Breast Cancer Screening Tests Industry Revenue (Million), by Test 2024 & 2032
- Figure 40: Canada Breast Cancer Screening Tests Industry Volume (K Unit), by Test 2024 & 2032
- Figure 41: Canada Breast Cancer Screening Tests Industry Revenue Share (%), by Test 2024 & 2032
- Figure 42: Canada Breast Cancer Screening Tests Industry Volume Share (%), by Test 2024 & 2032
- Figure 43: Canada Breast Cancer Screening Tests Industry Revenue (Million), by Geography 2024 & 2032
- Figure 44: Canada Breast Cancer Screening Tests Industry Volume (K Unit), by Geography 2024 & 2032
- Figure 45: Canada Breast Cancer Screening Tests Industry Revenue Share (%), by Geography 2024 & 2032
- Figure 46: Canada Breast Cancer Screening Tests Industry Volume Share (%), by Geography 2024 & 2032
- Figure 47: Canada Breast Cancer Screening Tests Industry Revenue (Million), by Country 2024 & 2032
- Figure 48: Canada Breast Cancer Screening Tests Industry Volume (K Unit), by Country 2024 & 2032
- Figure 49: Canada Breast Cancer Screening Tests Industry Revenue Share (%), by Country 2024 & 2032
- Figure 50: Canada Breast Cancer Screening Tests Industry Volume Share (%), by Country 2024 & 2032
- Figure 51: Mexico Breast Cancer Screening Tests Industry Revenue (Million), by Test 2024 & 2032
- Figure 52: Mexico Breast Cancer Screening Tests Industry Volume (K Unit), by Test 2024 & 2032
- Figure 53: Mexico Breast Cancer Screening Tests Industry Revenue Share (%), by Test 2024 & 2032
- Figure 54: Mexico Breast Cancer Screening Tests Industry Volume Share (%), by Test 2024 & 2032
- Figure 55: Mexico Breast Cancer Screening Tests Industry Revenue (Million), by Geography 2024 & 2032
- Figure 56: Mexico Breast Cancer Screening Tests Industry Volume (K Unit), by Geography 2024 & 2032
- Figure 57: Mexico Breast Cancer Screening Tests Industry Revenue Share (%), by Geography 2024 & 2032
- Figure 58: Mexico Breast Cancer Screening Tests Industry Volume Share (%), by Geography 2024 & 2032
- Figure 59: Mexico Breast Cancer Screening Tests Industry Revenue (Million), by Country 2024 & 2032
- Figure 60: Mexico Breast Cancer Screening Tests Industry Volume (K Unit), by Country 2024 & 2032
- Figure 61: Mexico Breast Cancer Screening Tests Industry Revenue Share (%), by Country 2024 & 2032
- Figure 62: Mexico Breast Cancer Screening Tests Industry Volume Share (%), by Country 2024 & 2032
List of Tables
- Table 1: Global Breast Cancer Screening Tests Industry Revenue Million Forecast, by Region 2019 & 2032
- Table 2: Global Breast Cancer Screening Tests Industry Volume K Unit Forecast, by Region 2019 & 2032
- Table 3: Global Breast Cancer Screening Tests Industry Revenue Million Forecast, by Test 2019 & 2032
- Table 4: Global Breast Cancer Screening Tests Industry Volume K Unit Forecast, by Test 2019 & 2032
- Table 5: Global Breast Cancer Screening Tests Industry Revenue Million Forecast, by Geography 2019 & 2032
- Table 6: Global Breast Cancer Screening Tests Industry Volume K Unit Forecast, by Geography 2019 & 2032
- Table 7: Global Breast Cancer Screening Tests Industry Revenue Million Forecast, by Region 2019 & 2032
- Table 8: Global Breast Cancer Screening Tests Industry Volume K Unit Forecast, by Region 2019 & 2032
- Table 9: Global Breast Cancer Screening Tests Industry Revenue Million Forecast, by Country 2019 & 2032
- Table 10: Global Breast Cancer Screening Tests Industry Volume K Unit Forecast, by Country 2019 & 2032
- Table 11: United States Breast Cancer Screening Tests Industry Revenue (Million) Forecast, by Application 2019 & 2032
- Table 12: United States Breast Cancer Screening Tests Industry Volume (K Unit) Forecast, by Application 2019 & 2032
- Table 13: Canada Breast Cancer Screening Tests Industry Revenue (Million) Forecast, by Application 2019 & 2032
- Table 14: Canada Breast Cancer Screening Tests Industry Volume (K Unit) Forecast, by Application 2019 & 2032
- Table 15: Mexico Breast Cancer Screening Tests Industry Revenue (Million) Forecast, by Application 2019 & 2032
- Table 16: Mexico Breast Cancer Screening Tests Industry Volume (K Unit) Forecast, by Application 2019 & 2032
- Table 17: Global Breast Cancer Screening Tests Industry Revenue Million Forecast, by Country 2019 & 2032
- Table 18: Global Breast Cancer Screening Tests Industry Volume K Unit Forecast, by Country 2019 & 2032
- Table 19: Germany Breast Cancer Screening Tests Industry Revenue (Million) Forecast, by Application 2019 & 2032
- Table 20: Germany Breast Cancer Screening Tests Industry Volume (K Unit) Forecast, by Application 2019 & 2032
- Table 21: United Kingdom Breast Cancer Screening Tests Industry Revenue (Million) Forecast, by Application 2019 & 2032
- Table 22: United Kingdom Breast Cancer Screening Tests Industry Volume (K Unit) Forecast, by Application 2019 & 2032
- Table 23: France Breast Cancer Screening Tests Industry Revenue (Million) Forecast, by Application 2019 & 2032
- Table 24: France Breast Cancer Screening Tests Industry Volume (K Unit) Forecast, by Application 2019 & 2032
- Table 25: Spain Breast Cancer Screening Tests Industry Revenue (Million) Forecast, by Application 2019 & 2032
- Table 26: Spain Breast Cancer Screening Tests Industry Volume (K Unit) Forecast, by Application 2019 & 2032
- Table 27: Italy Breast Cancer Screening Tests Industry Revenue (Million) Forecast, by Application 2019 & 2032
- Table 28: Italy Breast Cancer Screening Tests Industry Volume (K Unit) Forecast, by Application 2019 & 2032
- Table 29: Spain Breast Cancer Screening Tests Industry Revenue (Million) Forecast, by Application 2019 & 2032
- Table 30: Spain Breast Cancer Screening Tests Industry Volume (K Unit) Forecast, by Application 2019 & 2032
- Table 31: Belgium Breast Cancer Screening Tests Industry Revenue (Million) Forecast, by Application 2019 & 2032
- Table 32: Belgium Breast Cancer Screening Tests Industry Volume (K Unit) Forecast, by Application 2019 & 2032
- Table 33: Netherland Breast Cancer Screening Tests Industry Revenue (Million) Forecast, by Application 2019 & 2032
- Table 34: Netherland Breast Cancer Screening Tests Industry Volume (K Unit) Forecast, by Application 2019 & 2032
- Table 35: Nordics Breast Cancer Screening Tests Industry Revenue (Million) Forecast, by Application 2019 & 2032
- Table 36: Nordics Breast Cancer Screening Tests Industry Volume (K Unit) Forecast, by Application 2019 & 2032
- Table 37: Rest of Europe Breast Cancer Screening Tests Industry Revenue (Million) Forecast, by Application 2019 & 2032
- Table 38: Rest of Europe Breast Cancer Screening Tests Industry Volume (K Unit) Forecast, by Application 2019 & 2032
- Table 39: Global Breast Cancer Screening Tests Industry Revenue Million Forecast, by Country 2019 & 2032
- Table 40: Global Breast Cancer Screening Tests Industry Volume K Unit Forecast, by Country 2019 & 2032
- Table 41: China Breast Cancer Screening Tests Industry Revenue (Million) Forecast, by Application 2019 & 2032
- Table 42: China Breast Cancer Screening Tests Industry Volume (K Unit) Forecast, by Application 2019 & 2032
- Table 43: Japan Breast Cancer Screening Tests Industry Revenue (Million) Forecast, by Application 2019 & 2032
- Table 44: Japan Breast Cancer Screening Tests Industry Volume (K Unit) Forecast, by Application 2019 & 2032
- Table 45: India Breast Cancer Screening Tests Industry Revenue (Million) Forecast, by Application 2019 & 2032
- Table 46: India Breast Cancer Screening Tests Industry Volume (K Unit) Forecast, by Application 2019 & 2032
- Table 47: South Korea Breast Cancer Screening Tests Industry Revenue (Million) Forecast, by Application 2019 & 2032
- Table 48: South Korea Breast Cancer Screening Tests Industry Volume (K Unit) Forecast, by Application 2019 & 2032
- Table 49: Southeast Asia Breast Cancer Screening Tests Industry Revenue (Million) Forecast, by Application 2019 & 2032
- Table 50: Southeast Asia Breast Cancer Screening Tests Industry Volume (K Unit) Forecast, by Application 2019 & 2032
- Table 51: Australia Breast Cancer Screening Tests Industry Revenue (Million) Forecast, by Application 2019 & 2032
- Table 52: Australia Breast Cancer Screening Tests Industry Volume (K Unit) Forecast, by Application 2019 & 2032
- Table 53: Indonesia Breast Cancer Screening Tests Industry Revenue (Million) Forecast, by Application 2019 & 2032
- Table 54: Indonesia Breast Cancer Screening Tests Industry Volume (K Unit) Forecast, by Application 2019 & 2032
- Table 55: Phillipes Breast Cancer Screening Tests Industry Revenue (Million) Forecast, by Application 2019 & 2032
- Table 56: Phillipes Breast Cancer Screening Tests Industry Volume (K Unit) Forecast, by Application 2019 & 2032
- Table 57: Singapore Breast Cancer Screening Tests Industry Revenue (Million) Forecast, by Application 2019 & 2032
- Table 58: Singapore Breast Cancer Screening Tests Industry Volume (K Unit) Forecast, by Application 2019 & 2032
- Table 59: Thailandc Breast Cancer Screening Tests Industry Revenue (Million) Forecast, by Application 2019 & 2032
- Table 60: Thailandc Breast Cancer Screening Tests Industry Volume (K Unit) Forecast, by Application 2019 & 2032
- Table 61: Rest of Asia Pacific Breast Cancer Screening Tests Industry Revenue (Million) Forecast, by Application 2019 & 2032
- Table 62: Rest of Asia Pacific Breast Cancer Screening Tests Industry Volume (K Unit) Forecast, by Application 2019 & 2032
- Table 63: Global Breast Cancer Screening Tests Industry Revenue Million Forecast, by Country 2019 & 2032
- Table 64: Global Breast Cancer Screening Tests Industry Volume K Unit Forecast, by Country 2019 & 2032
- Table 65: Brazil Breast Cancer Screening Tests Industry Revenue (Million) Forecast, by Application 2019 & 2032
- Table 66: Brazil Breast Cancer Screening Tests Industry Volume (K Unit) Forecast, by Application 2019 & 2032
- Table 67: Argentina Breast Cancer Screening Tests Industry Revenue (Million) Forecast, by Application 2019 & 2032
- Table 68: Argentina Breast Cancer Screening Tests Industry Volume (K Unit) Forecast, by Application 2019 & 2032
- Table 69: Peru Breast Cancer Screening Tests Industry Revenue (Million) Forecast, by Application 2019 & 2032
- Table 70: Peru Breast Cancer Screening Tests Industry Volume (K Unit) Forecast, by Application 2019 & 2032
- Table 71: Chile Breast Cancer Screening Tests Industry Revenue (Million) Forecast, by Application 2019 & 2032
- Table 72: Chile Breast Cancer Screening Tests Industry Volume (K Unit) Forecast, by Application 2019 & 2032
- Table 73: Colombia Breast Cancer Screening Tests Industry Revenue (Million) Forecast, by Application 2019 & 2032
- Table 74: Colombia Breast Cancer Screening Tests Industry Volume (K Unit) Forecast, by Application 2019 & 2032
- Table 75: Ecuador Breast Cancer Screening Tests Industry Revenue (Million) Forecast, by Application 2019 & 2032
- Table 76: Ecuador Breast Cancer Screening Tests Industry Volume (K Unit) Forecast, by Application 2019 & 2032
- Table 77: Venezuela Breast Cancer Screening Tests Industry Revenue (Million) Forecast, by Application 2019 & 2032
- Table 78: Venezuela Breast Cancer Screening Tests Industry Volume (K Unit) Forecast, by Application 2019 & 2032
- Table 79: Rest of South America Breast Cancer Screening Tests Industry Revenue (Million) Forecast, by Application 2019 & 2032
- Table 80: Rest of South America Breast Cancer Screening Tests Industry Volume (K Unit) Forecast, by Application 2019 & 2032
- Table 81: Global Breast Cancer Screening Tests Industry Revenue Million Forecast, by Country 2019 & 2032
- Table 82: Global Breast Cancer Screening Tests Industry Volume K Unit Forecast, by Country 2019 & 2032
- Table 83: United States Breast Cancer Screening Tests Industry Revenue (Million) Forecast, by Application 2019 & 2032
- Table 84: United States Breast Cancer Screening Tests Industry Volume (K Unit) Forecast, by Application 2019 & 2032
- Table 85: Canada Breast Cancer Screening Tests Industry Revenue (Million) Forecast, by Application 2019 & 2032
- Table 86: Canada Breast Cancer Screening Tests Industry Volume (K Unit) Forecast, by Application 2019 & 2032
- Table 87: Mexico Breast Cancer Screening Tests Industry Revenue (Million) Forecast, by Application 2019 & 2032
- Table 88: Mexico Breast Cancer Screening Tests Industry Volume (K Unit) Forecast, by Application 2019 & 2032
- Table 89: Global Breast Cancer Screening Tests Industry Revenue Million Forecast, by Country 2019 & 2032
- Table 90: Global Breast Cancer Screening Tests Industry Volume K Unit Forecast, by Country 2019 & 2032
- Table 91: United Arab Emirates Breast Cancer Screening Tests Industry Revenue (Million) Forecast, by Application 2019 & 2032
- Table 92: United Arab Emirates Breast Cancer Screening Tests Industry Volume (K Unit) Forecast, by Application 2019 & 2032
- Table 93: Saudi Arabia Breast Cancer Screening Tests Industry Revenue (Million) Forecast, by Application 2019 & 2032
- Table 94: Saudi Arabia Breast Cancer Screening Tests Industry Volume (K Unit) Forecast, by Application 2019 & 2032
- Table 95: South Africa Breast Cancer Screening Tests Industry Revenue (Million) Forecast, by Application 2019 & 2032
- Table 96: South Africa Breast Cancer Screening Tests Industry Volume (K Unit) Forecast, by Application 2019 & 2032
- Table 97: Rest of Middle East and Africa Breast Cancer Screening Tests Industry Revenue (Million) Forecast, by Application 2019 & 2032
- Table 98: Rest of Middle East and Africa Breast Cancer Screening Tests Industry Volume (K Unit) Forecast, by Application 2019 & 2032
- Table 99: Global Breast Cancer Screening Tests Industry Revenue Million Forecast, by Test 2019 & 2032
- Table 100: Global Breast Cancer Screening Tests Industry Volume K Unit Forecast, by Test 2019 & 2032
- Table 101: Global Breast Cancer Screening Tests Industry Revenue Million Forecast, by Geography 2019 & 2032
- Table 102: Global Breast Cancer Screening Tests Industry Volume K Unit Forecast, by Geography 2019 & 2032
- Table 103: Global Breast Cancer Screening Tests Industry Revenue Million Forecast, by Country 2019 & 2032
- Table 104: Global Breast Cancer Screening Tests Industry Volume K Unit Forecast, by Country 2019 & 2032
- Table 105: Global Breast Cancer Screening Tests Industry Revenue Million Forecast, by Test 2019 & 2032
- Table 106: Global Breast Cancer Screening Tests Industry Volume K Unit Forecast, by Test 2019 & 2032
- Table 107: Global Breast Cancer Screening Tests Industry Revenue Million Forecast, by Geography 2019 & 2032
- Table 108: Global Breast Cancer Screening Tests Industry Volume K Unit Forecast, by Geography 2019 & 2032
- Table 109: Global Breast Cancer Screening Tests Industry Revenue Million Forecast, by Country 2019 & 2032
- Table 110: Global Breast Cancer Screening Tests Industry Volume K Unit Forecast, by Country 2019 & 2032
- Table 111: Global Breast Cancer Screening Tests Industry Revenue Million Forecast, by Test 2019 & 2032
- Table 112: Global Breast Cancer Screening Tests Industry Volume K Unit Forecast, by Test 2019 & 2032
- Table 113: Global Breast Cancer Screening Tests Industry Revenue Million Forecast, by Geography 2019 & 2032
- Table 114: Global Breast Cancer Screening Tests Industry Volume K Unit Forecast, by Geography 2019 & 2032
- Table 115: Global Breast Cancer Screening Tests Industry Revenue Million Forecast, by Country 2019 & 2032
- Table 116: Global Breast Cancer Screening Tests Industry Volume K Unit Forecast, by Country 2019 & 2032
Frequently Asked Questions
1. What is the projected Compound Annual Growth Rate (CAGR) of the Breast Cancer Screening Tests Industry?
The projected CAGR is approximately 8.44%.
2. Which companies are prominent players in the Breast Cancer Screening Tests Industry?
Key companies in the market include Quest Diagnostics Incorporated, QIAGEN NV, Aurora Healthcare US Corp, Siemens Healthineers, GE Healthcare, Hologic Inc, Analogic Corporation, Agendia Inc , Myriad Genetics, Allengers Medical Systems Limited, Fujifilm Holdings Corporation.
3. What are the main segments of the Breast Cancer Screening Tests Industry?
The market segments include Test, Geography.
4. Can you provide details about the market size?
The market size is estimated to be USD XX Million as of 2022.
5. What are some drivers contributing to market growth?
Rising Incidence of Breast Cancer; Technological Advancements in Breast Cancer Screening.
6. What are the notable trends driving market growth?
Mammogram is Expected to Hold a Significant Share Over the Forecast Period.
7. Are there any restraints impacting market growth?
Controversies Related to Mammography; Side Effects of Radiation during Screening Tests and Errors in Screening.
8. Can you provide examples of recent developments in the market?
February 2023: To transform breast care with automated imaging and artificial intelligence (AI), Abdul Latif Jameel Health signed a distribution agreement with iSono Health, a medical technology company in San Francisco, US.
9. What pricing options are available for accessing the report?
Pricing options include single-user, multi-user, and enterprise licenses priced at USD 4750, USD 5250, and USD 8750 respectively.
10. Is the market size provided in terms of value or volume?
The market size is provided in terms of value, measured in Million and volume, measured in K Unit.
11. Are there any specific market keywords associated with the report?
Yes, the market keyword associated with the report is "Breast Cancer Screening Tests Industry," which aids in identifying and referencing the specific market segment covered.
12. How do I determine which pricing option suits my needs best?
The pricing options vary based on user requirements and access needs. Individual users may opt for single-user licenses, while businesses requiring broader access may choose multi-user or enterprise licenses for cost-effective access to the report.
13. Are there any additional resources or data provided in the Breast Cancer Screening Tests Industry report?
While the report offers comprehensive insights, it's advisable to review the specific contents or supplementary materials provided to ascertain if additional resources or data are available.
14. How can I stay updated on further developments or reports in the Breast Cancer Screening Tests Industry?
To stay informed about further developments, trends, and reports in the Breast Cancer Screening Tests Industry, consider subscribing to industry newsletters, following relevant companies and organizations, or regularly checking reputable industry news sources and publications.
Methodology
Step 1 - Identification of Relevant Samples Size from Population Database


Step 2 - Approaches for Defining Global Market Size (Value, Volume* & Price*)

Note*: In applicable scenarios
Step 3 - Data Sources
Primary Research
- Web Analytics
- Survey Reports
- Research Institute
- Latest Research Reports
- Opinion Leaders
Secondary Research
- Annual Reports
- White Paper
- Latest Press Release
- Industry Association
- Paid Database
- Investor Presentations

Step 4 - Data Triangulation
Involves using different sources of information in order to increase the validity of a study
These sources are likely to be stakeholders in a program - participants, other researchers, program staff, other community members, and so on.
Then we put all data in single framework & apply various statistical tools to find out the dynamic on the market.
During the analysis stage, feedback from the stakeholder groups would be compared to determine areas of agreement as well as areas of divergence


