
Key Insights
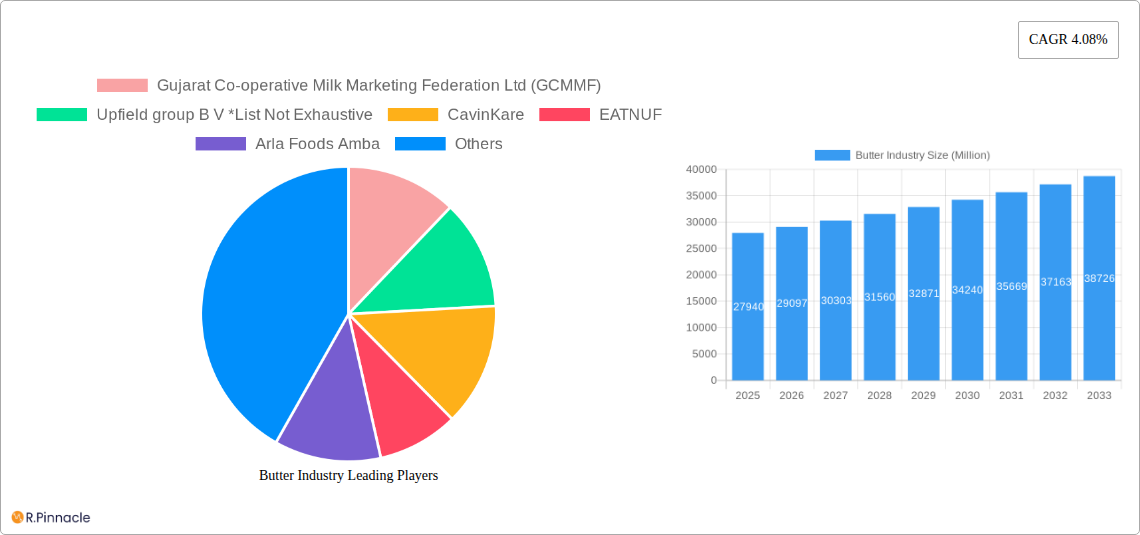
The global butter market, valued at $27.94 billion in 2025, is projected to experience steady growth, driven by increasing consumer demand for dairy products and the rising popularity of butter in baking and culinary applications. The market's Compound Annual Growth Rate (CAGR) of 4.08% from 2019 to 2024 suggests a continued expansion through 2033. Key growth drivers include the rising disposable incomes in developing economies leading to increased consumption of dairy products and a shift towards premium and specialty butters, catering to health-conscious consumers seeking products with higher fat content or specific sourcing (e.g., grass-fed). The market is segmented by product type (cultured and uncultured) and distribution channels (supermarkets/hypermarkets, convenience stores, online retail, and others). While supermarkets/hypermarkets currently dominate the distribution landscape, the online retail segment is showing significant growth potential, fueled by the increasing adoption of e-commerce and online grocery shopping. Market restraints include fluctuating milk prices, concerns about saturated fat content, and the increasing availability of butter substitutes. However, the industry is adapting by offering innovative products like organic, grass-fed, and flavored butters to address these challenges and attract a wider consumer base. Major players like GCMMF, Upfield, CavinKare, and Arla Foods are actively competing through brand building, product diversification, and strategic partnerships to capture market share in various regions. The Asia-Pacific region, particularly India and China, presents significant growth opportunities due to rising population and increasing demand for dairy products.
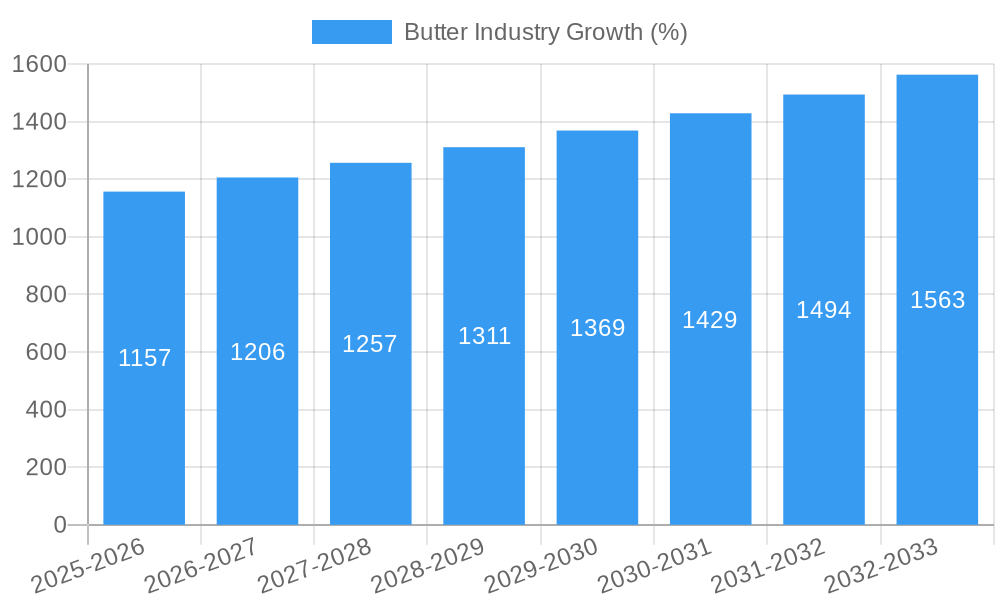
The forecast period of 2025-2033 presents opportunities for market expansion. Based on the historical CAGR and considering the predicted rise in demand for dairy and specialty butter, market penetration in developing nations, and the growth of online channels, a conservative estimate suggests a continued growth trend, with a possible increase in the CAGR for the forecast period. This expansion will be influenced by factors like consumer preferences, economic growth in key markets, and successful marketing strategies employed by major players. The continued diversification of products and distribution channels will be crucial in sustaining this growth trajectory. Furthermore, adapting to and mitigating the impact of fluctuating milk prices and addressing consumer health concerns will be key to maximizing profits in the long run.
Butter Industry Market Report: 2019-2033
This comprehensive report provides an in-depth analysis of the global butter industry, offering valuable insights for industry professionals, investors, and stakeholders. With a focus on market trends, competitive dynamics, and future growth potential, this report covers the period from 2019 to 2033, with a base year of 2025 and a forecast period from 2025 to 2033. The global butter market is projected to reach xx Million by 2033, exhibiting a CAGR of xx% during the forecast period.
Butter Industry Market Structure & Innovation Trends
This section analyzes the market concentration, innovation drivers, regulatory frameworks, product substitutes, end-user demographics, and M&A activities within the global butter industry. The market is characterized by a mix of large multinational players and regional producers, resulting in a moderately concentrated market structure. Key players such as GCMMF, Upfield, and Arla Foods hold significant market share, estimated at xx Million, xx Million, and xx Million respectively in 2024.
- Market Concentration: The market exhibits moderate concentration with a few dominant players commanding a significant portion of the market share. Smaller regional players cater to niche markets and local preferences.
- Innovation Drivers: Growing consumer demand for healthier and more convenient butter products, coupled with technological advancements in production and packaging, are major innovation drivers. Increased focus on sustainability and organic options is also influencing innovation.
- Regulatory Frameworks: Government regulations concerning food safety, labeling, and environmental standards impact the industry. These regulations vary across countries, influencing production and distribution.
- Product Substitutes: Margarine and other plant-based spreads pose a competitive challenge to butter, particularly in health-conscious consumer segments.
- End-User Demographics: The demand for butter is driven by diverse end-user demographics, with varying preferences for butter types (cultured vs. uncultured) and consumption patterns. Market segmentation by consumer demographics is crucial for effective targeting.
- M&A Activities: Recent M&A activities, such as Arla Foods' acquisition of Massby Facility and Service, indicate consolidation in the sector. The total value of M&A deals in the butter industry from 2019-2024 is estimated to be approximately xx Million.
Butter Industry Market Dynamics & Trends
This section explores the market growth drivers, technological disruptions, consumer preferences, and competitive dynamics shaping the butter industry. The market exhibits strong growth, driven by factors such as increasing disposable incomes in developing economies, changing dietary habits (particularly in Asia), and the growing popularity of butter in various culinary applications. The market penetration of butter in emerging markets is expected to significantly increase over the forecast period.
- Market Growth Drivers: Rising disposable incomes, changing consumer preferences (toward premium and organic products), and increasing adoption of butter in food service industry.
- Technological Disruptions: Automation in butter production, advanced packaging technologies, and improved quality control measures significantly improve efficiency and product quality.
- Consumer Preferences: Growing preference for natural and organic products, as well as convenient packaging formats, are influencing consumer choices and driving market segmentation.
- Competitive Dynamics: Intense competition among major players is forcing companies to adopt innovative strategies, focus on product differentiation, and expand their distribution networks to maintain market share.
Dominant Regions & Segments in Butter Industry
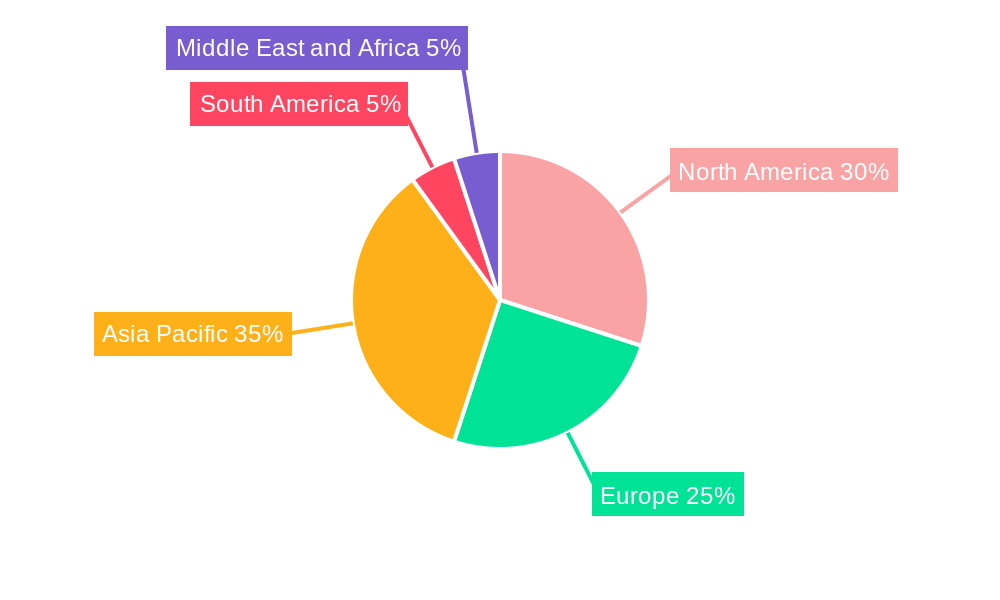
This section highlights the leading regions and segments within the butter industry. Based on our analysis, North America and Europe are the leading regions, holding a significant share of the global butter market. Within product types, both cultured and uncultured butter hold strong positions, with cultured butter exhibiting slightly faster growth, mainly due to a growing preference for flavored butter products. Supermarkets and hypermarkets are the dominant distribution channels.
- Key Drivers for Dominant Regions:
- North America: Strong consumer demand, well-established distribution networks, and high per capita consumption of butter.
- Europe: Large dairy production capacity, well-developed food processing industry, and a significant demand for butter in various food products.
- Key Drivers for Dominant Segments:
- Cultured Butter: Growing preference for flavored and specialty butter products.
- Uncultured Butter: Wide use in baking and other culinary applications.
- Supermarkets/Hypermarkets: Wide product availability, convenient purchasing, and a large customer base.
Butter Industry Product Innovations
Recent product innovations focus on enhancing convenience, health, and taste. New packaging formats, such as Bregott's recent launch of 250g, 500g, and 750g packages, cater to diverse consumer needs. The introduction of organic and grass-fed butter variants meets increasing consumer demand for health-conscious products. Furthermore, the development of flavored and specialty butters caters to evolving taste preferences and broadens market appeal.
Report Scope & Segmentation Analysis
This report segments the butter market by product type (Cultured Butter, Uncultured Butter) and distribution channel (Supermarkets/Hypermarkets, Convenience/Grocery Stores, Online Retail Stores, Other Distribution Channels). Each segment’s growth projection, market size, and competitive dynamics are analyzed in detail. The cultured butter segment is projected to grow at xx% CAGR during the forecast period, driven by the increasing popularity of flavored and specialty butters. The supermarkets/hypermarkets segment is expected to maintain its dominance, due to high consumer preference for convenience and wide product availability.
Key Drivers of Butter Industry Growth
Key drivers of butter industry growth include rising disposable incomes, particularly in developing economies, along with the increasing demand for convenience foods and ready-to-eat meals, where butter is often a key ingredient. Furthermore, favorable government policies promoting the dairy industry and technological advancements leading to increased production efficiency also contribute to market growth. Finally, a growing focus on natural and organic butter products supports market expansion.
Challenges in the Butter Industry Sector
The butter industry faces challenges such as fluctuations in milk prices, which directly impact production costs and profitability. Supply chain disruptions, including transportation and logistics challenges, can also impact market stability. Moreover, intense competition from margarine and other substitutes poses a significant challenge. Finally, stringent food safety regulations and the increasing cost of raw materials affect profitability.
Emerging Opportunities in Butter Industry
Emerging opportunities include the growing demand for premium and specialty butters, particularly flavored and organic variants. Expanding into new markets in developing economies with rising disposable incomes offers significant growth potential. Exploring innovative packaging solutions to enhance product shelf-life and convenience can also create new opportunities. Lastly, increased use of butter in food service and quick-service restaurants provides a potential avenue for growth.
Leading Players in the Butter Industry Market
- Gujarat Co-operative Milk Marketing Federation Ltd (GCMMF)
- Upfield group B V
- CavinKare
- EATNUF
- Arla Foods Amba
- Dairy Farmers of America Inc
- Land O' Lakes Inc
- Fonterra Co-operative Group
- CROPP Cooperative (Organic Valley)
- Ornua Co-operative Ltd
Key Developments in Butter Industry
- January 2024: Bregott launched three new package sizes (250g, 500g, 750g), expanding its product portfolio and catering to diverse consumer needs.
- January 2024: Arla Foods AMBA increased its stake in Massby Facility and Service to 100%, indicating further consolidation within the industry.
- October 2023: Ornua Co-operative invested EUR 40 Million in its Kerrygold Park facility, enhancing its production capacity and expanding its product offerings.
Future Outlook for Butter Industry Market
The future outlook for the butter industry remains positive, driven by increasing consumer demand for high-quality and convenient butter products. The market is expected to witness strong growth, particularly in developing economies, fueled by rising disposable incomes and changing dietary preferences. Innovative product development and expansion into new market segments will be crucial for companies to capitalize on future growth opportunities.
Butter Industry Segmentation
-
1. Product Type
- 1.1. Cultured Butter
- 1.2. Uncultured Butter
-
2. Distribution Channel
- 2.1. Supermarkets/Hypermarkets
- 2.2. Convenience/Grocery Stores
- 2.3. Online Retail Stores
- 2.4. Other Distribution Channels
Butter Industry Segmentation By Geography
-
1. North America
- 1.1. United States
- 1.2. Canada
- 1.3. Mexico
- 1.4. Rest of North America
-
2. Europe
- 2.1. Spain
- 2.2. United Kingdom
- 2.3. Germany
- 2.4. France
- 2.5. Italy
- 2.6. Netherlands
- 2.7. Rest of Europe
-
3. Asia Pacific
- 3.1. China
- 3.2. Japan
- 3.3. India
- 3.4. Australia
- 3.5. Rest of Asia Pacific
-
4. South America
- 4.1. Brazil
- 4.2. Argentina
- 4.3. Rest of South America
-
5. Middle East and Africa
- 5.1. South Africa
- 5.2. United Arab Emirates
- 5.3. Rest of Middle East and Africa
Butter Industry REPORT HIGHLIGHTS
| Aspects | Details |
|---|---|
| Study Period | 2019-2033 |
| Base Year | 2024 |
| Estimated Year | 2025 |
| Forecast Period | 2025-2033 |
| Historical Period | 2019-2024 |
| Growth Rate | CAGR of 4.08% from 2019-2033 |
| Segmentation |
|
Table of Contents
- 1. Introduction
- 1.1. Research Scope
- 1.2. Market Segmentation
- 1.3. Research Methodology
- 1.4. Definitions and Assumptions
- 2. Executive Summary
- 2.1. Introduction
- 3. Market Dynamics
- 3.1. Introduction
- 3.2. Market Drivers
- 3.2.1. Consumer Inclination Toward Natural/Organic Food Products; Flavor Diversification Driving the Market
- 3.3. Market Restrains
- 3.3.1. Adverse Health Impacts of High-Fat Content in Butter
- 3.4. Market Trends
- 3.4.1. Consumer Inclination Toward Natural/Organic Food Products
- 4. Market Factor Analysis
- 4.1. Porters Five Forces
- 4.2. Supply/Value Chain
- 4.3. PESTEL analysis
- 4.4. Market Entropy
- 4.5. Patent/Trademark Analysis
- 5. Global Butter Industry Analysis, Insights and Forecast, 2019-2031
- 5.1. Market Analysis, Insights and Forecast - by Product Type
- 5.1.1. Cultured Butter
- 5.1.2. Uncultured Butter
- 5.2. Market Analysis, Insights and Forecast - by Distribution Channel
- 5.2.1. Supermarkets/Hypermarkets
- 5.2.2. Convenience/Grocery Stores
- 5.2.3. Online Retail Stores
- 5.2.4. Other Distribution Channels
- 5.3. Market Analysis, Insights and Forecast - by Region
- 5.3.1. North America
- 5.3.2. Europe
- 5.3.3. Asia Pacific
- 5.3.4. South America
- 5.3.5. Middle East and Africa
- 5.1. Market Analysis, Insights and Forecast - by Product Type
- 6. North America Butter Industry Analysis, Insights and Forecast, 2019-2031
- 6.1. Market Analysis, Insights and Forecast - by Product Type
- 6.1.1. Cultured Butter
- 6.1.2. Uncultured Butter
- 6.2. Market Analysis, Insights and Forecast - by Distribution Channel
- 6.2.1. Supermarkets/Hypermarkets
- 6.2.2. Convenience/Grocery Stores
- 6.2.3. Online Retail Stores
- 6.2.4. Other Distribution Channels
- 6.1. Market Analysis, Insights and Forecast - by Product Type
- 7. Europe Butter Industry Analysis, Insights and Forecast, 2019-2031
- 7.1. Market Analysis, Insights and Forecast - by Product Type
- 7.1.1. Cultured Butter
- 7.1.2. Uncultured Butter
- 7.2. Market Analysis, Insights and Forecast - by Distribution Channel
- 7.2.1. Supermarkets/Hypermarkets
- 7.2.2. Convenience/Grocery Stores
- 7.2.3. Online Retail Stores
- 7.2.4. Other Distribution Channels
- 7.1. Market Analysis, Insights and Forecast - by Product Type
- 8. Asia Pacific Butter Industry Analysis, Insights and Forecast, 2019-2031
- 8.1. Market Analysis, Insights and Forecast - by Product Type
- 8.1.1. Cultured Butter
- 8.1.2. Uncultured Butter
- 8.2. Market Analysis, Insights and Forecast - by Distribution Channel
- 8.2.1. Supermarkets/Hypermarkets
- 8.2.2. Convenience/Grocery Stores
- 8.2.3. Online Retail Stores
- 8.2.4. Other Distribution Channels
- 8.1. Market Analysis, Insights and Forecast - by Product Type
- 9. South America Butter Industry Analysis, Insights and Forecast, 2019-2031
- 9.1. Market Analysis, Insights and Forecast - by Product Type
- 9.1.1. Cultured Butter
- 9.1.2. Uncultured Butter
- 9.2. Market Analysis, Insights and Forecast - by Distribution Channel
- 9.2.1. Supermarkets/Hypermarkets
- 9.2.2. Convenience/Grocery Stores
- 9.2.3. Online Retail Stores
- 9.2.4. Other Distribution Channels
- 9.1. Market Analysis, Insights and Forecast - by Product Type
- 10. Middle East and Africa Butter Industry Analysis, Insights and Forecast, 2019-2031
- 10.1. Market Analysis, Insights and Forecast - by Product Type
- 10.1.1. Cultured Butter
- 10.1.2. Uncultured Butter
- 10.2. Market Analysis, Insights and Forecast - by Distribution Channel
- 10.2.1. Supermarkets/Hypermarkets
- 10.2.2. Convenience/Grocery Stores
- 10.2.3. Online Retail Stores
- 10.2.4. Other Distribution Channels
- 10.1. Market Analysis, Insights and Forecast - by Product Type
- 11. North America Butter Industry Analysis, Insights and Forecast, 2019-2031
- 11.1. Market Analysis, Insights and Forecast - By Country/Sub-region
- 11.1.1 United States
- 11.1.2 Canada
- 11.1.3 Mexico
- 11.1.4 Rest of North America
- 12. Europe Butter Industry Analysis, Insights and Forecast, 2019-2031
- 12.1. Market Analysis, Insights and Forecast - By Country/Sub-region
- 12.1.1 Spain
- 12.1.2 United Kingdom
- 12.1.3 Germany
- 12.1.4 France
- 12.1.5 Italy
- 12.1.6 Netherlands
- 12.1.7 Rest of Europe
- 13. Asia Pacific Butter Industry Analysis, Insights and Forecast, 2019-2031
- 13.1. Market Analysis, Insights and Forecast - By Country/Sub-region
- 13.1.1 China
- 13.1.2 Japan
- 13.1.3 India
- 13.1.4 Australia
- 13.1.5 Rest of Asia Pacific
- 14. South America Butter Industry Analysis, Insights and Forecast, 2019-2031
- 14.1. Market Analysis, Insights and Forecast - By Country/Sub-region
- 14.1.1 Brazil
- 14.1.2 Argentina
- 14.1.3 Rest of South America
- 15. Middle East and Africa Butter Industry Analysis, Insights and Forecast, 2019-2031
- 15.1. Market Analysis, Insights and Forecast - By Country/Sub-region
- 15.1.1 South Africa
- 15.1.2 United Arab Emirates
- 15.1.3 Rest of Middle East and Africa
- 16. Competitive Analysis
- 16.1. Global Market Share Analysis 2024
- 16.2. Company Profiles
- 16.2.1 Gujarat Co-operative Milk Marketing Federation Ltd (GCMMF)
- 16.2.1.1. Overview
- 16.2.1.2. Products
- 16.2.1.3. SWOT Analysis
- 16.2.1.4. Recent Developments
- 16.2.1.5. Financials (Based on Availability)
- 16.2.2 Upfield group B V *List Not Exhaustive
- 16.2.2.1. Overview
- 16.2.2.2. Products
- 16.2.2.3. SWOT Analysis
- 16.2.2.4. Recent Developments
- 16.2.2.5. Financials (Based on Availability)
- 16.2.3 CavinKare
- 16.2.3.1. Overview
- 16.2.3.2. Products
- 16.2.3.3. SWOT Analysis
- 16.2.3.4. Recent Developments
- 16.2.3.5. Financials (Based on Availability)
- 16.2.4 EATNUF
- 16.2.4.1. Overview
- 16.2.4.2. Products
- 16.2.4.3. SWOT Analysis
- 16.2.4.4. Recent Developments
- 16.2.4.5. Financials (Based on Availability)
- 16.2.5 Arla Foods Amba
- 16.2.5.1. Overview
- 16.2.5.2. Products
- 16.2.5.3. SWOT Analysis
- 16.2.5.4. Recent Developments
- 16.2.5.5. Financials (Based on Availability)
- 16.2.6 Dairy Farmers of America Inc
- 16.2.6.1. Overview
- 16.2.6.2. Products
- 16.2.6.3. SWOT Analysis
- 16.2.6.4. Recent Developments
- 16.2.6.5. Financials (Based on Availability)
- 16.2.7 Land O' Lakes Inc
- 16.2.7.1. Overview
- 16.2.7.2. Products
- 16.2.7.3. SWOT Analysis
- 16.2.7.4. Recent Developments
- 16.2.7.5. Financials (Based on Availability)
- 16.2.8 Fonterra Co-operative Group
- 16.2.8.1. Overview
- 16.2.8.2. Products
- 16.2.8.3. SWOT Analysis
- 16.2.8.4. Recent Developments
- 16.2.8.5. Financials (Based on Availability)
- 16.2.9 CROPP Cooperative (Organic Valley)
- 16.2.9.1. Overview
- 16.2.9.2. Products
- 16.2.9.3. SWOT Analysis
- 16.2.9.4. Recent Developments
- 16.2.9.5. Financials (Based on Availability)
- 16.2.10 Ornua Co-operative Ltd
- 16.2.10.1. Overview
- 16.2.10.2. Products
- 16.2.10.3. SWOT Analysis
- 16.2.10.4. Recent Developments
- 16.2.10.5. Financials (Based on Availability)
- 16.2.1 Gujarat Co-operative Milk Marketing Federation Ltd (GCMMF)
List of Figures
- Figure 1: Global Butter Industry Revenue Breakdown (Million, %) by Region 2024 & 2032
- Figure 2: Global Butter Industry Volume Breakdown (K Units, %) by Region 2024 & 2032
- Figure 3: North America Butter Industry Revenue (Million), by Country 2024 & 2032
- Figure 4: North America Butter Industry Volume (K Units), by Country 2024 & 2032
- Figure 5: North America Butter Industry Revenue Share (%), by Country 2024 & 2032
- Figure 6: North America Butter Industry Volume Share (%), by Country 2024 & 2032
- Figure 7: Europe Butter Industry Revenue (Million), by Country 2024 & 2032
- Figure 8: Europe Butter Industry Volume (K Units), by Country 2024 & 2032
- Figure 9: Europe Butter Industry Revenue Share (%), by Country 2024 & 2032
- Figure 10: Europe Butter Industry Volume Share (%), by Country 2024 & 2032
- Figure 11: Asia Pacific Butter Industry Revenue (Million), by Country 2024 & 2032
- Figure 12: Asia Pacific Butter Industry Volume (K Units), by Country 2024 & 2032
- Figure 13: Asia Pacific Butter Industry Revenue Share (%), by Country 2024 & 2032
- Figure 14: Asia Pacific Butter Industry Volume Share (%), by Country 2024 & 2032
- Figure 15: South America Butter Industry Revenue (Million), by Country 2024 & 2032
- Figure 16: South America Butter Industry Volume (K Units), by Country 2024 & 2032
- Figure 17: South America Butter Industry Revenue Share (%), by Country 2024 & 2032
- Figure 18: South America Butter Industry Volume Share (%), by Country 2024 & 2032
- Figure 19: Middle East and Africa Butter Industry Revenue (Million), by Country 2024 & 2032
- Figure 20: Middle East and Africa Butter Industry Volume (K Units), by Country 2024 & 2032
- Figure 21: Middle East and Africa Butter Industry Revenue Share (%), by Country 2024 & 2032
- Figure 22: Middle East and Africa Butter Industry Volume Share (%), by Country 2024 & 2032
- Figure 23: North America Butter Industry Revenue (Million), by Product Type 2024 & 2032
- Figure 24: North America Butter Industry Volume (K Units), by Product Type 2024 & 2032
- Figure 25: North America Butter Industry Revenue Share (%), by Product Type 2024 & 2032
- Figure 26: North America Butter Industry Volume Share (%), by Product Type 2024 & 2032
- Figure 27: North America Butter Industry Revenue (Million), by Distribution Channel 2024 & 2032
- Figure 28: North America Butter Industry Volume (K Units), by Distribution Channel 2024 & 2032
- Figure 29: North America Butter Industry Revenue Share (%), by Distribution Channel 2024 & 2032
- Figure 30: North America Butter Industry Volume Share (%), by Distribution Channel 2024 & 2032
- Figure 31: North America Butter Industry Revenue (Million), by Country 2024 & 2032
- Figure 32: North America Butter Industry Volume (K Units), by Country 2024 & 2032
- Figure 33: North America Butter Industry Revenue Share (%), by Country 2024 & 2032
- Figure 34: North America Butter Industry Volume Share (%), by Country 2024 & 2032
- Figure 35: Europe Butter Industry Revenue (Million), by Product Type 2024 & 2032
- Figure 36: Europe Butter Industry Volume (K Units), by Product Type 2024 & 2032
- Figure 37: Europe Butter Industry Revenue Share (%), by Product Type 2024 & 2032
- Figure 38: Europe Butter Industry Volume Share (%), by Product Type 2024 & 2032
- Figure 39: Europe Butter Industry Revenue (Million), by Distribution Channel 2024 & 2032
- Figure 40: Europe Butter Industry Volume (K Units), by Distribution Channel 2024 & 2032
- Figure 41: Europe Butter Industry Revenue Share (%), by Distribution Channel 2024 & 2032
- Figure 42: Europe Butter Industry Volume Share (%), by Distribution Channel 2024 & 2032
- Figure 43: Europe Butter Industry Revenue (Million), by Country 2024 & 2032
- Figure 44: Europe Butter Industry Volume (K Units), by Country 2024 & 2032
- Figure 45: Europe Butter Industry Revenue Share (%), by Country 2024 & 2032
- Figure 46: Europe Butter Industry Volume Share (%), by Country 2024 & 2032
- Figure 47: Asia Pacific Butter Industry Revenue (Million), by Product Type 2024 & 2032
- Figure 48: Asia Pacific Butter Industry Volume (K Units), by Product Type 2024 & 2032
- Figure 49: Asia Pacific Butter Industry Revenue Share (%), by Product Type 2024 & 2032
- Figure 50: Asia Pacific Butter Industry Volume Share (%), by Product Type 2024 & 2032
- Figure 51: Asia Pacific Butter Industry Revenue (Million), by Distribution Channel 2024 & 2032
- Figure 52: Asia Pacific Butter Industry Volume (K Units), by Distribution Channel 2024 & 2032
- Figure 53: Asia Pacific Butter Industry Revenue Share (%), by Distribution Channel 2024 & 2032
- Figure 54: Asia Pacific Butter Industry Volume Share (%), by Distribution Channel 2024 & 2032
- Figure 55: Asia Pacific Butter Industry Revenue (Million), by Country 2024 & 2032
- Figure 56: Asia Pacific Butter Industry Volume (K Units), by Country 2024 & 2032
- Figure 57: Asia Pacific Butter Industry Revenue Share (%), by Country 2024 & 2032
- Figure 58: Asia Pacific Butter Industry Volume Share (%), by Country 2024 & 2032
- Figure 59: South America Butter Industry Revenue (Million), by Product Type 2024 & 2032
- Figure 60: South America Butter Industry Volume (K Units), by Product Type 2024 & 2032
- Figure 61: South America Butter Industry Revenue Share (%), by Product Type 2024 & 2032
- Figure 62: South America Butter Industry Volume Share (%), by Product Type 2024 & 2032
- Figure 63: South America Butter Industry Revenue (Million), by Distribution Channel 2024 & 2032
- Figure 64: South America Butter Industry Volume (K Units), by Distribution Channel 2024 & 2032
- Figure 65: South America Butter Industry Revenue Share (%), by Distribution Channel 2024 & 2032
- Figure 66: South America Butter Industry Volume Share (%), by Distribution Channel 2024 & 2032
- Figure 67: South America Butter Industry Revenue (Million), by Country 2024 & 2032
- Figure 68: South America Butter Industry Volume (K Units), by Country 2024 & 2032
- Figure 69: South America Butter Industry Revenue Share (%), by Country 2024 & 2032
- Figure 70: South America Butter Industry Volume Share (%), by Country 2024 & 2032
- Figure 71: Middle East and Africa Butter Industry Revenue (Million), by Product Type 2024 & 2032
- Figure 72: Middle East and Africa Butter Industry Volume (K Units), by Product Type 2024 & 2032
- Figure 73: Middle East and Africa Butter Industry Revenue Share (%), by Product Type 2024 & 2032
- Figure 74: Middle East and Africa Butter Industry Volume Share (%), by Product Type 2024 & 2032
- Figure 75: Middle East and Africa Butter Industry Revenue (Million), by Distribution Channel 2024 & 2032
- Figure 76: Middle East and Africa Butter Industry Volume (K Units), by Distribution Channel 2024 & 2032
- Figure 77: Middle East and Africa Butter Industry Revenue Share (%), by Distribution Channel 2024 & 2032
- Figure 78: Middle East and Africa Butter Industry Volume Share (%), by Distribution Channel 2024 & 2032
- Figure 79: Middle East and Africa Butter Industry Revenue (Million), by Country 2024 & 2032
- Figure 80: Middle East and Africa Butter Industry Volume (K Units), by Country 2024 & 2032
- Figure 81: Middle East and Africa Butter Industry Revenue Share (%), by Country 2024 & 2032
- Figure 82: Middle East and Africa Butter Industry Volume Share (%), by Country 2024 & 2032
List of Tables
- Table 1: Global Butter Industry Revenue Million Forecast, by Region 2019 & 2032
- Table 2: Global Butter Industry Volume K Units Forecast, by Region 2019 & 2032
- Table 3: Global Butter Industry Revenue Million Forecast, by Product Type 2019 & 2032
- Table 4: Global Butter Industry Volume K Units Forecast, by Product Type 2019 & 2032
- Table 5: Global Butter Industry Revenue Million Forecast, by Distribution Channel 2019 & 2032
- Table 6: Global Butter Industry Volume K Units Forecast, by Distribution Channel 2019 & 2032
- Table 7: Global Butter Industry Revenue Million Forecast, by Region 2019 & 2032
- Table 8: Global Butter Industry Volume K Units Forecast, by Region 2019 & 2032
- Table 9: Global Butter Industry Revenue Million Forecast, by Country 2019 & 2032
- Table 10: Global Butter Industry Volume K Units Forecast, by Country 2019 & 2032
- Table 11: United States Butter Industry Revenue (Million) Forecast, by Application 2019 & 2032
- Table 12: United States Butter Industry Volume (K Units) Forecast, by Application 2019 & 2032
- Table 13: Canada Butter Industry Revenue (Million) Forecast, by Application 2019 & 2032
- Table 14: Canada Butter Industry Volume (K Units) Forecast, by Application 2019 & 2032
- Table 15: Mexico Butter Industry Revenue (Million) Forecast, by Application 2019 & 2032
- Table 16: Mexico Butter Industry Volume (K Units) Forecast, by Application 2019 & 2032
- Table 17: Rest of North America Butter Industry Revenue (Million) Forecast, by Application 2019 & 2032
- Table 18: Rest of North America Butter Industry Volume (K Units) Forecast, by Application 2019 & 2032
- Table 19: Global Butter Industry Revenue Million Forecast, by Country 2019 & 2032
- Table 20: Global Butter Industry Volume K Units Forecast, by Country 2019 & 2032
- Table 21: Spain Butter Industry Revenue (Million) Forecast, by Application 2019 & 2032
- Table 22: Spain Butter Industry Volume (K Units) Forecast, by Application 2019 & 2032
- Table 23: United Kingdom Butter Industry Revenue (Million) Forecast, by Application 2019 & 2032
- Table 24: United Kingdom Butter Industry Volume (K Units) Forecast, by Application 2019 & 2032
- Table 25: Germany Butter Industry Revenue (Million) Forecast, by Application 2019 & 2032
- Table 26: Germany Butter Industry Volume (K Units) Forecast, by Application 2019 & 2032
- Table 27: France Butter Industry Revenue (Million) Forecast, by Application 2019 & 2032
- Table 28: France Butter Industry Volume (K Units) Forecast, by Application 2019 & 2032
- Table 29: Italy Butter Industry Revenue (Million) Forecast, by Application 2019 & 2032
- Table 30: Italy Butter Industry Volume (K Units) Forecast, by Application 2019 & 2032
- Table 31: Netherlands Butter Industry Revenue (Million) Forecast, by Application 2019 & 2032
- Table 32: Netherlands Butter Industry Volume (K Units) Forecast, by Application 2019 & 2032
- Table 33: Rest of Europe Butter Industry Revenue (Million) Forecast, by Application 2019 & 2032
- Table 34: Rest of Europe Butter Industry Volume (K Units) Forecast, by Application 2019 & 2032
- Table 35: Global Butter Industry Revenue Million Forecast, by Country 2019 & 2032
- Table 36: Global Butter Industry Volume K Units Forecast, by Country 2019 & 2032
- Table 37: China Butter Industry Revenue (Million) Forecast, by Application 2019 & 2032
- Table 38: China Butter Industry Volume (K Units) Forecast, by Application 2019 & 2032
- Table 39: Japan Butter Industry Revenue (Million) Forecast, by Application 2019 & 2032
- Table 40: Japan Butter Industry Volume (K Units) Forecast, by Application 2019 & 2032
- Table 41: India Butter Industry Revenue (Million) Forecast, by Application 2019 & 2032
- Table 42: India Butter Industry Volume (K Units) Forecast, by Application 2019 & 2032
- Table 43: Australia Butter Industry Revenue (Million) Forecast, by Application 2019 & 2032
- Table 44: Australia Butter Industry Volume (K Units) Forecast, by Application 2019 & 2032
- Table 45: Rest of Asia Pacific Butter Industry Revenue (Million) Forecast, by Application 2019 & 2032
- Table 46: Rest of Asia Pacific Butter Industry Volume (K Units) Forecast, by Application 2019 & 2032
- Table 47: Global Butter Industry Revenue Million Forecast, by Country 2019 & 2032
- Table 48: Global Butter Industry Volume K Units Forecast, by Country 2019 & 2032
- Table 49: Brazil Butter Industry Revenue (Million) Forecast, by Application 2019 & 2032
- Table 50: Brazil Butter Industry Volume (K Units) Forecast, by Application 2019 & 2032
- Table 51: Argentina Butter Industry Revenue (Million) Forecast, by Application 2019 & 2032
- Table 52: Argentina Butter Industry Volume (K Units) Forecast, by Application 2019 & 2032
- Table 53: Rest of South America Butter Industry Revenue (Million) Forecast, by Application 2019 & 2032
- Table 54: Rest of South America Butter Industry Volume (K Units) Forecast, by Application 2019 & 2032
- Table 55: Global Butter Industry Revenue Million Forecast, by Country 2019 & 2032
- Table 56: Global Butter Industry Volume K Units Forecast, by Country 2019 & 2032
- Table 57: South Africa Butter Industry Revenue (Million) Forecast, by Application 2019 & 2032
- Table 58: South Africa Butter Industry Volume (K Units) Forecast, by Application 2019 & 2032
- Table 59: United Arab Emirates Butter Industry Revenue (Million) Forecast, by Application 2019 & 2032
- Table 60: United Arab Emirates Butter Industry Volume (K Units) Forecast, by Application 2019 & 2032
- Table 61: Rest of Middle East and Africa Butter Industry Revenue (Million) Forecast, by Application 2019 & 2032
- Table 62: Rest of Middle East and Africa Butter Industry Volume (K Units) Forecast, by Application 2019 & 2032
- Table 63: Global Butter Industry Revenue Million Forecast, by Product Type 2019 & 2032
- Table 64: Global Butter Industry Volume K Units Forecast, by Product Type 2019 & 2032
- Table 65: Global Butter Industry Revenue Million Forecast, by Distribution Channel 2019 & 2032
- Table 66: Global Butter Industry Volume K Units Forecast, by Distribution Channel 2019 & 2032
- Table 67: Global Butter Industry Revenue Million Forecast, by Country 2019 & 2032
- Table 68: Global Butter Industry Volume K Units Forecast, by Country 2019 & 2032
- Table 69: United States Butter Industry Revenue (Million) Forecast, by Application 2019 & 2032
- Table 70: United States Butter Industry Volume (K Units) Forecast, by Application 2019 & 2032
- Table 71: Canada Butter Industry Revenue (Million) Forecast, by Application 2019 & 2032
- Table 72: Canada Butter Industry Volume (K Units) Forecast, by Application 2019 & 2032
- Table 73: Mexico Butter Industry Revenue (Million) Forecast, by Application 2019 & 2032
- Table 74: Mexico Butter Industry Volume (K Units) Forecast, by Application 2019 & 2032
- Table 75: Rest of North America Butter Industry Revenue (Million) Forecast, by Application 2019 & 2032
- Table 76: Rest of North America Butter Industry Volume (K Units) Forecast, by Application 2019 & 2032
- Table 77: Global Butter Industry Revenue Million Forecast, by Product Type 2019 & 2032
- Table 78: Global Butter Industry Volume K Units Forecast, by Product Type 2019 & 2032
- Table 79: Global Butter Industry Revenue Million Forecast, by Distribution Channel 2019 & 2032
- Table 80: Global Butter Industry Volume K Units Forecast, by Distribution Channel 2019 & 2032
- Table 81: Global Butter Industry Revenue Million Forecast, by Country 2019 & 2032
- Table 82: Global Butter Industry Volume K Units Forecast, by Country 2019 & 2032
- Table 83: Spain Butter Industry Revenue (Million) Forecast, by Application 2019 & 2032
- Table 84: Spain Butter Industry Volume (K Units) Forecast, by Application 2019 & 2032
- Table 85: United Kingdom Butter Industry Revenue (Million) Forecast, by Application 2019 & 2032
- Table 86: United Kingdom Butter Industry Volume (K Units) Forecast, by Application 2019 & 2032
- Table 87: Germany Butter Industry Revenue (Million) Forecast, by Application 2019 & 2032
- Table 88: Germany Butter Industry Volume (K Units) Forecast, by Application 2019 & 2032
- Table 89: France Butter Industry Revenue (Million) Forecast, by Application 2019 & 2032
- Table 90: France Butter Industry Volume (K Units) Forecast, by Application 2019 & 2032
- Table 91: Italy Butter Industry Revenue (Million) Forecast, by Application 2019 & 2032
- Table 92: Italy Butter Industry Volume (K Units) Forecast, by Application 2019 & 2032
- Table 93: Netherlands Butter Industry Revenue (Million) Forecast, by Application 2019 & 2032
- Table 94: Netherlands Butter Industry Volume (K Units) Forecast, by Application 2019 & 2032
- Table 95: Rest of Europe Butter Industry Revenue (Million) Forecast, by Application 2019 & 2032
- Table 96: Rest of Europe Butter Industry Volume (K Units) Forecast, by Application 2019 & 2032
- Table 97: Global Butter Industry Revenue Million Forecast, by Product Type 2019 & 2032
- Table 98: Global Butter Industry Volume K Units Forecast, by Product Type 2019 & 2032
- Table 99: Global Butter Industry Revenue Million Forecast, by Distribution Channel 2019 & 2032
- Table 100: Global Butter Industry Volume K Units Forecast, by Distribution Channel 2019 & 2032
- Table 101: Global Butter Industry Revenue Million Forecast, by Country 2019 & 2032
- Table 102: Global Butter Industry Volume K Units Forecast, by Country 2019 & 2032
- Table 103: China Butter Industry Revenue (Million) Forecast, by Application 2019 & 2032
- Table 104: China Butter Industry Volume (K Units) Forecast, by Application 2019 & 2032
- Table 105: Japan Butter Industry Revenue (Million) Forecast, by Application 2019 & 2032
- Table 106: Japan Butter Industry Volume (K Units) Forecast, by Application 2019 & 2032
- Table 107: India Butter Industry Revenue (Million) Forecast, by Application 2019 & 2032
- Table 108: India Butter Industry Volume (K Units) Forecast, by Application 2019 & 2032
- Table 109: Australia Butter Industry Revenue (Million) Forecast, by Application 2019 & 2032
- Table 110: Australia Butter Industry Volume (K Units) Forecast, by Application 2019 & 2032
- Table 111: Rest of Asia Pacific Butter Industry Revenue (Million) Forecast, by Application 2019 & 2032
- Table 112: Rest of Asia Pacific Butter Industry Volume (K Units) Forecast, by Application 2019 & 2032
- Table 113: Global Butter Industry Revenue Million Forecast, by Product Type 2019 & 2032
- Table 114: Global Butter Industry Volume K Units Forecast, by Product Type 2019 & 2032
- Table 115: Global Butter Industry Revenue Million Forecast, by Distribution Channel 2019 & 2032
- Table 116: Global Butter Industry Volume K Units Forecast, by Distribution Channel 2019 & 2032
- Table 117: Global Butter Industry Revenue Million Forecast, by Country 2019 & 2032
- Table 118: Global Butter Industry Volume K Units Forecast, by Country 2019 & 2032
- Table 119: Brazil Butter Industry Revenue (Million) Forecast, by Application 2019 & 2032
- Table 120: Brazil Butter Industry Volume (K Units) Forecast, by Application 2019 & 2032
- Table 121: Argentina Butter Industry Revenue (Million) Forecast, by Application 2019 & 2032
- Table 122: Argentina Butter Industry Volume (K Units) Forecast, by Application 2019 & 2032
- Table 123: Rest of South America Butter Industry Revenue (Million) Forecast, by Application 2019 & 2032
- Table 124: Rest of South America Butter Industry Volume (K Units) Forecast, by Application 2019 & 2032
- Table 125: Global Butter Industry Revenue Million Forecast, by Product Type 2019 & 2032
- Table 126: Global Butter Industry Volume K Units Forecast, by Product Type 2019 & 2032
- Table 127: Global Butter Industry Revenue Million Forecast, by Distribution Channel 2019 & 2032
- Table 128: Global Butter Industry Volume K Units Forecast, by Distribution Channel 2019 & 2032
- Table 129: Global Butter Industry Revenue Million Forecast, by Country 2019 & 2032
- Table 130: Global Butter Industry Volume K Units Forecast, by Country 2019 & 2032
- Table 131: South Africa Butter Industry Revenue (Million) Forecast, by Application 2019 & 2032
- Table 132: South Africa Butter Industry Volume (K Units) Forecast, by Application 2019 & 2032
- Table 133: United Arab Emirates Butter Industry Revenue (Million) Forecast, by Application 2019 & 2032
- Table 134: United Arab Emirates Butter Industry Volume (K Units) Forecast, by Application 2019 & 2032
- Table 135: Rest of Middle East and Africa Butter Industry Revenue (Million) Forecast, by Application 2019 & 2032
- Table 136: Rest of Middle East and Africa Butter Industry Volume (K Units) Forecast, by Application 2019 & 2032
Frequently Asked Questions
1. What is the projected Compound Annual Growth Rate (CAGR) of the Butter Industry?
The projected CAGR is approximately 4.08%.
2. Which companies are prominent players in the Butter Industry?
Key companies in the market include Gujarat Co-operative Milk Marketing Federation Ltd (GCMMF), Upfield group B V *List Not Exhaustive, CavinKare, EATNUF, Arla Foods Amba, Dairy Farmers of America Inc, Land O' Lakes Inc, Fonterra Co-operative Group, CROPP Cooperative (Organic Valley), Ornua Co-operative Ltd.
3. What are the main segments of the Butter Industry?
The market segments include Product Type, Distribution Channel.
4. Can you provide details about the market size?
The market size is estimated to be USD 27.94 Million as of 2022.
5. What are some drivers contributing to market growth?
Consumer Inclination Toward Natural/Organic Food Products; Flavor Diversification Driving the Market.
6. What are the notable trends driving market growth?
Consumer Inclination Toward Natural/Organic Food Products.
7. Are there any restraints impacting market growth?
Adverse Health Impacts of High-Fat Content in Butter.
8. Can you provide examples of recent developments in the market?
January 2024: Bregott expanded its product portfolio by launching three new package size formats: 250 g, 500 g, and 750 g. According to the company’s claim, the new packages would be available in grocery store refrigerators.
9. What pricing options are available for accessing the report?
Pricing options include single-user, multi-user, and enterprise licenses priced at USD 4750, USD 5250, and USD 8750 respectively.
10. Is the market size provided in terms of value or volume?
The market size is provided in terms of value, measured in Million and volume, measured in K Units.
11. Are there any specific market keywords associated with the report?
Yes, the market keyword associated with the report is "Butter Industry," which aids in identifying and referencing the specific market segment covered.
12. How do I determine which pricing option suits my needs best?
The pricing options vary based on user requirements and access needs. Individual users may opt for single-user licenses, while businesses requiring broader access may choose multi-user or enterprise licenses for cost-effective access to the report.
13. Are there any additional resources or data provided in the Butter Industry report?
While the report offers comprehensive insights, it's advisable to review the specific contents or supplementary materials provided to ascertain if additional resources or data are available.
14. How can I stay updated on further developments or reports in the Butter Industry?
To stay informed about further developments, trends, and reports in the Butter Industry, consider subscribing to industry newsletters, following relevant companies and organizations, or regularly checking reputable industry news sources and publications.
Methodology
Step 1 - Identification of Relevant Samples Size from Population Database


Step 2 - Approaches for Defining Global Market Size (Value, Volume* & Price*)

Note*: In applicable scenarios
Step 3 - Data Sources
Primary Research
- Web Analytics
- Survey Reports
- Research Institute
- Latest Research Reports
- Opinion Leaders
Secondary Research
- Annual Reports
- White Paper
- Latest Press Release
- Industry Association
- Paid Database
- Investor Presentations

Step 4 - Data Triangulation
Involves using different sources of information in order to increase the validity of a study
These sources are likely to be stakeholders in a program - participants, other researchers, program staff, other community members, and so on.
Then we put all data in single framework & apply various statistical tools to find out the dynamic on the market.
During the analysis stage, feedback from the stakeholder groups would be compared to determine areas of agreement as well as areas of divergence


