
Key Insights
The global coal-fired power generation market, while facing significant headwinds from environmental regulations and the rise of renewable energy sources, continues to hold a substantial share of the global electricity generation mix, particularly in developing economies with large coal reserves. The period between 2019 and 2024 witnessed a period of moderate growth, likely influenced by factors such as consistent energy demand in certain regions and the relatively lower initial cost of coal-fired power plants compared to renewable alternatives. However, this growth trajectory is expected to decelerate over the forecast period (2025-2033). Stringent environmental regulations aimed at reducing carbon emissions, coupled with increasing investments in renewable energy infrastructure and technological advancements making renewables increasingly cost-competitive, are key factors impacting the market's future. While the market will likely experience some growth due to continued demand in certain regions and the operational lifespan of existing plants, the overall CAGR is projected to be lower than previous years, reflecting a gradual shift toward cleaner energy sources. The market's future hinges on the balance between the continued need for reliable baseload power, the cost-competitiveness of renewable energy alternatives, and the stringency of future environmental policies. Specific regional variations will also influence the market's overall performance, with regions heavily reliant on coal-fired power experiencing slower growth rates compared to those actively diversifying their energy portfolios.
The decline in the growth rate is primarily driven by the global push towards decarbonization. Countries are increasingly implementing carbon pricing mechanisms and stricter emission standards, making coal-fired power plants less economically viable. Furthermore, technological advancements in renewable energy technologies, including solar and wind power, are resulting in decreasing costs and increased efficiency, making them increasingly competitive with coal. Despite these challenges, the market is not expected to completely vanish in the next decade. Existing infrastructure will continue to operate, and some developing economies may continue to rely on coal for a portion of their electricity generation, at least in the short-to-medium term, due to factors such as energy security concerns and limited access to alternative energy sources. However, this segment is expected to face significant downward pressure driven by the global shift to sustainable energy solutions.
Coal Fired Power Generation Market Report: 2019-2033 Forecast
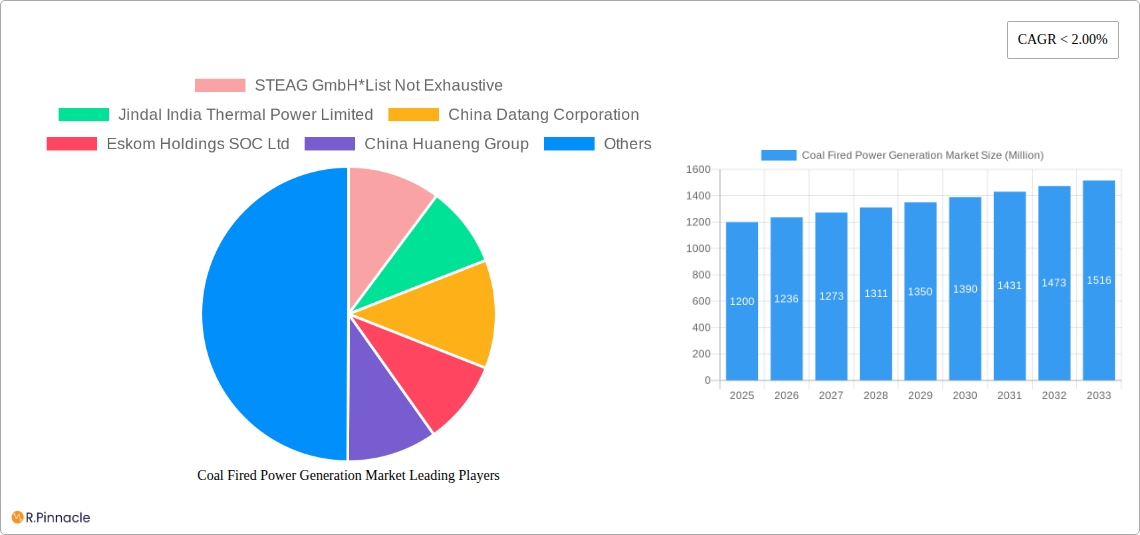
This comprehensive report provides a detailed analysis of the Coal Fired Power Generation Market, offering invaluable insights for industry professionals, investors, and stakeholders. The study covers the period 2019-2033, with a focus on the forecast period 2025-2033 and a base year of 2025. The report leverages extensive market research and data analysis to provide a clear understanding of market trends, growth drivers, challenges, and opportunities. Key players like STEAG GmbH, Jindal India Thermal Power Limited, and China Datang Corporation are profiled, among others. This report is crucial for navigating the complexities of this dynamic sector.
Coal Fired Power Generation Market Market Structure & Innovation Trends
The Coal Fired Power Generation market exhibits a moderately concentrated structure, with a few major players holding significant market share. For instance, China Datang Corporation and China Huaneng Group collectively command an estimated xx% market share (2025), reflecting their extensive operational footprints and established market positions. Innovation is driven primarily by the need for increased efficiency, reduced emissions, and improved reliability. Stringent environmental regulations, particularly concerning greenhouse gas emissions, are shaping the market landscape and fostering the adoption of cleaner coal technologies. The market also sees mergers and acquisitions (M&A) activity, with deal values exceeding xx Million in the past five years. These activities often involve the consolidation of assets and expertise to improve operational efficiencies and expand market reach. Product substitution is a key challenge, with renewable energy sources like solar and wind power increasingly competing for market share.
- Market Concentration: Moderately concentrated, with top 5 players holding xx% market share (2025).
- Innovation Drivers: Efficiency improvements, emission reduction mandates, and reliability enhancement.
- Regulatory Frameworks: Stringent environmental regulations drive innovation and consolidation.
- Product Substitutes: Renewable energy sources present a significant challenge.
- M&A Activity: Significant M&A activity observed, with deal values exceeding xx Million (2019-2024).
- End-user Demographics: Primarily utility companies and industrial power plants.
Coal Fired Power Generation Market Market Dynamics & Trends
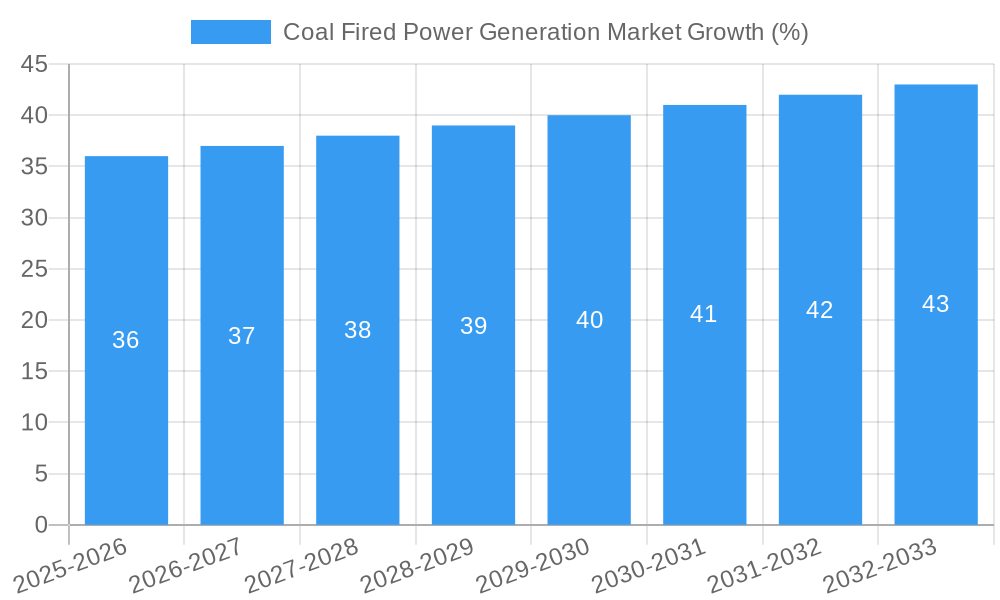
The Coal Fired Power Generation market is projected to experience a CAGR of xx% during the forecast period (2025-2033). This growth is primarily driven by the persistent demand for reliable and affordable electricity in developing economies, especially in Asia. However, the market faces significant headwinds from the global shift towards renewable energy sources and stricter environmental regulations. The increasing adoption of carbon capture and storage (CCS) technologies and other emission reduction measures is expected to partially mitigate these challenges. Technological disruptions, such as the development of advanced coal gasification technologies, are also reshaping the market. Competitive dynamics are intensifying with the emergence of new players and the continued expansion of existing ones. Market penetration of advanced technologies like circulating fluidized bed combustion (CFBC) systems is increasing, driven by their superior efficiency and reduced emissions compared to conventional pulverized coal systems.
Dominant Regions & Segments in Coal Fired Power Generation Market
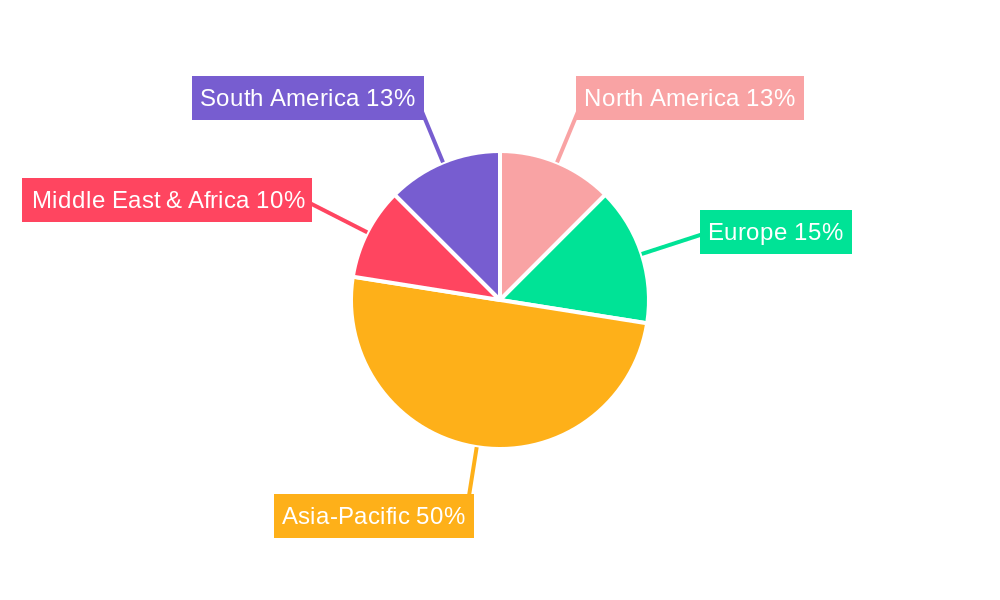
Asia, particularly China and India, dominates the Coal Fired Power Generation market, accounting for approximately xx% of the global market share in 2025. This dominance stems from factors such as rapid economic growth, increasing energy demand, and existing infrastructure favoring coal-based power generation.
- Key Drivers in Asia:
- Rapid economic expansion leading to increased energy demand.
- Abundant coal reserves and established coal mining industries.
- Significant government investments in coal-fired power plants.
- Relatively lower capital costs compared to renewable energy sources.
The Pulverized Coal Firing Systems (PC) segment holds the largest market share amongst different technologies, owing to its maturity, widespread adoption, and relatively lower initial investment cost. However, the Other Technologies segment, particularly Circulating Fluidized Bed (CFB) and Coal Gasification, is anticipated to witness the fastest growth due to their enhanced efficiency and reduced emissions. Cyclone Furnaces also maintain a niche segment, focusing on specialized applications.
Coal Fired Power Generation Market Product Innovations
Recent product innovations in the coal-fired power generation market focus on improving efficiency, reducing emissions, and enhancing reliability. This includes the development of advanced combustion technologies such as ultra-supercritical power plants and integrated gasification combined cycle (IGCC) plants. These innovations offer significant advantages in terms of fuel efficiency, reduced greenhouse gas emissions, and improved overall plant performance. The market is also witnessing increased adoption of carbon capture and storage (CCS) technologies to further mitigate environmental impact. These advancements cater to the growing demand for cleaner and more sustainable power generation while leveraging the established infrastructure and resource base associated with coal.
Report Scope & Segmentation Analysis
This report segments the Coal Fired Power Generation market by technology:
Pulverized Coal Firing Systems (PC): This segment is currently the largest, but its growth is expected to be slower than other segments due to environmental concerns. The market size in 2025 is estimated at xx Million, with a projected CAGR of xx% during the forecast period. Competition in this segment is intense, with established players vying for market share.
Cyclone Furnace: This niche segment caters to specific industrial applications and enjoys steady growth, driven by its ability to handle challenging fuels. The 2025 market size is estimated at xx Million, with a projected CAGR of xx% during the forecast period. The competitive landscape in this segment is relatively less crowded.
Other Technologies (Circulating Fluidized Bed and Coal Gasification): This segment is characterized by rapid growth driven by its superior environmental performance and higher efficiency compared to traditional PC systems. The 2025 market size is projected at xx Million, with a projected CAGR of xx% during the forecast period. Market competition is increasing as new players enter the field.
Key Drivers of Coal Fired Power Generation Market Growth
The Coal Fired Power Generation market's growth is fueled by several key factors: the existing substantial coal reserves globally, particularly in developing nations, ensures a readily available and relatively inexpensive fuel source. Furthermore, the established infrastructure of coal-fired power plants provides a foundation for continued operation and expansion. Government policies in some regions continue to support coal-fired power generation, particularly where it is seen as crucial for economic development and energy security. Lastly, despite pressure for renewable energy adoption, coal power plants continue to offer a degree of cost competitiveness and operational reliability.
Challenges in the Coal Fired Power Generation Market Sector
The Coal Fired Power Generation market faces significant challenges, primarily stringent environmental regulations designed to reduce greenhouse gas emissions. These regulations increase operating costs and necessitate investments in emission control technologies. Fluctuations in coal prices add another layer of uncertainty to project economics, impacting profitability. Increasing competition from renewable energy sources, along with the growing public awareness about air pollution concerns, also place considerable pressure on the coal-fired power generation sector. These challenges collectively impact investment decisions and long-term market growth potential, resulting in an estimated annual impact on market revenue of xx Million.
Emerging Opportunities in Coal Fired Power Generation Market
Despite the challenges, opportunities remain within the Coal Fired Power Generation market. The focus is shifting toward cleaner technologies like carbon capture and storage (CCS) and advanced coal gasification, creating opportunities for technological innovation and investment. Emerging economies continue to expand their energy infrastructure, although favoring a balanced approach with renewables. Improved energy efficiency measures in existing coal plants can lead to cost savings and reduced environmental impact.
Leading Players in the Coal Fired Power Generation Market Market
- STEAG GmbH
- Jindal India Thermal Power Limited
- China Datang Corporation
- Eskom Holdings SOC Ltd
- China Huaneng Group
- RWE AG
- Dominion Energy Solutions
- Duke Energy Corporation
- National Thermal Power Corporation Limited
- Shenhua Group Corporation Limited
Key Developments in Coal Fired Power Generation Market Industry
- January 2023: China Huaneng Group announces investment in advanced emission control technology for its existing coal plants.
- June 2022: RWE AG secures funding for a new coal gasification plant with CCS technology.
- October 2021: Jindal India Thermal Power Limited commissions a new ultra-supercritical coal-fired power plant.
- March 2020: Dominion Energy Solutions invests in carbon capture research and development.
Future Outlook for Coal Fired Power Generation Market Market
The future of the Coal Fired Power Generation market is intertwined with the global energy transition. While the industry faces significant challenges, opportunities exist in the development and deployment of cleaner technologies, and efficient operations. Strategic partnerships focused on technological innovation and emission reduction will be crucial for long-term success. The market will continue to be shaped by regulatory changes, technological advancements, and economic factors. However, the gradual shift towards renewable energy sources and the rising importance of environmental sustainability are likely to influence the trajectory of this industry. The ability to integrate and improve efficiency within the current infrastructure and to adopt innovative, environmentally conscientious practices will largely dictate future growth projections.
Coal Fired Power Generation Market Segmentation
-
1. Technology
- 1.1. Pulverized Coal Firing Systems (PC)
- 1.2. Cyclone Furnace
- 1.3. Other Te
Coal Fired Power Generation Market Segmentation By Geography
- 1. North America
- 2. Europe
- 3. Asia Pacific
- 4. South America
- 5. Middle East and Africa
Coal Fired Power Generation Market REPORT HIGHLIGHTS
| Aspects | Details |
|---|---|
| Study Period | 2019-2033 |
| Base Year | 2024 |
| Estimated Year | 2025 |
| Forecast Period | 2025-2033 |
| Historical Period | 2019-2024 |
| Growth Rate | CAGR of < 2.00% from 2019-2033 |
| Segmentation |
|
Table of Contents
- 1. Introduction
- 1.1. Research Scope
- 1.2. Market Segmentation
- 1.3. Research Methodology
- 1.4. Definitions and Assumptions
- 2. Executive Summary
- 2.1. Introduction
- 3. Market Dynamics
- 3.1. Introduction
- 3.2. Market Drivers
- 3.2.1. Increasing Electricity Demand; Rising Investments in the Coal Industry
- 3.3. Market Restrains
- 3.3.1. Increasing Installation of Renewable Energy Sources
- 3.4. Market Trends
- 3.4.1. Pulverized Coal Firing Technology to Dominate the Market
- 4. Market Factor Analysis
- 4.1. Porters Five Forces
- 4.2. Supply/Value Chain
- 4.3. PESTEL analysis
- 4.4. Market Entropy
- 4.5. Patent/Trademark Analysis
- 5. Global Coal Fired Power Generation Market Analysis, Insights and Forecast, 2019-2031
- 5.1. Market Analysis, Insights and Forecast - by Technology
- 5.1.1. Pulverized Coal Firing Systems (PC)
- 5.1.2. Cyclone Furnace
- 5.1.3. Other Te
- 5.2. Market Analysis, Insights and Forecast - by Region
- 5.2.1. North America
- 5.2.2. Europe
- 5.2.3. Asia Pacific
- 5.2.4. South America
- 5.2.5. Middle East and Africa
- 5.1. Market Analysis, Insights and Forecast - by Technology
- 6. North America Coal Fired Power Generation Market Analysis, Insights and Forecast, 2019-2031
- 6.1. Market Analysis, Insights and Forecast - by Technology
- 6.1.1. Pulverized Coal Firing Systems (PC)
- 6.1.2. Cyclone Furnace
- 6.1.3. Other Te
- 6.1. Market Analysis, Insights and Forecast - by Technology
- 7. Europe Coal Fired Power Generation Market Analysis, Insights and Forecast, 2019-2031
- 7.1. Market Analysis, Insights and Forecast - by Technology
- 7.1.1. Pulverized Coal Firing Systems (PC)
- 7.1.2. Cyclone Furnace
- 7.1.3. Other Te
- 7.1. Market Analysis, Insights and Forecast - by Technology
- 8. Asia Pacific Coal Fired Power Generation Market Analysis, Insights and Forecast, 2019-2031
- 8.1. Market Analysis, Insights and Forecast - by Technology
- 8.1.1. Pulverized Coal Firing Systems (PC)
- 8.1.2. Cyclone Furnace
- 8.1.3. Other Te
- 8.1. Market Analysis, Insights and Forecast - by Technology
- 9. South America Coal Fired Power Generation Market Analysis, Insights and Forecast, 2019-2031
- 9.1. Market Analysis, Insights and Forecast - by Technology
- 9.1.1. Pulverized Coal Firing Systems (PC)
- 9.1.2. Cyclone Furnace
- 9.1.3. Other Te
- 9.1. Market Analysis, Insights and Forecast - by Technology
- 10. Middle East and Africa Coal Fired Power Generation Market Analysis, Insights and Forecast, 2019-2031
- 10.1. Market Analysis, Insights and Forecast - by Technology
- 10.1.1. Pulverized Coal Firing Systems (PC)
- 10.1.2. Cyclone Furnace
- 10.1.3. Other Te
- 10.1. Market Analysis, Insights and Forecast - by Technology
- 11. North America Coal Fired Power Generation Market Analysis, Insights and Forecast, 2019-2031
- 11.1. Market Analysis, Insights and Forecast - By Country/Sub-region
- 11.1.1 United States
- 11.1.2 Canada
- 11.1.3 Mexico
- 12. Europe Coal Fired Power Generation Market Analysis, Insights and Forecast, 2019-2031
- 12.1. Market Analysis, Insights and Forecast - By Country/Sub-region
- 12.1.1 Germany
- 12.1.2 United Kingdom
- 12.1.3 France
- 12.1.4 Spain
- 12.1.5 Italy
- 12.1.6 Spain
- 12.1.7 Belgium
- 12.1.8 Netherland
- 12.1.9 Nordics
- 12.1.10 Rest of Europe
- 13. Asia Pacific Coal Fired Power Generation Market Analysis, Insights and Forecast, 2019-2031
- 13.1. Market Analysis, Insights and Forecast - By Country/Sub-region
- 13.1.1 China
- 13.1.2 Japan
- 13.1.3 India
- 13.1.4 South Korea
- 13.1.5 Southeast Asia
- 13.1.6 Australia
- 13.1.7 Indonesia
- 13.1.8 Phillipes
- 13.1.9 Singapore
- 13.1.10 Thailandc
- 13.1.11 Rest of Asia Pacific
- 14. South America Coal Fired Power Generation Market Analysis, Insights and Forecast, 2019-2031
- 14.1. Market Analysis, Insights and Forecast - By Country/Sub-region
- 14.1.1 Brazil
- 14.1.2 Argentina
- 14.1.3 Peru
- 14.1.4 Chile
- 14.1.5 Colombia
- 14.1.6 Ecuador
- 14.1.7 Venezuela
- 14.1.8 Rest of South America
- 15. North America Coal Fired Power Generation Market Analysis, Insights and Forecast, 2019-2031
- 15.1. Market Analysis, Insights and Forecast - By Country/Sub-region
- 15.1.1 United States
- 15.1.2 Canada
- 15.1.3 Mexico
- 16. MEA Coal Fired Power Generation Market Analysis, Insights and Forecast, 2019-2031
- 16.1. Market Analysis, Insights and Forecast - By Country/Sub-region
- 16.1.1 United Arab Emirates
- 16.1.2 Saudi Arabia
- 16.1.3 South Africa
- 16.1.4 Rest of Middle East and Africa
- 17. Competitive Analysis
- 17.1. Global Market Share Analysis 2024
- 17.2. Company Profiles
- 17.2.1 STEAG GmbH*List Not Exhaustive
- 17.2.1.1. Overview
- 17.2.1.2. Products
- 17.2.1.3. SWOT Analysis
- 17.2.1.4. Recent Developments
- 17.2.1.5. Financials (Based on Availability)
- 17.2.2 Jindal India Thermal Power Limited
- 17.2.2.1. Overview
- 17.2.2.2. Products
- 17.2.2.3. SWOT Analysis
- 17.2.2.4. Recent Developments
- 17.2.2.5. Financials (Based on Availability)
- 17.2.3 China Datang Corporation
- 17.2.3.1. Overview
- 17.2.3.2. Products
- 17.2.3.3. SWOT Analysis
- 17.2.3.4. Recent Developments
- 17.2.3.5. Financials (Based on Availability)
- 17.2.4 Eskom Holdings SOC Ltd
- 17.2.4.1. Overview
- 17.2.4.2. Products
- 17.2.4.3. SWOT Analysis
- 17.2.4.4. Recent Developments
- 17.2.4.5. Financials (Based on Availability)
- 17.2.5 China Huaneng Group
- 17.2.5.1. Overview
- 17.2.5.2. Products
- 17.2.5.3. SWOT Analysis
- 17.2.5.4. Recent Developments
- 17.2.5.5. Financials (Based on Availability)
- 17.2.6 RWE AG
- 17.2.6.1. Overview
- 17.2.6.2. Products
- 17.2.6.3. SWOT Analysis
- 17.2.6.4. Recent Developments
- 17.2.6.5. Financials (Based on Availability)
- 17.2.7 Dominion Energy Solutions
- 17.2.7.1. Overview
- 17.2.7.2. Products
- 17.2.7.3. SWOT Analysis
- 17.2.7.4. Recent Developments
- 17.2.7.5. Financials (Based on Availability)
- 17.2.8 Duke Energy Corporation
- 17.2.8.1. Overview
- 17.2.8.2. Products
- 17.2.8.3. SWOT Analysis
- 17.2.8.4. Recent Developments
- 17.2.8.5. Financials (Based on Availability)
- 17.2.9 National Thermal Power Corporation Limited
- 17.2.9.1. Overview
- 17.2.9.2. Products
- 17.2.9.3. SWOT Analysis
- 17.2.9.4. Recent Developments
- 17.2.9.5. Financials (Based on Availability)
- 17.2.10 Shenhua Group Corporation Limited
- 17.2.10.1. Overview
- 17.2.10.2. Products
- 17.2.10.3. SWOT Analysis
- 17.2.10.4. Recent Developments
- 17.2.10.5. Financials (Based on Availability)
- 17.2.1 STEAG GmbH*List Not Exhaustive
List of Figures
- Figure 1: Global Coal Fired Power Generation Market Revenue Breakdown (Million, %) by Region 2024 & 2032
- Figure 2: North America Coal Fired Power Generation Market Revenue (Million), by Country 2024 & 2032
- Figure 3: North America Coal Fired Power Generation Market Revenue Share (%), by Country 2024 & 2032
- Figure 4: Europe Coal Fired Power Generation Market Revenue (Million), by Country 2024 & 2032
- Figure 5: Europe Coal Fired Power Generation Market Revenue Share (%), by Country 2024 & 2032
- Figure 6: Asia Pacific Coal Fired Power Generation Market Revenue (Million), by Country 2024 & 2032
- Figure 7: Asia Pacific Coal Fired Power Generation Market Revenue Share (%), by Country 2024 & 2032
- Figure 8: South America Coal Fired Power Generation Market Revenue (Million), by Country 2024 & 2032
- Figure 9: South America Coal Fired Power Generation Market Revenue Share (%), by Country 2024 & 2032
- Figure 10: North America Coal Fired Power Generation Market Revenue (Million), by Country 2024 & 2032
- Figure 11: North America Coal Fired Power Generation Market Revenue Share (%), by Country 2024 & 2032
- Figure 12: MEA Coal Fired Power Generation Market Revenue (Million), by Country 2024 & 2032
- Figure 13: MEA Coal Fired Power Generation Market Revenue Share (%), by Country 2024 & 2032
- Figure 14: North America Coal Fired Power Generation Market Revenue (Million), by Technology 2024 & 2032
- Figure 15: North America Coal Fired Power Generation Market Revenue Share (%), by Technology 2024 & 2032
- Figure 16: North America Coal Fired Power Generation Market Revenue (Million), by Country 2024 & 2032
- Figure 17: North America Coal Fired Power Generation Market Revenue Share (%), by Country 2024 & 2032
- Figure 18: Europe Coal Fired Power Generation Market Revenue (Million), by Technology 2024 & 2032
- Figure 19: Europe Coal Fired Power Generation Market Revenue Share (%), by Technology 2024 & 2032
- Figure 20: Europe Coal Fired Power Generation Market Revenue (Million), by Country 2024 & 2032
- Figure 21: Europe Coal Fired Power Generation Market Revenue Share (%), by Country 2024 & 2032
- Figure 22: Asia Pacific Coal Fired Power Generation Market Revenue (Million), by Technology 2024 & 2032
- Figure 23: Asia Pacific Coal Fired Power Generation Market Revenue Share (%), by Technology 2024 & 2032
- Figure 24: Asia Pacific Coal Fired Power Generation Market Revenue (Million), by Country 2024 & 2032
- Figure 25: Asia Pacific Coal Fired Power Generation Market Revenue Share (%), by Country 2024 & 2032
- Figure 26: South America Coal Fired Power Generation Market Revenue (Million), by Technology 2024 & 2032
- Figure 27: South America Coal Fired Power Generation Market Revenue Share (%), by Technology 2024 & 2032
- Figure 28: South America Coal Fired Power Generation Market Revenue (Million), by Country 2024 & 2032
- Figure 29: South America Coal Fired Power Generation Market Revenue Share (%), by Country 2024 & 2032
- Figure 30: Middle East and Africa Coal Fired Power Generation Market Revenue (Million), by Technology 2024 & 2032
- Figure 31: Middle East and Africa Coal Fired Power Generation Market Revenue Share (%), by Technology 2024 & 2032
- Figure 32: Middle East and Africa Coal Fired Power Generation Market Revenue (Million), by Country 2024 & 2032
- Figure 33: Middle East and Africa Coal Fired Power Generation Market Revenue Share (%), by Country 2024 & 2032
List of Tables
- Table 1: Global Coal Fired Power Generation Market Revenue Million Forecast, by Region 2019 & 2032
- Table 2: Global Coal Fired Power Generation Market Revenue Million Forecast, by Technology 2019 & 2032
- Table 3: Global Coal Fired Power Generation Market Revenue Million Forecast, by Region 2019 & 2032
- Table 4: Global Coal Fired Power Generation Market Revenue Million Forecast, by Country 2019 & 2032
- Table 5: United States Coal Fired Power Generation Market Revenue (Million) Forecast, by Application 2019 & 2032
- Table 6: Canada Coal Fired Power Generation Market Revenue (Million) Forecast, by Application 2019 & 2032
- Table 7: Mexico Coal Fired Power Generation Market Revenue (Million) Forecast, by Application 2019 & 2032
- Table 8: Global Coal Fired Power Generation Market Revenue Million Forecast, by Country 2019 & 2032
- Table 9: Germany Coal Fired Power Generation Market Revenue (Million) Forecast, by Application 2019 & 2032
- Table 10: United Kingdom Coal Fired Power Generation Market Revenue (Million) Forecast, by Application 2019 & 2032
- Table 11: France Coal Fired Power Generation Market Revenue (Million) Forecast, by Application 2019 & 2032
- Table 12: Spain Coal Fired Power Generation Market Revenue (Million) Forecast, by Application 2019 & 2032
- Table 13: Italy Coal Fired Power Generation Market Revenue (Million) Forecast, by Application 2019 & 2032
- Table 14: Spain Coal Fired Power Generation Market Revenue (Million) Forecast, by Application 2019 & 2032
- Table 15: Belgium Coal Fired Power Generation Market Revenue (Million) Forecast, by Application 2019 & 2032
- Table 16: Netherland Coal Fired Power Generation Market Revenue (Million) Forecast, by Application 2019 & 2032
- Table 17: Nordics Coal Fired Power Generation Market Revenue (Million) Forecast, by Application 2019 & 2032
- Table 18: Rest of Europe Coal Fired Power Generation Market Revenue (Million) Forecast, by Application 2019 & 2032
- Table 19: Global Coal Fired Power Generation Market Revenue Million Forecast, by Country 2019 & 2032
- Table 20: China Coal Fired Power Generation Market Revenue (Million) Forecast, by Application 2019 & 2032
- Table 21: Japan Coal Fired Power Generation Market Revenue (Million) Forecast, by Application 2019 & 2032
- Table 22: India Coal Fired Power Generation Market Revenue (Million) Forecast, by Application 2019 & 2032
- Table 23: South Korea Coal Fired Power Generation Market Revenue (Million) Forecast, by Application 2019 & 2032
- Table 24: Southeast Asia Coal Fired Power Generation Market Revenue (Million) Forecast, by Application 2019 & 2032
- Table 25: Australia Coal Fired Power Generation Market Revenue (Million) Forecast, by Application 2019 & 2032
- Table 26: Indonesia Coal Fired Power Generation Market Revenue (Million) Forecast, by Application 2019 & 2032
- Table 27: Phillipes Coal Fired Power Generation Market Revenue (Million) Forecast, by Application 2019 & 2032
- Table 28: Singapore Coal Fired Power Generation Market Revenue (Million) Forecast, by Application 2019 & 2032
- Table 29: Thailandc Coal Fired Power Generation Market Revenue (Million) Forecast, by Application 2019 & 2032
- Table 30: Rest of Asia Pacific Coal Fired Power Generation Market Revenue (Million) Forecast, by Application 2019 & 2032
- Table 31: Global Coal Fired Power Generation Market Revenue Million Forecast, by Country 2019 & 2032
- Table 32: Brazil Coal Fired Power Generation Market Revenue (Million) Forecast, by Application 2019 & 2032
- Table 33: Argentina Coal Fired Power Generation Market Revenue (Million) Forecast, by Application 2019 & 2032
- Table 34: Peru Coal Fired Power Generation Market Revenue (Million) Forecast, by Application 2019 & 2032
- Table 35: Chile Coal Fired Power Generation Market Revenue (Million) Forecast, by Application 2019 & 2032
- Table 36: Colombia Coal Fired Power Generation Market Revenue (Million) Forecast, by Application 2019 & 2032
- Table 37: Ecuador Coal Fired Power Generation Market Revenue (Million) Forecast, by Application 2019 & 2032
- Table 38: Venezuela Coal Fired Power Generation Market Revenue (Million) Forecast, by Application 2019 & 2032
- Table 39: Rest of South America Coal Fired Power Generation Market Revenue (Million) Forecast, by Application 2019 & 2032
- Table 40: Global Coal Fired Power Generation Market Revenue Million Forecast, by Country 2019 & 2032
- Table 41: United States Coal Fired Power Generation Market Revenue (Million) Forecast, by Application 2019 & 2032
- Table 42: Canada Coal Fired Power Generation Market Revenue (Million) Forecast, by Application 2019 & 2032
- Table 43: Mexico Coal Fired Power Generation Market Revenue (Million) Forecast, by Application 2019 & 2032
- Table 44: Global Coal Fired Power Generation Market Revenue Million Forecast, by Country 2019 & 2032
- Table 45: United Arab Emirates Coal Fired Power Generation Market Revenue (Million) Forecast, by Application 2019 & 2032
- Table 46: Saudi Arabia Coal Fired Power Generation Market Revenue (Million) Forecast, by Application 2019 & 2032
- Table 47: South Africa Coal Fired Power Generation Market Revenue (Million) Forecast, by Application 2019 & 2032
- Table 48: Rest of Middle East and Africa Coal Fired Power Generation Market Revenue (Million) Forecast, by Application 2019 & 2032
- Table 49: Global Coal Fired Power Generation Market Revenue Million Forecast, by Technology 2019 & 2032
- Table 50: Global Coal Fired Power Generation Market Revenue Million Forecast, by Country 2019 & 2032
- Table 51: Global Coal Fired Power Generation Market Revenue Million Forecast, by Technology 2019 & 2032
- Table 52: Global Coal Fired Power Generation Market Revenue Million Forecast, by Country 2019 & 2032
- Table 53: Global Coal Fired Power Generation Market Revenue Million Forecast, by Technology 2019 & 2032
- Table 54: Global Coal Fired Power Generation Market Revenue Million Forecast, by Country 2019 & 2032
- Table 55: Global Coal Fired Power Generation Market Revenue Million Forecast, by Technology 2019 & 2032
- Table 56: Global Coal Fired Power Generation Market Revenue Million Forecast, by Country 2019 & 2032
- Table 57: Global Coal Fired Power Generation Market Revenue Million Forecast, by Technology 2019 & 2032
- Table 58: Global Coal Fired Power Generation Market Revenue Million Forecast, by Country 2019 & 2032
Frequently Asked Questions
1. What is the projected Compound Annual Growth Rate (CAGR) of the Coal Fired Power Generation Market?
The projected CAGR is approximately < 2.00%.
2. Which companies are prominent players in the Coal Fired Power Generation Market?
Key companies in the market include STEAG GmbH*List Not Exhaustive, Jindal India Thermal Power Limited, China Datang Corporation, Eskom Holdings SOC Ltd, China Huaneng Group, RWE AG, Dominion Energy Solutions, Duke Energy Corporation, National Thermal Power Corporation Limited, Shenhua Group Corporation Limited.
3. What are the main segments of the Coal Fired Power Generation Market?
The market segments include Technology.
4. Can you provide details about the market size?
The market size is estimated to be USD XX Million as of 2022.
5. What are some drivers contributing to market growth?
Increasing Electricity Demand; Rising Investments in the Coal Industry.
6. What are the notable trends driving market growth?
Pulverized Coal Firing Technology to Dominate the Market.
7. Are there any restraints impacting market growth?
Increasing Installation of Renewable Energy Sources.
8. Can you provide examples of recent developments in the market?
N/A
9. What pricing options are available for accessing the report?
Pricing options include single-user, multi-user, and enterprise licenses priced at USD 4750, USD 5250, and USD 8750 respectively.
10. Is the market size provided in terms of value or volume?
The market size is provided in terms of value, measured in Million.
11. Are there any specific market keywords associated with the report?
Yes, the market keyword associated with the report is "Coal Fired Power Generation Market," which aids in identifying and referencing the specific market segment covered.
12. How do I determine which pricing option suits my needs best?
The pricing options vary based on user requirements and access needs. Individual users may opt for single-user licenses, while businesses requiring broader access may choose multi-user or enterprise licenses for cost-effective access to the report.
13. Are there any additional resources or data provided in the Coal Fired Power Generation Market report?
While the report offers comprehensive insights, it's advisable to review the specific contents or supplementary materials provided to ascertain if additional resources or data are available.
14. How can I stay updated on further developments or reports in the Coal Fired Power Generation Market?
To stay informed about further developments, trends, and reports in the Coal Fired Power Generation Market, consider subscribing to industry newsletters, following relevant companies and organizations, or regularly checking reputable industry news sources and publications.
Methodology
Step 1 - Identification of Relevant Samples Size from Population Database


Step 2 - Approaches for Defining Global Market Size (Value, Volume* & Price*)

Note*: In applicable scenarios
Step 3 - Data Sources
Primary Research
- Web Analytics
- Survey Reports
- Research Institute
- Latest Research Reports
- Opinion Leaders
Secondary Research
- Annual Reports
- White Paper
- Latest Press Release
- Industry Association
- Paid Database
- Investor Presentations

Step 4 - Data Triangulation
Involves using different sources of information in order to increase the validity of a study
These sources are likely to be stakeholders in a program - participants, other researchers, program staff, other community members, and so on.
Then we put all data in single framework & apply various statistical tools to find out the dynamic on the market.
During the analysis stage, feedback from the stakeholder groups would be compared to determine areas of agreement as well as areas of divergence


