
Key Insights
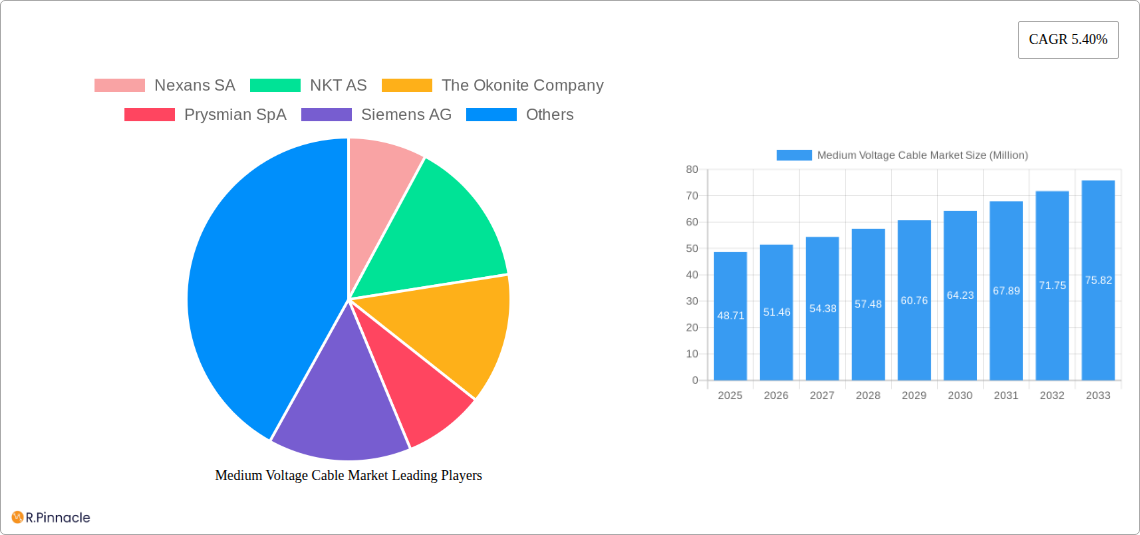
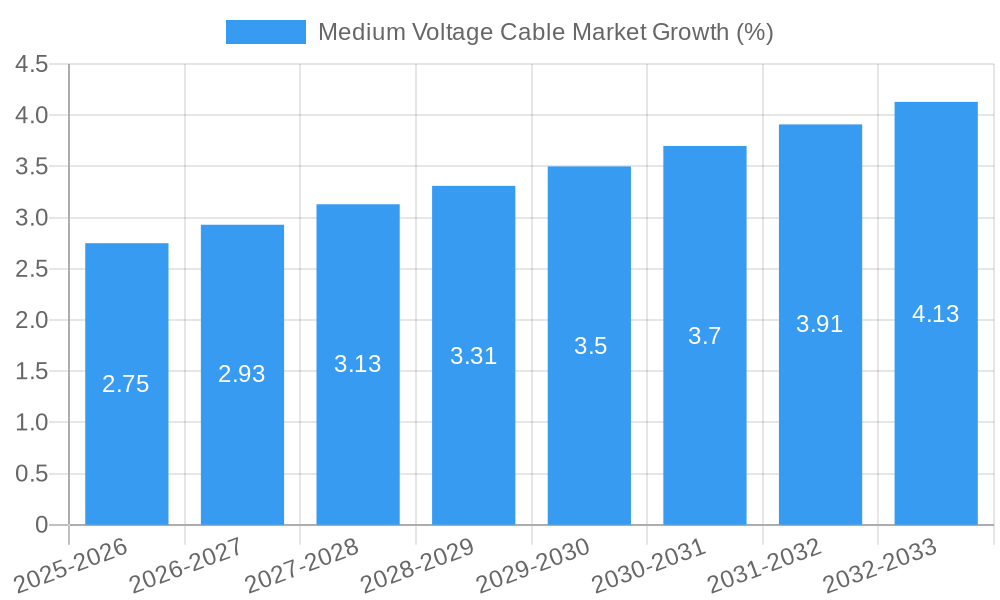
The medium voltage cable market, valued at $48.71 million in 2025, is projected to experience robust growth, exhibiting a Compound Annual Growth Rate (CAGR) of 5.40% from 2025 to 2033. This growth is driven by several key factors. The increasing demand for reliable power distribution across residential, commercial, and industrial sectors fuels market expansion. Furthermore, the rising adoption of renewable energy sources and the expansion of smart grid infrastructure necessitate extensive medium voltage cable installations. Growth is also stimulated by ongoing urbanization and infrastructure development projects globally, particularly in rapidly developing economies in Asia-Pacific. While challenges exist, such as material price fluctuations and the need for specialized installation expertise, the long-term outlook remains positive due to consistent government support for energy infrastructure improvements and the rising need for efficient and dependable power transmission and distribution systems.
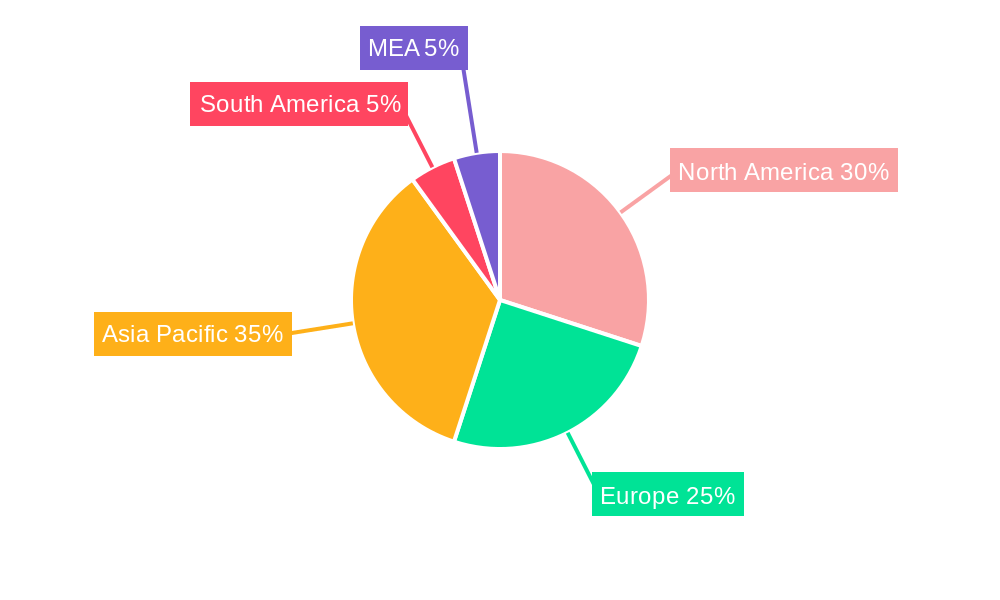
Market segmentation reveals key trends. The greater than 35 kV voltage level segment dominates due to its crucial role in high-capacity power transmission. The C&I application segment is experiencing significant growth, driven by industrial automation and the expansion of manufacturing facilities. XLPE insulation continues to hold a leading market share owing to its superior dielectric strength and durability. Underground deployment is increasingly favored in densely populated areas and environmentally sensitive locations, contributing to overall market growth. Major players like Nexans SA, Prysmian SpA, and Siemens AG are actively investing in research and development to enhance cable technology, introducing innovative solutions that improve efficiency and longevity. Regional analysis indicates strong growth in Asia-Pacific, driven by rapid economic development and large-scale infrastructure projects in countries like China and India, while North America and Europe maintain substantial market shares due to established grid infrastructure and ongoing upgrades.
This in-depth report provides a comprehensive analysis of the Medium Voltage Cable Market, offering invaluable insights for industry professionals, investors, and strategic decision-makers. The report covers the period 2019-2033, with a focus on the forecast period 2025-2033 and a base year of 2025. Discover key trends, growth drivers, challenges, and opportunities within this dynamic market.
Medium Voltage Cable Market Market Structure & Innovation Trends
This section analyzes the market concentration, innovation drivers, regulatory landscape, and competitive dynamics within the medium voltage cable sector. We examine the impact of mergers and acquisitions (M&A) on market share and explore the role of technological advancements in shaping industry trends. The analysis includes:
Market Concentration: We assess the market share held by key players such as Nexans SA, NKT AS, The Okonite Company, Prysmian SpA, Siemens AG, Southwire Company LLC, Riyadh Cables Group, Eland Cables Ltd, Cablel Hellenic Cables Group, and General Cables Corporation, among others. Market concentration is expected to be xx% in 2025, showing a xx% change from 2019.
Innovation Drivers: The report identifies key technological advancements driving innovation, including advancements in insulation materials (XLPE, EPR, etc.) and cable design.
Regulatory Frameworks: We assess the impact of relevant regulations and standards on market growth and adoption of new technologies.
Product Substitutes: An evaluation of potential substitute products and their impact on market dynamics is included.
M&A Activities: Analysis of recent M&A activity, including deal values and their effect on market consolidation, is presented. We project approximately xx Million in M&A deal values for the forecast period.
End-User Demographics: The report segments the market by end-user, including residential, commercial and industrial (C&I), and utility sectors, providing insights into consumption patterns and growth potential in each segment.
Medium Voltage Cable Market Market Dynamics & Trends
This section delves into the key factors influencing the growth trajectory of the medium voltage cable market. We analyze market growth drivers, technological disruptions, evolving consumer preferences, and the competitive landscape. The analysis encompasses:
Market Growth Drivers: Factors such as increasing urbanization, expanding power grids, and the growth of renewable energy projects are analyzed to determine their impact on market size and growth, with a projected CAGR of xx% during the forecast period.
Technological Disruptions: The influence of new materials, improved manufacturing processes, and smart grid technologies on market penetration is examined.
Consumer Preferences: We explore how evolving consumer needs and preferences are shaping demand for different types of medium voltage cables.
Competitive Dynamics: The report analyzes the competitive landscape, including pricing strategies, product differentiation, and market share dynamics among leading players. Market penetration of key players is projected to change by xx% by 2033.
Dominant Regions & Segments in Medium Voltage Cable Market
This section identifies the leading regions, countries, and segments within the medium voltage cable market. The analysis considers factors such as economic policies, infrastructure development, and regulatory environments that contribute to regional dominance.
Leading Regions: [Detailed paragraph analysis of leading regions, including specific market size estimations for each region and key growth drivers. For example, a specific region might dominate due to large-scale infrastructure projects. ]
Voltage Level: Analysis of the market share held by "Less than 35 kV" and "Greater than 35 kV" segments, including growth projections and key drivers.
Application: Breakdown of the market by residential, Commercial and Industrial (C&I), and utility sectors, highlighting the dominant segment and explaining the reasons for its success.
Insulation: Comparative analysis of Cross-linked Polyethylene (XLPE), Ethylene Propylene Rubber (EPR), and Other Insulations, emphasizing market share and growth trends.
Location of Deployment: Market segmentation by overhead and underground deployment, assessing the dominance of each segment and its underlying drivers.
(Each bullet point above will contain detailed analysis and specific market size data, approximately 200 words per bullet)
Medium Voltage Cable Market Product Innovations
This section summarizes recent technological advancements and product developments in the medium voltage cable industry. We examine how these innovations contribute to improved performance, efficiency, and market competitiveness. [Detailed paragraph summarizing product innovations, technological trends, and their market fit. Approximately 100-150 words.]
Report Scope & Segmentation Analysis
The report comprehensively segments the medium voltage cable market based on voltage level, application, insulation type, and location of deployment. Each segment includes growth projections, market size estimations, and an analysis of competitive dynamics.
[Paragraph for each segment: Voltage Level (Less than 35 kV, Greater than 35 kV), Application (Residential, Commercial and Industrial (C&I), Utility), Insulation (Cross-linked Polyethylene (XLPE), Ethylene Propylene Rubber (EPR), Other Insulations), Location of Deployment (Overhead, Underground). Each paragraph should be approximately 25 words, describing the segment, its projected growth, and competitive dynamics.]
Key Drivers of Medium Voltage Cable Market Growth
Several factors are driving growth in the medium voltage cable market. Key drivers include:
Technological advancements in cable materials and design leading to enhanced efficiency and longevity.
Increasing demand for electricity in rapidly urbanizing regions globally.
Government initiatives and investments in infrastructure development, particularly in smart grids.
Challenges in the Medium Voltage Cable Market Sector
The medium voltage cable market faces several challenges including:
Fluctuations in raw material prices impacting manufacturing costs and profitability.
Stringent regulatory requirements and compliance standards increasing operational complexities.
Intense competition among established players and the emergence of new entrants.
Emerging Opportunities in Medium Voltage Cable Market
Emerging opportunities exist for growth within the medium voltage cable market, including:
Expansion into new and developing markets with growing demand for power infrastructure.
Adoption of eco-friendly and sustainable manufacturing processes.
Development of smart cables integrating advanced sensor and communication technologies.
Leading Players in the Medium Voltage Cable Market Market
- Nexans SA
- NKT AS
- The Okonite Company
- Prysmian SpA
- Siemens AG
- Southwire Company LLC
- Riyadh Cables Group
- Eland Cables Ltd
- Cablel Hellenic Cables Group
- General Cables Corporation
Key Developments in Medium Voltage Cable Market Industry
February 2023: Prysmian Group secured a medium-voltage cable framework agreement with National Grid Electricity Distribution in the UK for a minimum of 3 years, signifying significant market share gains and underscoring the increasing demand for grid upgrades.
May 2023: NKT won a turnkey contract from Ellevio to upgrade the power grid in Stockholm, Sweden, highlighting the ongoing investments in grid modernization and replacement projects.
Future Outlook for Medium Voltage Cable Market Market
The medium voltage cable market is poised for sustained growth driven by factors such as increasing electricity demand, investments in grid infrastructure modernization, and the expansion of renewable energy. Strategic partnerships, technological innovations, and geographic expansion will play a key role in shaping the future of the market. The market is expected to reach xx Million by 2033, representing substantial growth potential for key players.
Medium Voltage Cable Market Segmentation
-
1. Voltage Level
- 1.1. Less than 35 kV
- 1.2. Greater than 35 kV
-
2. Application
- 2.1. Residential
- 2.2. Commercial and Industrial (C&I)
- 2.3. Utility
-
3. Insulation
- 3.1. Cross-linked Polyethylene (XLPE)
- 3.2. Ethylene Propylene Rubber (EPR)
- 3.3. Other Insulations
-
4. Location of Deployment
- 4.1. Overhead
- 4.2. Underground
Medium Voltage Cable Market Segmentation By Geography
-
1. North America
- 1.1. United States
- 1.2. Canada
- 1.3. Rest of North America
-
2. Europe
- 2.1. United Kingdom
- 2.2. Spain
- 2.3. NORDIC
- 2.4. Russia
- 2.5. Turkey
- 2.6. Germany
- 2.7. Italy
- 2.8. Rest of Europe
-
3. Asia Pacific
- 3.1. China
- 3.2. India
- 3.3. Japan
- 3.4. Malaysia
- 3.5. Thailand
- 3.6. Indonesia
- 3.7. Vietnam
- 3.8. Rest of Asia Pacific
-
4. South America
- 4.1. Brazil
- 4.2. Argentina
- 4.3. Colombia
- 4.4. Rest of South America
-
5. Middle East and Africa
- 5.1. United Arab Emirates
- 5.2. Saudi Arabia
- 5.3. South Africa
- 5.4. Nigeria
- 5.5. Qatar
- 5.6. Egypt
- 5.7. Rest of Middle East and Africa
Medium Voltage Cable Market REPORT HIGHLIGHTS
| Aspects | Details |
|---|---|
| Study Period | 2019-2033 |
| Base Year | 2024 |
| Estimated Year | 2025 |
| Forecast Period | 2025-2033 |
| Historical Period | 2019-2024 |
| Growth Rate | CAGR of 5.40% from 2019-2033 |
| Segmentation |
|
Table of Contents
- 1. Introduction
- 1.1. Research Scope
- 1.2. Market Segmentation
- 1.3. Research Methodology
- 1.4. Definitions and Assumptions
- 2. Executive Summary
- 2.1. Introduction
- 3. Market Dynamics
- 3.1. Introduction
- 3.2. Market Drivers
- 3.2.1. 4.; Increase in Electricity Propelled by Growing Industrialization and Urbanization4.; Aging Power Sector Infrastructure
- 3.3. Market Restrains
- 3.3.1. 4.; Limited Investments to Support Medium-voltage Transmission Network
- 3.4. Market Trends
- 3.4.1. The Underground Segment to Witness Significant Growth
- 4. Market Factor Analysis
- 4.1. Porters Five Forces
- 4.2. Supply/Value Chain
- 4.3. PESTEL analysis
- 4.4. Market Entropy
- 4.5. Patent/Trademark Analysis
- 5. Global Medium Voltage Cable Market Analysis, Insights and Forecast, 2019-2031
- 5.1. Market Analysis, Insights and Forecast - by Voltage Level
- 5.1.1. Less than 35 kV
- 5.1.2. Greater than 35 kV
- 5.2. Market Analysis, Insights and Forecast - by Application
- 5.2.1. Residential
- 5.2.2. Commercial and Industrial (C&I)
- 5.2.3. Utility
- 5.3. Market Analysis, Insights and Forecast - by Insulation
- 5.3.1. Cross-linked Polyethylene (XLPE)
- 5.3.2. Ethylene Propylene Rubber (EPR)
- 5.3.3. Other Insulations
- 5.4. Market Analysis, Insights and Forecast - by Location of Deployment
- 5.4.1. Overhead
- 5.4.2. Underground
- 5.5. Market Analysis, Insights and Forecast - by Region
- 5.5.1. North America
- 5.5.2. Europe
- 5.5.3. Asia Pacific
- 5.5.4. South America
- 5.5.5. Middle East and Africa
- 5.1. Market Analysis, Insights and Forecast - by Voltage Level
- 6. North America Medium Voltage Cable Market Analysis, Insights and Forecast, 2019-2031
- 6.1. Market Analysis, Insights and Forecast - by Voltage Level
- 6.1.1. Less than 35 kV
- 6.1.2. Greater than 35 kV
- 6.2. Market Analysis, Insights and Forecast - by Application
- 6.2.1. Residential
- 6.2.2. Commercial and Industrial (C&I)
- 6.2.3. Utility
- 6.3. Market Analysis, Insights and Forecast - by Insulation
- 6.3.1. Cross-linked Polyethylene (XLPE)
- 6.3.2. Ethylene Propylene Rubber (EPR)
- 6.3.3. Other Insulations
- 6.4. Market Analysis, Insights and Forecast - by Location of Deployment
- 6.4.1. Overhead
- 6.4.2. Underground
- 6.1. Market Analysis, Insights and Forecast - by Voltage Level
- 7. Europe Medium Voltage Cable Market Analysis, Insights and Forecast, 2019-2031
- 7.1. Market Analysis, Insights and Forecast - by Voltage Level
- 7.1.1. Less than 35 kV
- 7.1.2. Greater than 35 kV
- 7.2. Market Analysis, Insights and Forecast - by Application
- 7.2.1. Residential
- 7.2.2. Commercial and Industrial (C&I)
- 7.2.3. Utility
- 7.3. Market Analysis, Insights and Forecast - by Insulation
- 7.3.1. Cross-linked Polyethylene (XLPE)
- 7.3.2. Ethylene Propylene Rubber (EPR)
- 7.3.3. Other Insulations
- 7.4. Market Analysis, Insights and Forecast - by Location of Deployment
- 7.4.1. Overhead
- 7.4.2. Underground
- 7.1. Market Analysis, Insights and Forecast - by Voltage Level
- 8. Asia Pacific Medium Voltage Cable Market Analysis, Insights and Forecast, 2019-2031
- 8.1. Market Analysis, Insights and Forecast - by Voltage Level
- 8.1.1. Less than 35 kV
- 8.1.2. Greater than 35 kV
- 8.2. Market Analysis, Insights and Forecast - by Application
- 8.2.1. Residential
- 8.2.2. Commercial and Industrial (C&I)
- 8.2.3. Utility
- 8.3. Market Analysis, Insights and Forecast - by Insulation
- 8.3.1. Cross-linked Polyethylene (XLPE)
- 8.3.2. Ethylene Propylene Rubber (EPR)
- 8.3.3. Other Insulations
- 8.4. Market Analysis, Insights and Forecast - by Location of Deployment
- 8.4.1. Overhead
- 8.4.2. Underground
- 8.1. Market Analysis, Insights and Forecast - by Voltage Level
- 9. South America Medium Voltage Cable Market Analysis, Insights and Forecast, 2019-2031
- 9.1. Market Analysis, Insights and Forecast - by Voltage Level
- 9.1.1. Less than 35 kV
- 9.1.2. Greater than 35 kV
- 9.2. Market Analysis, Insights and Forecast - by Application
- 9.2.1. Residential
- 9.2.2. Commercial and Industrial (C&I)
- 9.2.3. Utility
- 9.3. Market Analysis, Insights and Forecast - by Insulation
- 9.3.1. Cross-linked Polyethylene (XLPE)
- 9.3.2. Ethylene Propylene Rubber (EPR)
- 9.3.3. Other Insulations
- 9.4. Market Analysis, Insights and Forecast - by Location of Deployment
- 9.4.1. Overhead
- 9.4.2. Underground
- 9.1. Market Analysis, Insights and Forecast - by Voltage Level
- 10. Middle East and Africa Medium Voltage Cable Market Analysis, Insights and Forecast, 2019-2031
- 10.1. Market Analysis, Insights and Forecast - by Voltage Level
- 10.1.1. Less than 35 kV
- 10.1.2. Greater than 35 kV
- 10.2. Market Analysis, Insights and Forecast - by Application
- 10.2.1. Residential
- 10.2.2. Commercial and Industrial (C&I)
- 10.2.3. Utility
- 10.3. Market Analysis, Insights and Forecast - by Insulation
- 10.3.1. Cross-linked Polyethylene (XLPE)
- 10.3.2. Ethylene Propylene Rubber (EPR)
- 10.3.3. Other Insulations
- 10.4. Market Analysis, Insights and Forecast - by Location of Deployment
- 10.4.1. Overhead
- 10.4.2. Underground
- 10.1. Market Analysis, Insights and Forecast - by Voltage Level
- 11. North America Medium Voltage Cable Market Analysis, Insights and Forecast, 2019-2031
- 11.1. Market Analysis, Insights and Forecast - By Country/Sub-region
- 11.1.1 United States
- 11.1.2 Canada
- 11.1.3 Mexico
- 12. Europe Medium Voltage Cable Market Analysis, Insights and Forecast, 2019-2031
- 12.1. Market Analysis, Insights and Forecast - By Country/Sub-region
- 12.1.1 Germany
- 12.1.2 United Kingdom
- 12.1.3 France
- 12.1.4 Spain
- 12.1.5 Italy
- 12.1.6 Spain
- 12.1.7 Belgium
- 12.1.8 Netherland
- 12.1.9 Nordics
- 12.1.10 Rest of Europe
- 13. Asia Pacific Medium Voltage Cable Market Analysis, Insights and Forecast, 2019-2031
- 13.1. Market Analysis, Insights and Forecast - By Country/Sub-region
- 13.1.1 China
- 13.1.2 Japan
- 13.1.3 India
- 13.1.4 South Korea
- 13.1.5 Southeast Asia
- 13.1.6 Australia
- 13.1.7 Indonesia
- 13.1.8 Phillipes
- 13.1.9 Singapore
- 13.1.10 Thailandc
- 13.1.11 Rest of Asia Pacific
- 14. South America Medium Voltage Cable Market Analysis, Insights and Forecast, 2019-2031
- 14.1. Market Analysis, Insights and Forecast - By Country/Sub-region
- 14.1.1 Brazil
- 14.1.2 Argentina
- 14.1.3 Peru
- 14.1.4 Chile
- 14.1.5 Colombia
- 14.1.6 Ecuador
- 14.1.7 Venezuela
- 14.1.8 Rest of South America
- 15. North America Medium Voltage Cable Market Analysis, Insights and Forecast, 2019-2031
- 15.1. Market Analysis, Insights and Forecast - By Country/Sub-region
- 15.1.1 United States
- 15.1.2 Canada
- 15.1.3 Mexico
- 16. MEA Medium Voltage Cable Market Analysis, Insights and Forecast, 2019-2031
- 16.1. Market Analysis, Insights and Forecast - By Country/Sub-region
- 16.1.1 United Arab Emirates
- 16.1.2 Saudi Arabia
- 16.1.3 South Africa
- 16.1.4 Rest of Middle East and Africa
- 17. Competitive Analysis
- 17.1. Global Market Share Analysis 2024
- 17.2. Company Profiles
- 17.2.1 Nexans SA
- 17.2.1.1. Overview
- 17.2.1.2. Products
- 17.2.1.3. SWOT Analysis
- 17.2.1.4. Recent Developments
- 17.2.1.5. Financials (Based on Availability)
- 17.2.2 NKT AS
- 17.2.2.1. Overview
- 17.2.2.2. Products
- 17.2.2.3. SWOT Analysis
- 17.2.2.4. Recent Developments
- 17.2.2.5. Financials (Based on Availability)
- 17.2.3 The Okonite Company
- 17.2.3.1. Overview
- 17.2.3.2. Products
- 17.2.3.3. SWOT Analysis
- 17.2.3.4. Recent Developments
- 17.2.3.5. Financials (Based on Availability)
- 17.2.4 Prysmian SpA
- 17.2.4.1. Overview
- 17.2.4.2. Products
- 17.2.4.3. SWOT Analysis
- 17.2.4.4. Recent Developments
- 17.2.4.5. Financials (Based on Availability)
- 17.2.5 Siemens AG
- 17.2.5.1. Overview
- 17.2.5.2. Products
- 17.2.5.3. SWOT Analysis
- 17.2.5.4. Recent Developments
- 17.2.5.5. Financials (Based on Availability)
- 17.2.6 Southwire Company LLC
- 17.2.6.1. Overview
- 17.2.6.2. Products
- 17.2.6.3. SWOT Analysis
- 17.2.6.4. Recent Developments
- 17.2.6.5. Financials (Based on Availability)
- 17.2.7 Riyadh Cables Group
- 17.2.7.1. Overview
- 17.2.7.2. Products
- 17.2.7.3. SWOT Analysis
- 17.2.7.4. Recent Developments
- 17.2.7.5. Financials (Based on Availability)
- 17.2.8 Eland Cables Ltd
- 17.2.8.1. Overview
- 17.2.8.2. Products
- 17.2.8.3. SWOT Analysis
- 17.2.8.4. Recent Developments
- 17.2.8.5. Financials (Based on Availability)
- 17.2.9 Cablel Hellenic Cables Group
- 17.2.9.1. Overview
- 17.2.9.2. Products
- 17.2.9.3. SWOT Analysis
- 17.2.9.4. Recent Developments
- 17.2.9.5. Financials (Based on Availability)
- 17.2.10 General Cables Corporation*List Not Exhaustive 6 4 Market Ranking Analysi
- 17.2.10.1. Overview
- 17.2.10.2. Products
- 17.2.10.3. SWOT Analysis
- 17.2.10.4. Recent Developments
- 17.2.10.5. Financials (Based on Availability)
- 17.2.1 Nexans SA
List of Figures
- Figure 1: Global Medium Voltage Cable Market Revenue Breakdown (Million, %) by Region 2024 & 2032
- Figure 2: Global Medium Voltage Cable Market Volume Breakdown (Meter, %) by Region 2024 & 2032
- Figure 3: North America Medium Voltage Cable Market Revenue (Million), by Country 2024 & 2032
- Figure 4: North America Medium Voltage Cable Market Volume (Meter), by Country 2024 & 2032
- Figure 5: North America Medium Voltage Cable Market Revenue Share (%), by Country 2024 & 2032
- Figure 6: North America Medium Voltage Cable Market Volume Share (%), by Country 2024 & 2032
- Figure 7: Europe Medium Voltage Cable Market Revenue (Million), by Country 2024 & 2032
- Figure 8: Europe Medium Voltage Cable Market Volume (Meter), by Country 2024 & 2032
- Figure 9: Europe Medium Voltage Cable Market Revenue Share (%), by Country 2024 & 2032
- Figure 10: Europe Medium Voltage Cable Market Volume Share (%), by Country 2024 & 2032
- Figure 11: Asia Pacific Medium Voltage Cable Market Revenue (Million), by Country 2024 & 2032
- Figure 12: Asia Pacific Medium Voltage Cable Market Volume (Meter), by Country 2024 & 2032
- Figure 13: Asia Pacific Medium Voltage Cable Market Revenue Share (%), by Country 2024 & 2032
- Figure 14: Asia Pacific Medium Voltage Cable Market Volume Share (%), by Country 2024 & 2032
- Figure 15: South America Medium Voltage Cable Market Revenue (Million), by Country 2024 & 2032
- Figure 16: South America Medium Voltage Cable Market Volume (Meter), by Country 2024 & 2032
- Figure 17: South America Medium Voltage Cable Market Revenue Share (%), by Country 2024 & 2032
- Figure 18: South America Medium Voltage Cable Market Volume Share (%), by Country 2024 & 2032
- Figure 19: North America Medium Voltage Cable Market Revenue (Million), by Country 2024 & 2032
- Figure 20: North America Medium Voltage Cable Market Volume (Meter), by Country 2024 & 2032
- Figure 21: North America Medium Voltage Cable Market Revenue Share (%), by Country 2024 & 2032
- Figure 22: North America Medium Voltage Cable Market Volume Share (%), by Country 2024 & 2032
- Figure 23: MEA Medium Voltage Cable Market Revenue (Million), by Country 2024 & 2032
- Figure 24: MEA Medium Voltage Cable Market Volume (Meter), by Country 2024 & 2032
- Figure 25: MEA Medium Voltage Cable Market Revenue Share (%), by Country 2024 & 2032
- Figure 26: MEA Medium Voltage Cable Market Volume Share (%), by Country 2024 & 2032
- Figure 27: North America Medium Voltage Cable Market Revenue (Million), by Voltage Level 2024 & 2032
- Figure 28: North America Medium Voltage Cable Market Volume (Meter), by Voltage Level 2024 & 2032
- Figure 29: North America Medium Voltage Cable Market Revenue Share (%), by Voltage Level 2024 & 2032
- Figure 30: North America Medium Voltage Cable Market Volume Share (%), by Voltage Level 2024 & 2032
- Figure 31: North America Medium Voltage Cable Market Revenue (Million), by Application 2024 & 2032
- Figure 32: North America Medium Voltage Cable Market Volume (Meter), by Application 2024 & 2032
- Figure 33: North America Medium Voltage Cable Market Revenue Share (%), by Application 2024 & 2032
- Figure 34: North America Medium Voltage Cable Market Volume Share (%), by Application 2024 & 2032
- Figure 35: North America Medium Voltage Cable Market Revenue (Million), by Insulation 2024 & 2032
- Figure 36: North America Medium Voltage Cable Market Volume (Meter), by Insulation 2024 & 2032
- Figure 37: North America Medium Voltage Cable Market Revenue Share (%), by Insulation 2024 & 2032
- Figure 38: North America Medium Voltage Cable Market Volume Share (%), by Insulation 2024 & 2032
- Figure 39: North America Medium Voltage Cable Market Revenue (Million), by Location of Deployment 2024 & 2032
- Figure 40: North America Medium Voltage Cable Market Volume (Meter), by Location of Deployment 2024 & 2032
- Figure 41: North America Medium Voltage Cable Market Revenue Share (%), by Location of Deployment 2024 & 2032
- Figure 42: North America Medium Voltage Cable Market Volume Share (%), by Location of Deployment 2024 & 2032
- Figure 43: North America Medium Voltage Cable Market Revenue (Million), by Country 2024 & 2032
- Figure 44: North America Medium Voltage Cable Market Volume (Meter), by Country 2024 & 2032
- Figure 45: North America Medium Voltage Cable Market Revenue Share (%), by Country 2024 & 2032
- Figure 46: North America Medium Voltage Cable Market Volume Share (%), by Country 2024 & 2032
- Figure 47: Europe Medium Voltage Cable Market Revenue (Million), by Voltage Level 2024 & 2032
- Figure 48: Europe Medium Voltage Cable Market Volume (Meter), by Voltage Level 2024 & 2032
- Figure 49: Europe Medium Voltage Cable Market Revenue Share (%), by Voltage Level 2024 & 2032
- Figure 50: Europe Medium Voltage Cable Market Volume Share (%), by Voltage Level 2024 & 2032
- Figure 51: Europe Medium Voltage Cable Market Revenue (Million), by Application 2024 & 2032
- Figure 52: Europe Medium Voltage Cable Market Volume (Meter), by Application 2024 & 2032
- Figure 53: Europe Medium Voltage Cable Market Revenue Share (%), by Application 2024 & 2032
- Figure 54: Europe Medium Voltage Cable Market Volume Share (%), by Application 2024 & 2032
- Figure 55: Europe Medium Voltage Cable Market Revenue (Million), by Insulation 2024 & 2032
- Figure 56: Europe Medium Voltage Cable Market Volume (Meter), by Insulation 2024 & 2032
- Figure 57: Europe Medium Voltage Cable Market Revenue Share (%), by Insulation 2024 & 2032
- Figure 58: Europe Medium Voltage Cable Market Volume Share (%), by Insulation 2024 & 2032
- Figure 59: Europe Medium Voltage Cable Market Revenue (Million), by Location of Deployment 2024 & 2032
- Figure 60: Europe Medium Voltage Cable Market Volume (Meter), by Location of Deployment 2024 & 2032
- Figure 61: Europe Medium Voltage Cable Market Revenue Share (%), by Location of Deployment 2024 & 2032
- Figure 62: Europe Medium Voltage Cable Market Volume Share (%), by Location of Deployment 2024 & 2032
- Figure 63: Europe Medium Voltage Cable Market Revenue (Million), by Country 2024 & 2032
- Figure 64: Europe Medium Voltage Cable Market Volume (Meter), by Country 2024 & 2032
- Figure 65: Europe Medium Voltage Cable Market Revenue Share (%), by Country 2024 & 2032
- Figure 66: Europe Medium Voltage Cable Market Volume Share (%), by Country 2024 & 2032
- Figure 67: Asia Pacific Medium Voltage Cable Market Revenue (Million), by Voltage Level 2024 & 2032
- Figure 68: Asia Pacific Medium Voltage Cable Market Volume (Meter), by Voltage Level 2024 & 2032
- Figure 69: Asia Pacific Medium Voltage Cable Market Revenue Share (%), by Voltage Level 2024 & 2032
- Figure 70: Asia Pacific Medium Voltage Cable Market Volume Share (%), by Voltage Level 2024 & 2032
- Figure 71: Asia Pacific Medium Voltage Cable Market Revenue (Million), by Application 2024 & 2032
- Figure 72: Asia Pacific Medium Voltage Cable Market Volume (Meter), by Application 2024 & 2032
- Figure 73: Asia Pacific Medium Voltage Cable Market Revenue Share (%), by Application 2024 & 2032
- Figure 74: Asia Pacific Medium Voltage Cable Market Volume Share (%), by Application 2024 & 2032
- Figure 75: Asia Pacific Medium Voltage Cable Market Revenue (Million), by Insulation 2024 & 2032
- Figure 76: Asia Pacific Medium Voltage Cable Market Volume (Meter), by Insulation 2024 & 2032
- Figure 77: Asia Pacific Medium Voltage Cable Market Revenue Share (%), by Insulation 2024 & 2032
- Figure 78: Asia Pacific Medium Voltage Cable Market Volume Share (%), by Insulation 2024 & 2032
- Figure 79: Asia Pacific Medium Voltage Cable Market Revenue (Million), by Location of Deployment 2024 & 2032
- Figure 80: Asia Pacific Medium Voltage Cable Market Volume (Meter), by Location of Deployment 2024 & 2032
- Figure 81: Asia Pacific Medium Voltage Cable Market Revenue Share (%), by Location of Deployment 2024 & 2032
- Figure 82: Asia Pacific Medium Voltage Cable Market Volume Share (%), by Location of Deployment 2024 & 2032
- Figure 83: Asia Pacific Medium Voltage Cable Market Revenue (Million), by Country 2024 & 2032
- Figure 84: Asia Pacific Medium Voltage Cable Market Volume (Meter), by Country 2024 & 2032
- Figure 85: Asia Pacific Medium Voltage Cable Market Revenue Share (%), by Country 2024 & 2032
- Figure 86: Asia Pacific Medium Voltage Cable Market Volume Share (%), by Country 2024 & 2032
- Figure 87: South America Medium Voltage Cable Market Revenue (Million), by Voltage Level 2024 & 2032
- Figure 88: South America Medium Voltage Cable Market Volume (Meter), by Voltage Level 2024 & 2032
- Figure 89: South America Medium Voltage Cable Market Revenue Share (%), by Voltage Level 2024 & 2032
- Figure 90: South America Medium Voltage Cable Market Volume Share (%), by Voltage Level 2024 & 2032
- Figure 91: South America Medium Voltage Cable Market Revenue (Million), by Application 2024 & 2032
- Figure 92: South America Medium Voltage Cable Market Volume (Meter), by Application 2024 & 2032
- Figure 93: South America Medium Voltage Cable Market Revenue Share (%), by Application 2024 & 2032
- Figure 94: South America Medium Voltage Cable Market Volume Share (%), by Application 2024 & 2032
- Figure 95: South America Medium Voltage Cable Market Revenue (Million), by Insulation 2024 & 2032
- Figure 96: South America Medium Voltage Cable Market Volume (Meter), by Insulation 2024 & 2032
- Figure 97: South America Medium Voltage Cable Market Revenue Share (%), by Insulation 2024 & 2032
- Figure 98: South America Medium Voltage Cable Market Volume Share (%), by Insulation 2024 & 2032
- Figure 99: South America Medium Voltage Cable Market Revenue (Million), by Location of Deployment 2024 & 2032
- Figure 100: South America Medium Voltage Cable Market Volume (Meter), by Location of Deployment 2024 & 2032
- Figure 101: South America Medium Voltage Cable Market Revenue Share (%), by Location of Deployment 2024 & 2032
- Figure 102: South America Medium Voltage Cable Market Volume Share (%), by Location of Deployment 2024 & 2032
- Figure 103: South America Medium Voltage Cable Market Revenue (Million), by Country 2024 & 2032
- Figure 104: South America Medium Voltage Cable Market Volume (Meter), by Country 2024 & 2032
- Figure 105: South America Medium Voltage Cable Market Revenue Share (%), by Country 2024 & 2032
- Figure 106: South America Medium Voltage Cable Market Volume Share (%), by Country 2024 & 2032
- Figure 107: Middle East and Africa Medium Voltage Cable Market Revenue (Million), by Voltage Level 2024 & 2032
- Figure 108: Middle East and Africa Medium Voltage Cable Market Volume (Meter), by Voltage Level 2024 & 2032
- Figure 109: Middle East and Africa Medium Voltage Cable Market Revenue Share (%), by Voltage Level 2024 & 2032
- Figure 110: Middle East and Africa Medium Voltage Cable Market Volume Share (%), by Voltage Level 2024 & 2032
- Figure 111: Middle East and Africa Medium Voltage Cable Market Revenue (Million), by Application 2024 & 2032
- Figure 112: Middle East and Africa Medium Voltage Cable Market Volume (Meter), by Application 2024 & 2032
- Figure 113: Middle East and Africa Medium Voltage Cable Market Revenue Share (%), by Application 2024 & 2032
- Figure 114: Middle East and Africa Medium Voltage Cable Market Volume Share (%), by Application 2024 & 2032
- Figure 115: Middle East and Africa Medium Voltage Cable Market Revenue (Million), by Insulation 2024 & 2032
- Figure 116: Middle East and Africa Medium Voltage Cable Market Volume (Meter), by Insulation 2024 & 2032
- Figure 117: Middle East and Africa Medium Voltage Cable Market Revenue Share (%), by Insulation 2024 & 2032
- Figure 118: Middle East and Africa Medium Voltage Cable Market Volume Share (%), by Insulation 2024 & 2032
- Figure 119: Middle East and Africa Medium Voltage Cable Market Revenue (Million), by Location of Deployment 2024 & 2032
- Figure 120: Middle East and Africa Medium Voltage Cable Market Volume (Meter), by Location of Deployment 2024 & 2032
- Figure 121: Middle East and Africa Medium Voltage Cable Market Revenue Share (%), by Location of Deployment 2024 & 2032
- Figure 122: Middle East and Africa Medium Voltage Cable Market Volume Share (%), by Location of Deployment 2024 & 2032
- Figure 123: Middle East and Africa Medium Voltage Cable Market Revenue (Million), by Country 2024 & 2032
- Figure 124: Middle East and Africa Medium Voltage Cable Market Volume (Meter), by Country 2024 & 2032
- Figure 125: Middle East and Africa Medium Voltage Cable Market Revenue Share (%), by Country 2024 & 2032
- Figure 126: Middle East and Africa Medium Voltage Cable Market Volume Share (%), by Country 2024 & 2032
List of Tables
- Table 1: Global Medium Voltage Cable Market Revenue Million Forecast, by Region 2019 & 2032
- Table 2: Global Medium Voltage Cable Market Volume Meter Forecast, by Region 2019 & 2032
- Table 3: Global Medium Voltage Cable Market Revenue Million Forecast, by Voltage Level 2019 & 2032
- Table 4: Global Medium Voltage Cable Market Volume Meter Forecast, by Voltage Level 2019 & 2032
- Table 5: Global Medium Voltage Cable Market Revenue Million Forecast, by Application 2019 & 2032
- Table 6: Global Medium Voltage Cable Market Volume Meter Forecast, by Application 2019 & 2032
- Table 7: Global Medium Voltage Cable Market Revenue Million Forecast, by Insulation 2019 & 2032
- Table 8: Global Medium Voltage Cable Market Volume Meter Forecast, by Insulation 2019 & 2032
- Table 9: Global Medium Voltage Cable Market Revenue Million Forecast, by Location of Deployment 2019 & 2032
- Table 10: Global Medium Voltage Cable Market Volume Meter Forecast, by Location of Deployment 2019 & 2032
- Table 11: Global Medium Voltage Cable Market Revenue Million Forecast, by Region 2019 & 2032
- Table 12: Global Medium Voltage Cable Market Volume Meter Forecast, by Region 2019 & 2032
- Table 13: Global Medium Voltage Cable Market Revenue Million Forecast, by Country 2019 & 2032
- Table 14: Global Medium Voltage Cable Market Volume Meter Forecast, by Country 2019 & 2032
- Table 15: United States Medium Voltage Cable Market Revenue (Million) Forecast, by Application 2019 & 2032
- Table 16: United States Medium Voltage Cable Market Volume (Meter) Forecast, by Application 2019 & 2032
- Table 17: Canada Medium Voltage Cable Market Revenue (Million) Forecast, by Application 2019 & 2032
- Table 18: Canada Medium Voltage Cable Market Volume (Meter) Forecast, by Application 2019 & 2032
- Table 19: Mexico Medium Voltage Cable Market Revenue (Million) Forecast, by Application 2019 & 2032
- Table 20: Mexico Medium Voltage Cable Market Volume (Meter) Forecast, by Application 2019 & 2032
- Table 21: Global Medium Voltage Cable Market Revenue Million Forecast, by Country 2019 & 2032
- Table 22: Global Medium Voltage Cable Market Volume Meter Forecast, by Country 2019 & 2032
- Table 23: Germany Medium Voltage Cable Market Revenue (Million) Forecast, by Application 2019 & 2032
- Table 24: Germany Medium Voltage Cable Market Volume (Meter) Forecast, by Application 2019 & 2032
- Table 25: United Kingdom Medium Voltage Cable Market Revenue (Million) Forecast, by Application 2019 & 2032
- Table 26: United Kingdom Medium Voltage Cable Market Volume (Meter) Forecast, by Application 2019 & 2032
- Table 27: France Medium Voltage Cable Market Revenue (Million) Forecast, by Application 2019 & 2032
- Table 28: France Medium Voltage Cable Market Volume (Meter) Forecast, by Application 2019 & 2032
- Table 29: Spain Medium Voltage Cable Market Revenue (Million) Forecast, by Application 2019 & 2032
- Table 30: Spain Medium Voltage Cable Market Volume (Meter) Forecast, by Application 2019 & 2032
- Table 31: Italy Medium Voltage Cable Market Revenue (Million) Forecast, by Application 2019 & 2032
- Table 32: Italy Medium Voltage Cable Market Volume (Meter) Forecast, by Application 2019 & 2032
- Table 33: Spain Medium Voltage Cable Market Revenue (Million) Forecast, by Application 2019 & 2032
- Table 34: Spain Medium Voltage Cable Market Volume (Meter) Forecast, by Application 2019 & 2032
- Table 35: Belgium Medium Voltage Cable Market Revenue (Million) Forecast, by Application 2019 & 2032
- Table 36: Belgium Medium Voltage Cable Market Volume (Meter) Forecast, by Application 2019 & 2032
- Table 37: Netherland Medium Voltage Cable Market Revenue (Million) Forecast, by Application 2019 & 2032
- Table 38: Netherland Medium Voltage Cable Market Volume (Meter) Forecast, by Application 2019 & 2032
- Table 39: Nordics Medium Voltage Cable Market Revenue (Million) Forecast, by Application 2019 & 2032
- Table 40: Nordics Medium Voltage Cable Market Volume (Meter) Forecast, by Application 2019 & 2032
- Table 41: Rest of Europe Medium Voltage Cable Market Revenue (Million) Forecast, by Application 2019 & 2032
- Table 42: Rest of Europe Medium Voltage Cable Market Volume (Meter) Forecast, by Application 2019 & 2032
- Table 43: Global Medium Voltage Cable Market Revenue Million Forecast, by Country 2019 & 2032
- Table 44: Global Medium Voltage Cable Market Volume Meter Forecast, by Country 2019 & 2032
- Table 45: China Medium Voltage Cable Market Revenue (Million) Forecast, by Application 2019 & 2032
- Table 46: China Medium Voltage Cable Market Volume (Meter) Forecast, by Application 2019 & 2032
- Table 47: Japan Medium Voltage Cable Market Revenue (Million) Forecast, by Application 2019 & 2032
- Table 48: Japan Medium Voltage Cable Market Volume (Meter) Forecast, by Application 2019 & 2032
- Table 49: India Medium Voltage Cable Market Revenue (Million) Forecast, by Application 2019 & 2032
- Table 50: India Medium Voltage Cable Market Volume (Meter) Forecast, by Application 2019 & 2032
- Table 51: South Korea Medium Voltage Cable Market Revenue (Million) Forecast, by Application 2019 & 2032
- Table 52: South Korea Medium Voltage Cable Market Volume (Meter) Forecast, by Application 2019 & 2032
- Table 53: Southeast Asia Medium Voltage Cable Market Revenue (Million) Forecast, by Application 2019 & 2032
- Table 54: Southeast Asia Medium Voltage Cable Market Volume (Meter) Forecast, by Application 2019 & 2032
- Table 55: Australia Medium Voltage Cable Market Revenue (Million) Forecast, by Application 2019 & 2032
- Table 56: Australia Medium Voltage Cable Market Volume (Meter) Forecast, by Application 2019 & 2032
- Table 57: Indonesia Medium Voltage Cable Market Revenue (Million) Forecast, by Application 2019 & 2032
- Table 58: Indonesia Medium Voltage Cable Market Volume (Meter) Forecast, by Application 2019 & 2032
- Table 59: Phillipes Medium Voltage Cable Market Revenue (Million) Forecast, by Application 2019 & 2032
- Table 60: Phillipes Medium Voltage Cable Market Volume (Meter) Forecast, by Application 2019 & 2032
- Table 61: Singapore Medium Voltage Cable Market Revenue (Million) Forecast, by Application 2019 & 2032
- Table 62: Singapore Medium Voltage Cable Market Volume (Meter) Forecast, by Application 2019 & 2032
- Table 63: Thailandc Medium Voltage Cable Market Revenue (Million) Forecast, by Application 2019 & 2032
- Table 64: Thailandc Medium Voltage Cable Market Volume (Meter) Forecast, by Application 2019 & 2032
- Table 65: Rest of Asia Pacific Medium Voltage Cable Market Revenue (Million) Forecast, by Application 2019 & 2032
- Table 66: Rest of Asia Pacific Medium Voltage Cable Market Volume (Meter) Forecast, by Application 2019 & 2032
- Table 67: Global Medium Voltage Cable Market Revenue Million Forecast, by Country 2019 & 2032
- Table 68: Global Medium Voltage Cable Market Volume Meter Forecast, by Country 2019 & 2032
- Table 69: Brazil Medium Voltage Cable Market Revenue (Million) Forecast, by Application 2019 & 2032
- Table 70: Brazil Medium Voltage Cable Market Volume (Meter) Forecast, by Application 2019 & 2032
- Table 71: Argentina Medium Voltage Cable Market Revenue (Million) Forecast, by Application 2019 & 2032
- Table 72: Argentina Medium Voltage Cable Market Volume (Meter) Forecast, by Application 2019 & 2032
- Table 73: Peru Medium Voltage Cable Market Revenue (Million) Forecast, by Application 2019 & 2032
- Table 74: Peru Medium Voltage Cable Market Volume (Meter) Forecast, by Application 2019 & 2032
- Table 75: Chile Medium Voltage Cable Market Revenue (Million) Forecast, by Application 2019 & 2032
- Table 76: Chile Medium Voltage Cable Market Volume (Meter) Forecast, by Application 2019 & 2032
- Table 77: Colombia Medium Voltage Cable Market Revenue (Million) Forecast, by Application 2019 & 2032
- Table 78: Colombia Medium Voltage Cable Market Volume (Meter) Forecast, by Application 2019 & 2032
- Table 79: Ecuador Medium Voltage Cable Market Revenue (Million) Forecast, by Application 2019 & 2032
- Table 80: Ecuador Medium Voltage Cable Market Volume (Meter) Forecast, by Application 2019 & 2032
- Table 81: Venezuela Medium Voltage Cable Market Revenue (Million) Forecast, by Application 2019 & 2032
- Table 82: Venezuela Medium Voltage Cable Market Volume (Meter) Forecast, by Application 2019 & 2032
- Table 83: Rest of South America Medium Voltage Cable Market Revenue (Million) Forecast, by Application 2019 & 2032
- Table 84: Rest of South America Medium Voltage Cable Market Volume (Meter) Forecast, by Application 2019 & 2032
- Table 85: Global Medium Voltage Cable Market Revenue Million Forecast, by Country 2019 & 2032
- Table 86: Global Medium Voltage Cable Market Volume Meter Forecast, by Country 2019 & 2032
- Table 87: United States Medium Voltage Cable Market Revenue (Million) Forecast, by Application 2019 & 2032
- Table 88: United States Medium Voltage Cable Market Volume (Meter) Forecast, by Application 2019 & 2032
- Table 89: Canada Medium Voltage Cable Market Revenue (Million) Forecast, by Application 2019 & 2032
- Table 90: Canada Medium Voltage Cable Market Volume (Meter) Forecast, by Application 2019 & 2032
- Table 91: Mexico Medium Voltage Cable Market Revenue (Million) Forecast, by Application 2019 & 2032
- Table 92: Mexico Medium Voltage Cable Market Volume (Meter) Forecast, by Application 2019 & 2032
- Table 93: Global Medium Voltage Cable Market Revenue Million Forecast, by Country 2019 & 2032
- Table 94: Global Medium Voltage Cable Market Volume Meter Forecast, by Country 2019 & 2032
- Table 95: United Arab Emirates Medium Voltage Cable Market Revenue (Million) Forecast, by Application 2019 & 2032
- Table 96: United Arab Emirates Medium Voltage Cable Market Volume (Meter) Forecast, by Application 2019 & 2032
- Table 97: Saudi Arabia Medium Voltage Cable Market Revenue (Million) Forecast, by Application 2019 & 2032
- Table 98: Saudi Arabia Medium Voltage Cable Market Volume (Meter) Forecast, by Application 2019 & 2032
- Table 99: South Africa Medium Voltage Cable Market Revenue (Million) Forecast, by Application 2019 & 2032
- Table 100: South Africa Medium Voltage Cable Market Volume (Meter) Forecast, by Application 2019 & 2032
- Table 101: Rest of Middle East and Africa Medium Voltage Cable Market Revenue (Million) Forecast, by Application 2019 & 2032
- Table 102: Rest of Middle East and Africa Medium Voltage Cable Market Volume (Meter) Forecast, by Application 2019 & 2032
- Table 103: Global Medium Voltage Cable Market Revenue Million Forecast, by Voltage Level 2019 & 2032
- Table 104: Global Medium Voltage Cable Market Volume Meter Forecast, by Voltage Level 2019 & 2032
- Table 105: Global Medium Voltage Cable Market Revenue Million Forecast, by Application 2019 & 2032
- Table 106: Global Medium Voltage Cable Market Volume Meter Forecast, by Application 2019 & 2032
- Table 107: Global Medium Voltage Cable Market Revenue Million Forecast, by Insulation 2019 & 2032
- Table 108: Global Medium Voltage Cable Market Volume Meter Forecast, by Insulation 2019 & 2032
- Table 109: Global Medium Voltage Cable Market Revenue Million Forecast, by Location of Deployment 2019 & 2032
- Table 110: Global Medium Voltage Cable Market Volume Meter Forecast, by Location of Deployment 2019 & 2032
- Table 111: Global Medium Voltage Cable Market Revenue Million Forecast, by Country 2019 & 2032
- Table 112: Global Medium Voltage Cable Market Volume Meter Forecast, by Country 2019 & 2032
- Table 113: United States Medium Voltage Cable Market Revenue (Million) Forecast, by Application 2019 & 2032
- Table 114: United States Medium Voltage Cable Market Volume (Meter) Forecast, by Application 2019 & 2032
- Table 115: Canada Medium Voltage Cable Market Revenue (Million) Forecast, by Application 2019 & 2032
- Table 116: Canada Medium Voltage Cable Market Volume (Meter) Forecast, by Application 2019 & 2032
- Table 117: Rest of North America Medium Voltage Cable Market Revenue (Million) Forecast, by Application 2019 & 2032
- Table 118: Rest of North America Medium Voltage Cable Market Volume (Meter) Forecast, by Application 2019 & 2032
- Table 119: Global Medium Voltage Cable Market Revenue Million Forecast, by Voltage Level 2019 & 2032
- Table 120: Global Medium Voltage Cable Market Volume Meter Forecast, by Voltage Level 2019 & 2032
- Table 121: Global Medium Voltage Cable Market Revenue Million Forecast, by Application 2019 & 2032
- Table 122: Global Medium Voltage Cable Market Volume Meter Forecast, by Application 2019 & 2032
- Table 123: Global Medium Voltage Cable Market Revenue Million Forecast, by Insulation 2019 & 2032
- Table 124: Global Medium Voltage Cable Market Volume Meter Forecast, by Insulation 2019 & 2032
- Table 125: Global Medium Voltage Cable Market Revenue Million Forecast, by Location of Deployment 2019 & 2032
- Table 126: Global Medium Voltage Cable Market Volume Meter Forecast, by Location of Deployment 2019 & 2032
- Table 127: Global Medium Voltage Cable Market Revenue Million Forecast, by Country 2019 & 2032
- Table 128: Global Medium Voltage Cable Market Volume Meter Forecast, by Country 2019 & 2032
- Table 129: United Kingdom Medium Voltage Cable Market Revenue (Million) Forecast, by Application 2019 & 2032
- Table 130: United Kingdom Medium Voltage Cable Market Volume (Meter) Forecast, by Application 2019 & 2032
- Table 131: Spain Medium Voltage Cable Market Revenue (Million) Forecast, by Application 2019 & 2032
- Table 132: Spain Medium Voltage Cable Market Volume (Meter) Forecast, by Application 2019 & 2032
- Table 133: NORDIC Medium Voltage Cable Market Revenue (Million) Forecast, by Application 2019 & 2032
- Table 134: NORDIC Medium Voltage Cable Market Volume (Meter) Forecast, by Application 2019 & 2032
- Table 135: Russia Medium Voltage Cable Market Revenue (Million) Forecast, by Application 2019 & 2032
- Table 136: Russia Medium Voltage Cable Market Volume (Meter) Forecast, by Application 2019 & 2032
- Table 137: Turkey Medium Voltage Cable Market Revenue (Million) Forecast, by Application 2019 & 2032
- Table 138: Turkey Medium Voltage Cable Market Volume (Meter) Forecast, by Application 2019 & 2032
- Table 139: Germany Medium Voltage Cable Market Revenue (Million) Forecast, by Application 2019 & 2032
- Table 140: Germany Medium Voltage Cable Market Volume (Meter) Forecast, by Application 2019 & 2032
- Table 141: Italy Medium Voltage Cable Market Revenue (Million) Forecast, by Application 2019 & 2032
- Table 142: Italy Medium Voltage Cable Market Volume (Meter) Forecast, by Application 2019 & 2032
- Table 143: Rest of Europe Medium Voltage Cable Market Revenue (Million) Forecast, by Application 2019 & 2032
- Table 144: Rest of Europe Medium Voltage Cable Market Volume (Meter) Forecast, by Application 2019 & 2032
- Table 145: Global Medium Voltage Cable Market Revenue Million Forecast, by Voltage Level 2019 & 2032
- Table 146: Global Medium Voltage Cable Market Volume Meter Forecast, by Voltage Level 2019 & 2032
- Table 147: Global Medium Voltage Cable Market Revenue Million Forecast, by Application 2019 & 2032
- Table 148: Global Medium Voltage Cable Market Volume Meter Forecast, by Application 2019 & 2032
- Table 149: Global Medium Voltage Cable Market Revenue Million Forecast, by Insulation 2019 & 2032
- Table 150: Global Medium Voltage Cable Market Volume Meter Forecast, by Insulation 2019 & 2032
- Table 151: Global Medium Voltage Cable Market Revenue Million Forecast, by Location of Deployment 2019 & 2032
- Table 152: Global Medium Voltage Cable Market Volume Meter Forecast, by Location of Deployment 2019 & 2032
- Table 153: Global Medium Voltage Cable Market Revenue Million Forecast, by Country 2019 & 2032
- Table 154: Global Medium Voltage Cable Market Volume Meter Forecast, by Country 2019 & 2032
- Table 155: China Medium Voltage Cable Market Revenue (Million) Forecast, by Application 2019 & 2032
- Table 156: China Medium Voltage Cable Market Volume (Meter) Forecast, by Application 2019 & 2032
- Table 157: India Medium Voltage Cable Market Revenue (Million) Forecast, by Application 2019 & 2032
- Table 158: India Medium Voltage Cable Market Volume (Meter) Forecast, by Application 2019 & 2032
- Table 159: Japan Medium Voltage Cable Market Revenue (Million) Forecast, by Application 2019 & 2032
- Table 160: Japan Medium Voltage Cable Market Volume (Meter) Forecast, by Application 2019 & 2032
- Table 161: Malaysia Medium Voltage Cable Market Revenue (Million) Forecast, by Application 2019 & 2032
- Table 162: Malaysia Medium Voltage Cable Market Volume (Meter) Forecast, by Application 2019 & 2032
- Table 163: Thailand Medium Voltage Cable Market Revenue (Million) Forecast, by Application 2019 & 2032
- Table 164: Thailand Medium Voltage Cable Market Volume (Meter) Forecast, by Application 2019 & 2032
- Table 165: Indonesia Medium Voltage Cable Market Revenue (Million) Forecast, by Application 2019 & 2032
- Table 166: Indonesia Medium Voltage Cable Market Volume (Meter) Forecast, by Application 2019 & 2032
- Table 167: Vietnam Medium Voltage Cable Market Revenue (Million) Forecast, by Application 2019 & 2032
- Table 168: Vietnam Medium Voltage Cable Market Volume (Meter) Forecast, by Application 2019 & 2032
- Table 169: Rest of Asia Pacific Medium Voltage Cable Market Revenue (Million) Forecast, by Application 2019 & 2032
- Table 170: Rest of Asia Pacific Medium Voltage Cable Market Volume (Meter) Forecast, by Application 2019 & 2032
- Table 171: Global Medium Voltage Cable Market Revenue Million Forecast, by Voltage Level 2019 & 2032
- Table 172: Global Medium Voltage Cable Market Volume Meter Forecast, by Voltage Level 2019 & 2032
- Table 173: Global Medium Voltage Cable Market Revenue Million Forecast, by Application 2019 & 2032
- Table 174: Global Medium Voltage Cable Market Volume Meter Forecast, by Application 2019 & 2032
- Table 175: Global Medium Voltage Cable Market Revenue Million Forecast, by Insulation 2019 & 2032
- Table 176: Global Medium Voltage Cable Market Volume Meter Forecast, by Insulation 2019 & 2032
- Table 177: Global Medium Voltage Cable Market Revenue Million Forecast, by Location of Deployment 2019 & 2032
- Table 178: Global Medium Voltage Cable Market Volume Meter Forecast, by Location of Deployment 2019 & 2032
- Table 179: Global Medium Voltage Cable Market Revenue Million Forecast, by Country 2019 & 2032
- Table 180: Global Medium Voltage Cable Market Volume Meter Forecast, by Country 2019 & 2032
- Table 181: Brazil Medium Voltage Cable Market Revenue (Million) Forecast, by Application 2019 & 2032
- Table 182: Brazil Medium Voltage Cable Market Volume (Meter) Forecast, by Application 2019 & 2032
- Table 183: Argentina Medium Voltage Cable Market Revenue (Million) Forecast, by Application 2019 & 2032
- Table 184: Argentina Medium Voltage Cable Market Volume (Meter) Forecast, by Application 2019 & 2032
- Table 185: Colombia Medium Voltage Cable Market Revenue (Million) Forecast, by Application 2019 & 2032
- Table 186: Colombia Medium Voltage Cable Market Volume (Meter) Forecast, by Application 2019 & 2032
- Table 187: Rest of South America Medium Voltage Cable Market Revenue (Million) Forecast, by Application 2019 & 2032
- Table 188: Rest of South America Medium Voltage Cable Market Volume (Meter) Forecast, by Application 2019 & 2032
- Table 189: Global Medium Voltage Cable Market Revenue Million Forecast, by Voltage Level 2019 & 2032
- Table 190: Global Medium Voltage Cable Market Volume Meter Forecast, by Voltage Level 2019 & 2032
- Table 191: Global Medium Voltage Cable Market Revenue Million Forecast, by Application 2019 & 2032
- Table 192: Global Medium Voltage Cable Market Volume Meter Forecast, by Application 2019 & 2032
- Table 193: Global Medium Voltage Cable Market Revenue Million Forecast, by Insulation 2019 & 2032
- Table 194: Global Medium Voltage Cable Market Volume Meter Forecast, by Insulation 2019 & 2032
- Table 195: Global Medium Voltage Cable Market Revenue Million Forecast, by Location of Deployment 2019 & 2032
- Table 196: Global Medium Voltage Cable Market Volume Meter Forecast, by Location of Deployment 2019 & 2032
- Table 197: Global Medium Voltage Cable Market Revenue Million Forecast, by Country 2019 & 2032
- Table 198: Global Medium Voltage Cable Market Volume Meter Forecast, by Country 2019 & 2032
- Table 199: United Arab Emirates Medium Voltage Cable Market Revenue (Million) Forecast, by Application 2019 & 2032
- Table 200: United Arab Emirates Medium Voltage Cable Market Volume (Meter) Forecast, by Application 2019 & 2032
- Table 201: Saudi Arabia Medium Voltage Cable Market Revenue (Million) Forecast, by Application 2019 & 2032
- Table 202: Saudi Arabia Medium Voltage Cable Market Volume (Meter) Forecast, by Application 2019 & 2032
- Table 203: South Africa Medium Voltage Cable Market Revenue (Million) Forecast, by Application 2019 & 2032
- Table 204: South Africa Medium Voltage Cable Market Volume (Meter) Forecast, by Application 2019 & 2032
- Table 205: Nigeria Medium Voltage Cable Market Revenue (Million) Forecast, by Application 2019 & 2032
- Table 206: Nigeria Medium Voltage Cable Market Volume (Meter) Forecast, by Application 2019 & 2032
- Table 207: Qatar Medium Voltage Cable Market Revenue (Million) Forecast, by Application 2019 & 2032
- Table 208: Qatar Medium Voltage Cable Market Volume (Meter) Forecast, by Application 2019 & 2032
- Table 209: Egypt Medium Voltage Cable Market Revenue (Million) Forecast, by Application 2019 & 2032
- Table 210: Egypt Medium Voltage Cable Market Volume (Meter) Forecast, by Application 2019 & 2032
- Table 211: Rest of Middle East and Africa Medium Voltage Cable Market Revenue (Million) Forecast, by Application 2019 & 2032
- Table 212: Rest of Middle East and Africa Medium Voltage Cable Market Volume (Meter) Forecast, by Application 2019 & 2032
Frequently Asked Questions
1. What is the projected Compound Annual Growth Rate (CAGR) of the Medium Voltage Cable Market?
The projected CAGR is approximately 5.40%.
2. Which companies are prominent players in the Medium Voltage Cable Market?
Key companies in the market include Nexans SA, NKT AS, The Okonite Company, Prysmian SpA, Siemens AG, Southwire Company LLC, Riyadh Cables Group, Eland Cables Ltd, Cablel Hellenic Cables Group, General Cables Corporation*List Not Exhaustive 6 4 Market Ranking Analysi.
3. What are the main segments of the Medium Voltage Cable Market?
The market segments include Voltage Level, Application, Insulation, Location of Deployment.
4. Can you provide details about the market size?
The market size is estimated to be USD 48.71 Million as of 2022.
5. What are some drivers contributing to market growth?
4.; Increase in Electricity Propelled by Growing Industrialization and Urbanization4.; Aging Power Sector Infrastructure.
6. What are the notable trends driving market growth?
The Underground Segment to Witness Significant Growth.
7. Are there any restraints impacting market growth?
4.; Limited Investments to Support Medium-voltage Transmission Network.
8. Can you provide examples of recent developments in the market?
February 2023: Prysmian Group confirmed its support for upgrading the United Kingdom’s electricity grid. The company was awarded a medium-voltage cable framework agreement with National Grid Electricity Distribution for a minimum of 3 years.
9. What pricing options are available for accessing the report?
Pricing options include single-user, multi-user, and enterprise licenses priced at USD 4750, USD 5250, and USD 8750 respectively.
10. Is the market size provided in terms of value or volume?
The market size is provided in terms of value, measured in Million and volume, measured in Meter.
11. Are there any specific market keywords associated with the report?
Yes, the market keyword associated with the report is "Medium Voltage Cable Market," which aids in identifying and referencing the specific market segment covered.
12. How do I determine which pricing option suits my needs best?
The pricing options vary based on user requirements and access needs. Individual users may opt for single-user licenses, while businesses requiring broader access may choose multi-user or enterprise licenses for cost-effective access to the report.
13. Are there any additional resources or data provided in the Medium Voltage Cable Market report?
While the report offers comprehensive insights, it's advisable to review the specific contents or supplementary materials provided to ascertain if additional resources or data are available.
14. How can I stay updated on further developments or reports in the Medium Voltage Cable Market?
To stay informed about further developments, trends, and reports in the Medium Voltage Cable Market, consider subscribing to industry newsletters, following relevant companies and organizations, or regularly checking reputable industry news sources and publications.
Methodology
Step 1 - Identification of Relevant Samples Size from Population Database


Step 2 - Approaches for Defining Global Market Size (Value, Volume* & Price*)

Note*: In applicable scenarios
Step 3 - Data Sources
Primary Research
- Web Analytics
- Survey Reports
- Research Institute
- Latest Research Reports
- Opinion Leaders
Secondary Research
- Annual Reports
- White Paper
- Latest Press Release
- Industry Association
- Paid Database
- Investor Presentations

Step 4 - Data Triangulation
Involves using different sources of information in order to increase the validity of a study
These sources are likely to be stakeholders in a program - participants, other researchers, program staff, other community members, and so on.
Then we put all data in single framework & apply various statistical tools to find out the dynamic on the market.
During the analysis stage, feedback from the stakeholder groups would be compared to determine areas of agreement as well as areas of divergence


