
Key Insights
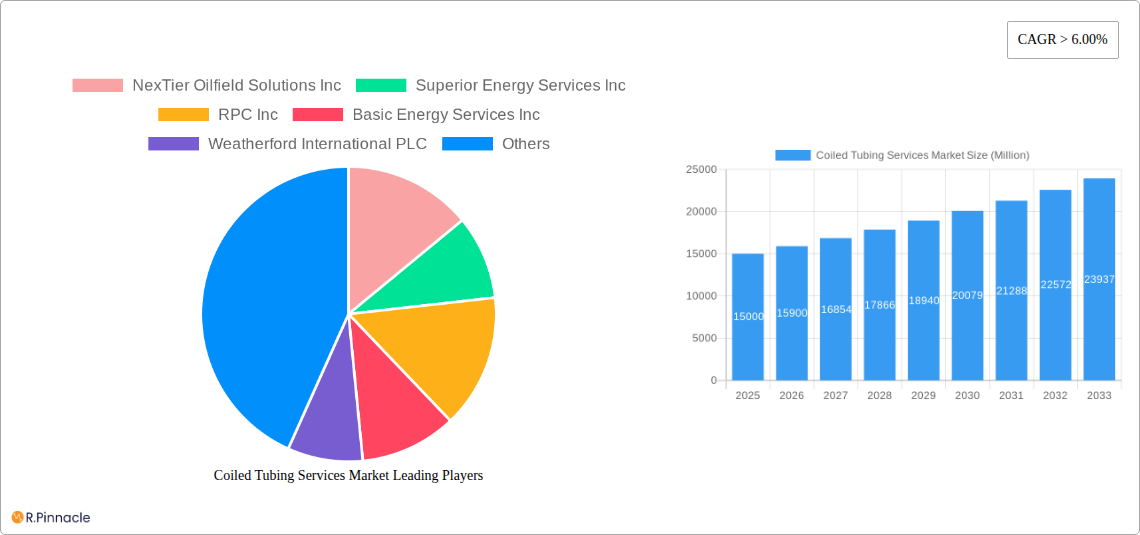
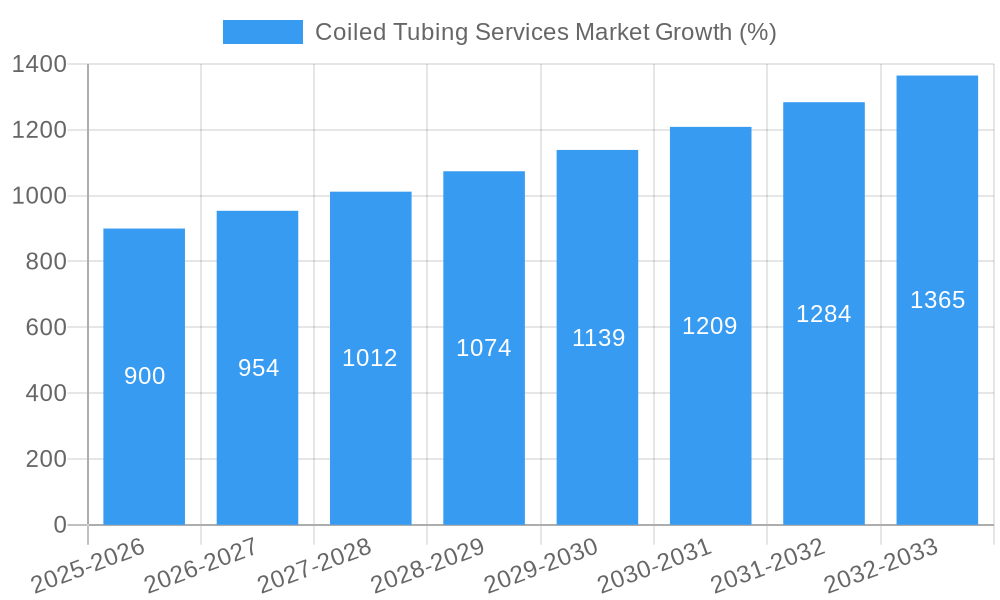
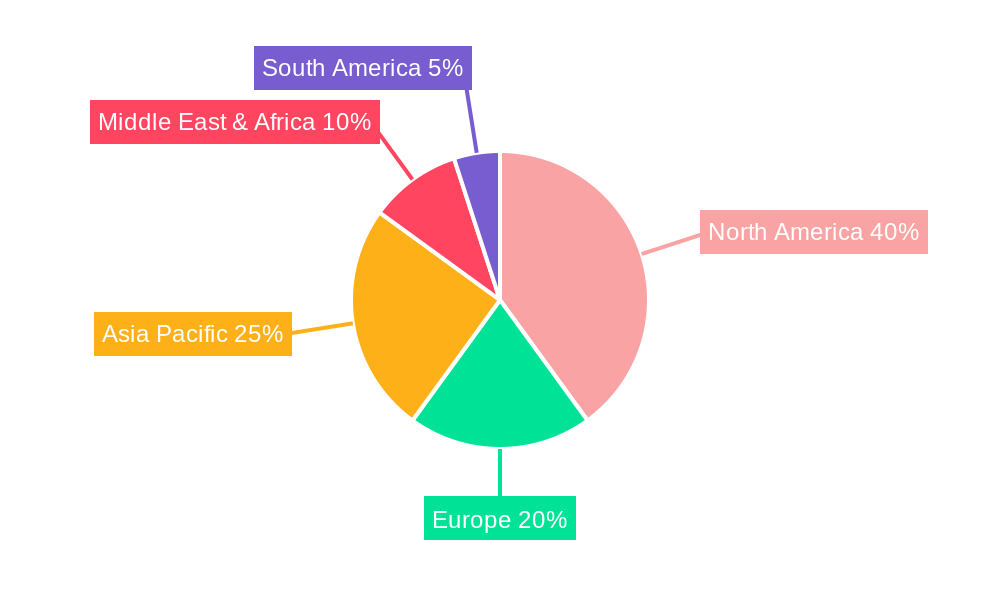
The global coiled tubing services market is experiencing robust growth, driven by increasing oil and gas exploration and production activities worldwide. A compound annual growth rate (CAGR) exceeding 6% indicates a significant expansion projected through 2033. This growth is fueled by several factors. The ongoing demand for enhanced oil recovery (EOR) techniques, particularly in mature oil fields, necessitates the use of coiled tubing for efficient and cost-effective well intervention. Furthermore, the increasing adoption of horizontal drilling and hydraulic fracturing, prevalent in shale gas formations, significantly boosts the market. Technological advancements in coiled tubing units (CTUs), including improved pressure ratings and automation capabilities, are enhancing operational efficiency and safety, further contributing to market expansion. While geographical variations exist, North America, particularly the United States, and regions with significant oil and gas reserves like the Middle East and Asia-Pacific, represent key growth areas. However, market growth is also influenced by factors like fluctuating oil prices and stringent environmental regulations. The market is segmented by application (drilling, completion, well intervention) and location of deployment (onshore, offshore), reflecting diverse operational needs and market dynamics within each segment. Key players such as NexTier Oilfield Solutions, Halliburton, and Schlumberger are actively involved in technological advancements and market consolidation, shaping the competitive landscape. The market's future depends on sustained oil and gas production, advancements in coiled tubing technology, and evolving regulatory frameworks.
The competitive landscape is characterized by both large multinational corporations and smaller specialized service providers. The market exhibits a degree of consolidation, with major players constantly striving to enhance their service offerings and geographical reach through acquisitions and technological innovation. Pricing strategies vary depending on factors such as service complexity, geographical location, and the prevailing market conditions. The onshore segment currently dominates, but the offshore segment is projected to witness significant growth, driven by increasing deepwater exploration and production activities. The well intervention application is witnessing strong demand due to the growing need for efficient and cost-effective well maintenance and repair. Future market growth hinges on several factors, including sustained investments in oil and gas exploration and production, technological advancements within the coiled tubing industry, and favorable regulatory environments.
Coiled Tubing Services Market Report: Comprehensive Analysis & Forecast 2019-2033
This comprehensive report provides a detailed analysis of the Coiled Tubing Services market, offering invaluable insights for industry professionals, investors, and stakeholders. Covering the period from 2019 to 2033, with a base year of 2025 and a forecast period of 2025-2033, this report unveils the market's structure, dynamics, and future trajectory. The report meticulously examines key segments, including application (Drilling, Completion, Well Intervention) and location (Onshore, Offshore), highlighting dominant regions and leading players such as NexTier Oilfield Solutions Inc, Superior Energy Services Inc, RPC Inc, Basic Energy Services Inc, Weatherford International PLC, Trican Well Service Ltd, Baker Hughes Company, Halliburton Company, Schlumberger Limited, and Calfrac Well Services Ltd. The report also analyzes crucial market developments and provides actionable strategic recommendations.
Coiled Tubing Services Market Structure & Innovation Trends
The Coiled Tubing Services market exhibits a moderately concentrated structure, with a few major players holding significant market share. The precise market share distribution varies across geographical regions and specific service offerings, but the top 10 companies likely account for approximately xx% of the global market in 2025. Innovation is driven by increasing demand for enhanced efficiency, reduced operational costs, and improved well intervention techniques. This is leading to the development of advanced coiled tubing units (CTUs) with higher pressure ratings, improved control systems, and specialized downhole tools. Regulatory frameworks, particularly concerning safety and environmental compliance, play a crucial role in shaping market dynamics. Substitutes such as wireline services offer some competition, but coiled tubing’s advantages in certain applications maintain its market position. End-user demographics are heavily influenced by the oil and gas exploration and production activities in various regions.
M&A activities have been relatively frequent in recent years, with deal values ranging from xx Million to xx Million. These acquisitions often aim to expand geographic reach, enhance technological capabilities, or consolidate market share. For example, the acquisition of Company X by Company Y in 2022 resulted in a significant increase in market share for Company Y, impacting the competitive landscape.
- Market Concentration: Moderately concentrated, top 10 players holding approximately xx% of global market share (2025).
- Innovation Drivers: Enhanced efficiency, reduced costs, improved well intervention techniques.
- Regulatory Frameworks: Significant influence on safety and environmental compliance.
- M&A Activity: Frequent, with deal values ranging from xx Million to xx Million.
Coiled Tubing Services Market Dynamics & Trends
The Coiled Tubing Services market is experiencing significant growth, driven primarily by the increasing demand for oil and gas globally. The rising complexity of well designs, coupled with the need for efficient well intervention strategies, is fueling the adoption of coiled tubing technology. Technological advancements, such as the development of intelligent CTUs with real-time data acquisition and analysis capabilities, are further propelling market growth. Consumer preferences are shifting towards more reliable and efficient services that minimize downtime and improve operational safety. The competitive landscape is characterized by intense competition among established players and emerging service providers.
The market is witnessing a shift towards integrated service offerings, where coiled tubing services are bundled with other well intervention and completion services. This trend is aimed at optimizing operational efficiency and reducing costs for oil and gas operators. The global market is projected to grow at a Compound Annual Growth Rate (CAGR) of xx% from 2025 to 2033, with market penetration rates varying significantly across different regions.
Dominant Regions & Segments in Coiled Tubing Services Market
The North American region, particularly the United States, currently holds the largest market share in the Coiled Tubing Services market. This dominance is attributable to robust oil and gas production activities, a well-established infrastructure, and the presence of several major service providers. However, the Middle East and Asia-Pacific regions are experiencing rapid growth, driven by significant investments in oil and gas exploration and production.
Key Drivers for North American Dominance:
- Robust oil and gas production activities.
- Well-established infrastructure and skilled workforce.
- Presence of several major service providers.
Key Drivers for Growth in Middle East and Asia-Pacific:
- Significant investments in oil and gas exploration and production.
- Expanding energy demand.
- Growing focus on enhanced oil recovery (EOR) techniques.
Regarding application segments, Well Intervention currently holds the largest market share. This reflects the growing need for efficient and cost-effective solutions for well maintenance, repair, and stimulation activities. The Onshore segment dominates the location of deployment, driven by the vast majority of oil and gas wells being located onshore. However, offshore deployment is experiencing growth driven by increased activity in offshore oil and gas fields.
Coiled Tubing Services Market Product Innovations
Recent product innovations focus on enhancing the efficiency, safety, and versatility of coiled tubing systems. This includes the development of advanced control systems, high-pressure CTUs, and specialized downhole tools for specific applications, such as perforation, milling, and cementing. The integration of advanced technologies like robotics and artificial intelligence (AI) is also gaining traction, enhancing operational efficiency and reducing the risk of human error. These innovations are improving the overall market fit by addressing the growing demand for more efficient, safer, and cost-effective well intervention solutions.
Report Scope & Segmentation Analysis
This report comprehensively segments the Coiled Tubing Services market based on application (Drilling, Completion, Well Intervention) and location of deployment (Onshore, Offshore). Each segment is analyzed based on market size, growth projections, and competitive dynamics. Detailed analysis of these segments reveals significant growth potential across each category, with market sizes varying considerably. Competitive dynamics vary by segment, with certain players specializing in particular applications or deployment locations.
Application Segments:
- Drilling: The drilling segment showcases growth potential linked to increased drilling activities.
- Completion: The completion segment is expanding as operators require sophisticated completion strategies.
- Well Intervention: The well intervention segment remains the dominant market segment.
Location Segments:
- Onshore: The onshore segment maintains the largest market share.
- Offshore: The offshore segment is experiencing growth, albeit from a smaller base.
Key Drivers of Coiled Tubing Services Market Growth
The Coiled Tubing Services market is propelled by several key factors: increasing global demand for oil and gas, the growing complexity of well designs, and the need for enhanced well intervention techniques. Technological advancements, such as the development of intelligent CTUs and specialized downhole tools, are further boosting market growth. Favorable regulatory frameworks in certain regions support the adoption of coiled tubing technology. Finally, the drive for operational efficiency and cost reduction within the oil and gas industry fuels the demand for innovative and reliable coiled tubing services.
Challenges in the Coiled Tubing Services Market Sector
The Coiled Tubing Services market faces several challenges. Fluctuations in oil and gas prices impact demand and investment decisions. Supply chain disruptions can affect the availability of crucial components and equipment. Stringent safety and environmental regulations can increase operational costs and complexity. Intense competition among service providers necessitates continuous innovation and cost optimization. These factors, while not insurmountable, impose constraints on market growth and profitability.
Emerging Opportunities in Coiled Tubing Services Market
Emerging opportunities exist in expanding into new markets with growing oil and gas exploration activities. The adoption of advanced technologies like AI and automation presents significant potential for improved efficiency and reduced operational costs. A focus on sustainable and environmentally friendly practices is creating opportunities for specialized coiled tubing services tailored to reduce environmental impact. Growing demand for enhanced oil recovery (EOR) techniques also presents further opportunities for market expansion.
Leading Players in the Coiled Tubing Services Market Market
- NexTier Oilfield Solutions Inc
- Superior Energy Services Inc
- RPC Inc
- Basic Energy Services Inc
- Weatherford International PLC
- Trican Well Service Ltd
- Baker Hughes Company
- Halliburton Company
- Schlumberger Limited
- Calfrac Well Services Ltd
Key Developments in Coiled Tubing Services Market Industry
- July 2021: ADNOC's USD 763.7 Million investment in integrated rigless services, including coiled tubing, across six artificial islands in the Upper Zakum and Satah Al Razboot (SARB) fields, signifies a substantial market expansion.
Future Outlook for Coiled Tubing Services Market Market
The Coiled Tubing Services market is poised for sustained growth, driven by increasing global energy demand, technological advancements, and the expansion of oil and gas exploration activities. Strategic opportunities exist in developing innovative solutions, expanding into new geographical markets, and focusing on enhanced efficiency and sustainability. The market's future trajectory appears positive, with significant potential for growth and profitability.
Coiled Tubing Services Market Segmentation
-
1. Application
- 1.1. Drilling
- 1.2. Completion
- 1.3. Well Intervention
-
2. Location of Deployment
- 2.1. Onshore
- 2.2. Offshore
Coiled Tubing Services Market Segmentation By Geography
- 1. North America
- 2. Europe
- 3. Asia Pacific
- 4. South America
- 5. Middle East and Africa
Coiled Tubing Services Market REPORT HIGHLIGHTS
| Aspects | Details |
|---|---|
| Study Period | 2019-2033 |
| Base Year | 2024 |
| Estimated Year | 2025 |
| Forecast Period | 2025-2033 |
| Historical Period | 2019-2024 |
| Growth Rate | CAGR of > 6.00% from 2019-2033 |
| Segmentation |
|
Table of Contents
- 1. Introduction
- 1.1. Research Scope
- 1.2. Market Segmentation
- 1.3. Research Methodology
- 1.4. Definitions and Assumptions
- 2. Executive Summary
- 2.1. Introduction
- 3. Market Dynamics
- 3.1. Introduction
- 3.2. Market Drivers
- 3.2.1. 4.; Growing demand for natural gas and developing gas infrastructure4.; Increasing offshore oil and Gas Exploration Activities
- 3.3. Market Restrains
- 3.3.1. 4.; Adoption of Cleaner Alternatives
- 3.4. Market Trends
- 3.4.1. Well Intervention Application Segment to Dominate the Market
- 4. Market Factor Analysis
- 4.1. Porters Five Forces
- 4.2. Supply/Value Chain
- 4.3. PESTEL analysis
- 4.4. Market Entropy
- 4.5. Patent/Trademark Analysis
- 5. Global Coiled Tubing Services Market Analysis, Insights and Forecast, 2019-2031
- 5.1. Market Analysis, Insights and Forecast - by Application
- 5.1.1. Drilling
- 5.1.2. Completion
- 5.1.3. Well Intervention
- 5.2. Market Analysis, Insights and Forecast - by Location of Deployment
- 5.2.1. Onshore
- 5.2.2. Offshore
- 5.3. Market Analysis, Insights and Forecast - by Region
- 5.3.1. North America
- 5.3.2. Europe
- 5.3.3. Asia Pacific
- 5.3.4. South America
- 5.3.5. Middle East and Africa
- 5.1. Market Analysis, Insights and Forecast - by Application
- 6. North America Coiled Tubing Services Market Analysis, Insights and Forecast, 2019-2031
- 6.1. Market Analysis, Insights and Forecast - by Application
- 6.1.1. Drilling
- 6.1.2. Completion
- 6.1.3. Well Intervention
- 6.2. Market Analysis, Insights and Forecast - by Location of Deployment
- 6.2.1. Onshore
- 6.2.2. Offshore
- 6.1. Market Analysis, Insights and Forecast - by Application
- 7. Europe Coiled Tubing Services Market Analysis, Insights and Forecast, 2019-2031
- 7.1. Market Analysis, Insights and Forecast - by Application
- 7.1.1. Drilling
- 7.1.2. Completion
- 7.1.3. Well Intervention
- 7.2. Market Analysis, Insights and Forecast - by Location of Deployment
- 7.2.1. Onshore
- 7.2.2. Offshore
- 7.1. Market Analysis, Insights and Forecast - by Application
- 8. Asia Pacific Coiled Tubing Services Market Analysis, Insights and Forecast, 2019-2031
- 8.1. Market Analysis, Insights and Forecast - by Application
- 8.1.1. Drilling
- 8.1.2. Completion
- 8.1.3. Well Intervention
- 8.2. Market Analysis, Insights and Forecast - by Location of Deployment
- 8.2.1. Onshore
- 8.2.2. Offshore
- 8.1. Market Analysis, Insights and Forecast - by Application
- 9. South America Coiled Tubing Services Market Analysis, Insights and Forecast, 2019-2031
- 9.1. Market Analysis, Insights and Forecast - by Application
- 9.1.1. Drilling
- 9.1.2. Completion
- 9.1.3. Well Intervention
- 9.2. Market Analysis, Insights and Forecast - by Location of Deployment
- 9.2.1. Onshore
- 9.2.2. Offshore
- 9.1. Market Analysis, Insights and Forecast - by Application
- 10. Middle East and Africa Coiled Tubing Services Market Analysis, Insights and Forecast, 2019-2031
- 10.1. Market Analysis, Insights and Forecast - by Application
- 10.1.1. Drilling
- 10.1.2. Completion
- 10.1.3. Well Intervention
- 10.2. Market Analysis, Insights and Forecast - by Location of Deployment
- 10.2.1. Onshore
- 10.2.2. Offshore
- 10.1. Market Analysis, Insights and Forecast - by Application
- 11. North America Coiled Tubing Services Market Analysis, Insights and Forecast, 2019-2031
- 11.1. Market Analysis, Insights and Forecast - By Country/Sub-region
- 11.1.1 United States
- 11.1.2 Canada
- 11.1.3 Mexico
- 12. Europe Coiled Tubing Services Market Analysis, Insights and Forecast, 2019-2031
- 12.1. Market Analysis, Insights and Forecast - By Country/Sub-region
- 12.1.1 Germany
- 12.1.2 United Kingdom
- 12.1.3 France
- 12.1.4 Spain
- 12.1.5 Italy
- 12.1.6 Spain
- 12.1.7 Belgium
- 12.1.8 Netherland
- 12.1.9 Nordics
- 12.1.10 Rest of Europe
- 13. Asia Pacific Coiled Tubing Services Market Analysis, Insights and Forecast, 2019-2031
- 13.1. Market Analysis, Insights and Forecast - By Country/Sub-region
- 13.1.1 China
- 13.1.2 Japan
- 13.1.3 India
- 13.1.4 South Korea
- 13.1.5 Southeast Asia
- 13.1.6 Australia
- 13.1.7 Indonesia
- 13.1.8 Phillipes
- 13.1.9 Singapore
- 13.1.10 Thailandc
- 13.1.11 Rest of Asia Pacific
- 14. South America Coiled Tubing Services Market Analysis, Insights and Forecast, 2019-2031
- 14.1. Market Analysis, Insights and Forecast - By Country/Sub-region
- 14.1.1 Brazil
- 14.1.2 Argentina
- 14.1.3 Peru
- 14.1.4 Chile
- 14.1.5 Colombia
- 14.1.6 Ecuador
- 14.1.7 Venezuela
- 14.1.8 Rest of South America
- 15. North America Coiled Tubing Services Market Analysis, Insights and Forecast, 2019-2031
- 15.1. Market Analysis, Insights and Forecast - By Country/Sub-region
- 15.1.1 United States
- 15.1.2 Canada
- 15.1.3 Mexico
- 16. MEA Coiled Tubing Services Market Analysis, Insights and Forecast, 2019-2031
- 16.1. Market Analysis, Insights and Forecast - By Country/Sub-region
- 16.1.1 United Arab Emirates
- 16.1.2 Saudi Arabia
- 16.1.3 South Africa
- 16.1.4 Rest of Middle East and Africa
- 17. Competitive Analysis
- 17.1. Global Market Share Analysis 2024
- 17.2. Company Profiles
- 17.2.1 NexTier Oilfield Solutions Inc
- 17.2.1.1. Overview
- 17.2.1.2. Products
- 17.2.1.3. SWOT Analysis
- 17.2.1.4. Recent Developments
- 17.2.1.5. Financials (Based on Availability)
- 17.2.2 Superior Energy Services Inc
- 17.2.2.1. Overview
- 17.2.2.2. Products
- 17.2.2.3. SWOT Analysis
- 17.2.2.4. Recent Developments
- 17.2.2.5. Financials (Based on Availability)
- 17.2.3 RPC Inc
- 17.2.3.1. Overview
- 17.2.3.2. Products
- 17.2.3.3. SWOT Analysis
- 17.2.3.4. Recent Developments
- 17.2.3.5. Financials (Based on Availability)
- 17.2.4 Basic Energy Services Inc
- 17.2.4.1. Overview
- 17.2.4.2. Products
- 17.2.4.3. SWOT Analysis
- 17.2.4.4. Recent Developments
- 17.2.4.5. Financials (Based on Availability)
- 17.2.5 Weatherford International PLC
- 17.2.5.1. Overview
- 17.2.5.2. Products
- 17.2.5.3. SWOT Analysis
- 17.2.5.4. Recent Developments
- 17.2.5.5. Financials (Based on Availability)
- 17.2.6 Trican Well Service Ltd*List Not Exhaustive
- 17.2.6.1. Overview
- 17.2.6.2. Products
- 17.2.6.3. SWOT Analysis
- 17.2.6.4. Recent Developments
- 17.2.6.5. Financials (Based on Availability)
- 17.2.7 Baker Hughes Company
- 17.2.7.1. Overview
- 17.2.7.2. Products
- 17.2.7.3. SWOT Analysis
- 17.2.7.4. Recent Developments
- 17.2.7.5. Financials (Based on Availability)
- 17.2.8 Halliburton Company
- 17.2.8.1. Overview
- 17.2.8.2. Products
- 17.2.8.3. SWOT Analysis
- 17.2.8.4. Recent Developments
- 17.2.8.5. Financials (Based on Availability)
- 17.2.9 Schlumberger Limited
- 17.2.9.1. Overview
- 17.2.9.2. Products
- 17.2.9.3. SWOT Analysis
- 17.2.9.4. Recent Developments
- 17.2.9.5. Financials (Based on Availability)
- 17.2.10 Calfrac Well Services Ltd
- 17.2.10.1. Overview
- 17.2.10.2. Products
- 17.2.10.3. SWOT Analysis
- 17.2.10.4. Recent Developments
- 17.2.10.5. Financials (Based on Availability)
- 17.2.1 NexTier Oilfield Solutions Inc
List of Figures
- Figure 1: Global Coiled Tubing Services Market Revenue Breakdown (Million, %) by Region 2024 & 2032
- Figure 2: North America Coiled Tubing Services Market Revenue (Million), by Country 2024 & 2032
- Figure 3: North America Coiled Tubing Services Market Revenue Share (%), by Country 2024 & 2032
- Figure 4: Europe Coiled Tubing Services Market Revenue (Million), by Country 2024 & 2032
- Figure 5: Europe Coiled Tubing Services Market Revenue Share (%), by Country 2024 & 2032
- Figure 6: Asia Pacific Coiled Tubing Services Market Revenue (Million), by Country 2024 & 2032
- Figure 7: Asia Pacific Coiled Tubing Services Market Revenue Share (%), by Country 2024 & 2032
- Figure 8: South America Coiled Tubing Services Market Revenue (Million), by Country 2024 & 2032
- Figure 9: South America Coiled Tubing Services Market Revenue Share (%), by Country 2024 & 2032
- Figure 10: North America Coiled Tubing Services Market Revenue (Million), by Country 2024 & 2032
- Figure 11: North America Coiled Tubing Services Market Revenue Share (%), by Country 2024 & 2032
- Figure 12: MEA Coiled Tubing Services Market Revenue (Million), by Country 2024 & 2032
- Figure 13: MEA Coiled Tubing Services Market Revenue Share (%), by Country 2024 & 2032
- Figure 14: North America Coiled Tubing Services Market Revenue (Million), by Application 2024 & 2032
- Figure 15: North America Coiled Tubing Services Market Revenue Share (%), by Application 2024 & 2032
- Figure 16: North America Coiled Tubing Services Market Revenue (Million), by Location of Deployment 2024 & 2032
- Figure 17: North America Coiled Tubing Services Market Revenue Share (%), by Location of Deployment 2024 & 2032
- Figure 18: North America Coiled Tubing Services Market Revenue (Million), by Country 2024 & 2032
- Figure 19: North America Coiled Tubing Services Market Revenue Share (%), by Country 2024 & 2032
- Figure 20: Europe Coiled Tubing Services Market Revenue (Million), by Application 2024 & 2032
- Figure 21: Europe Coiled Tubing Services Market Revenue Share (%), by Application 2024 & 2032
- Figure 22: Europe Coiled Tubing Services Market Revenue (Million), by Location of Deployment 2024 & 2032
- Figure 23: Europe Coiled Tubing Services Market Revenue Share (%), by Location of Deployment 2024 & 2032
- Figure 24: Europe Coiled Tubing Services Market Revenue (Million), by Country 2024 & 2032
- Figure 25: Europe Coiled Tubing Services Market Revenue Share (%), by Country 2024 & 2032
- Figure 26: Asia Pacific Coiled Tubing Services Market Revenue (Million), by Application 2024 & 2032
- Figure 27: Asia Pacific Coiled Tubing Services Market Revenue Share (%), by Application 2024 & 2032
- Figure 28: Asia Pacific Coiled Tubing Services Market Revenue (Million), by Location of Deployment 2024 & 2032
- Figure 29: Asia Pacific Coiled Tubing Services Market Revenue Share (%), by Location of Deployment 2024 & 2032
- Figure 30: Asia Pacific Coiled Tubing Services Market Revenue (Million), by Country 2024 & 2032
- Figure 31: Asia Pacific Coiled Tubing Services Market Revenue Share (%), by Country 2024 & 2032
- Figure 32: South America Coiled Tubing Services Market Revenue (Million), by Application 2024 & 2032
- Figure 33: South America Coiled Tubing Services Market Revenue Share (%), by Application 2024 & 2032
- Figure 34: South America Coiled Tubing Services Market Revenue (Million), by Location of Deployment 2024 & 2032
- Figure 35: South America Coiled Tubing Services Market Revenue Share (%), by Location of Deployment 2024 & 2032
- Figure 36: South America Coiled Tubing Services Market Revenue (Million), by Country 2024 & 2032
- Figure 37: South America Coiled Tubing Services Market Revenue Share (%), by Country 2024 & 2032
- Figure 38: Middle East and Africa Coiled Tubing Services Market Revenue (Million), by Application 2024 & 2032
- Figure 39: Middle East and Africa Coiled Tubing Services Market Revenue Share (%), by Application 2024 & 2032
- Figure 40: Middle East and Africa Coiled Tubing Services Market Revenue (Million), by Location of Deployment 2024 & 2032
- Figure 41: Middle East and Africa Coiled Tubing Services Market Revenue Share (%), by Location of Deployment 2024 & 2032
- Figure 42: Middle East and Africa Coiled Tubing Services Market Revenue (Million), by Country 2024 & 2032
- Figure 43: Middle East and Africa Coiled Tubing Services Market Revenue Share (%), by Country 2024 & 2032
List of Tables
- Table 1: Global Coiled Tubing Services Market Revenue Million Forecast, by Region 2019 & 2032
- Table 2: Global Coiled Tubing Services Market Revenue Million Forecast, by Application 2019 & 2032
- Table 3: Global Coiled Tubing Services Market Revenue Million Forecast, by Location of Deployment 2019 & 2032
- Table 4: Global Coiled Tubing Services Market Revenue Million Forecast, by Region 2019 & 2032
- Table 5: Global Coiled Tubing Services Market Revenue Million Forecast, by Country 2019 & 2032
- Table 6: United States Coiled Tubing Services Market Revenue (Million) Forecast, by Application 2019 & 2032
- Table 7: Canada Coiled Tubing Services Market Revenue (Million) Forecast, by Application 2019 & 2032
- Table 8: Mexico Coiled Tubing Services Market Revenue (Million) Forecast, by Application 2019 & 2032
- Table 9: Global Coiled Tubing Services Market Revenue Million Forecast, by Country 2019 & 2032
- Table 10: Germany Coiled Tubing Services Market Revenue (Million) Forecast, by Application 2019 & 2032
- Table 11: United Kingdom Coiled Tubing Services Market Revenue (Million) Forecast, by Application 2019 & 2032
- Table 12: France Coiled Tubing Services Market Revenue (Million) Forecast, by Application 2019 & 2032
- Table 13: Spain Coiled Tubing Services Market Revenue (Million) Forecast, by Application 2019 & 2032
- Table 14: Italy Coiled Tubing Services Market Revenue (Million) Forecast, by Application 2019 & 2032
- Table 15: Spain Coiled Tubing Services Market Revenue (Million) Forecast, by Application 2019 & 2032
- Table 16: Belgium Coiled Tubing Services Market Revenue (Million) Forecast, by Application 2019 & 2032
- Table 17: Netherland Coiled Tubing Services Market Revenue (Million) Forecast, by Application 2019 & 2032
- Table 18: Nordics Coiled Tubing Services Market Revenue (Million) Forecast, by Application 2019 & 2032
- Table 19: Rest of Europe Coiled Tubing Services Market Revenue (Million) Forecast, by Application 2019 & 2032
- Table 20: Global Coiled Tubing Services Market Revenue Million Forecast, by Country 2019 & 2032
- Table 21: China Coiled Tubing Services Market Revenue (Million) Forecast, by Application 2019 & 2032
- Table 22: Japan Coiled Tubing Services Market Revenue (Million) Forecast, by Application 2019 & 2032
- Table 23: India Coiled Tubing Services Market Revenue (Million) Forecast, by Application 2019 & 2032
- Table 24: South Korea Coiled Tubing Services Market Revenue (Million) Forecast, by Application 2019 & 2032
- Table 25: Southeast Asia Coiled Tubing Services Market Revenue (Million) Forecast, by Application 2019 & 2032
- Table 26: Australia Coiled Tubing Services Market Revenue (Million) Forecast, by Application 2019 & 2032
- Table 27: Indonesia Coiled Tubing Services Market Revenue (Million) Forecast, by Application 2019 & 2032
- Table 28: Phillipes Coiled Tubing Services Market Revenue (Million) Forecast, by Application 2019 & 2032
- Table 29: Singapore Coiled Tubing Services Market Revenue (Million) Forecast, by Application 2019 & 2032
- Table 30: Thailandc Coiled Tubing Services Market Revenue (Million) Forecast, by Application 2019 & 2032
- Table 31: Rest of Asia Pacific Coiled Tubing Services Market Revenue (Million) Forecast, by Application 2019 & 2032
- Table 32: Global Coiled Tubing Services Market Revenue Million Forecast, by Country 2019 & 2032
- Table 33: Brazil Coiled Tubing Services Market Revenue (Million) Forecast, by Application 2019 & 2032
- Table 34: Argentina Coiled Tubing Services Market Revenue (Million) Forecast, by Application 2019 & 2032
- Table 35: Peru Coiled Tubing Services Market Revenue (Million) Forecast, by Application 2019 & 2032
- Table 36: Chile Coiled Tubing Services Market Revenue (Million) Forecast, by Application 2019 & 2032
- Table 37: Colombia Coiled Tubing Services Market Revenue (Million) Forecast, by Application 2019 & 2032
- Table 38: Ecuador Coiled Tubing Services Market Revenue (Million) Forecast, by Application 2019 & 2032
- Table 39: Venezuela Coiled Tubing Services Market Revenue (Million) Forecast, by Application 2019 & 2032
- Table 40: Rest of South America Coiled Tubing Services Market Revenue (Million) Forecast, by Application 2019 & 2032
- Table 41: Global Coiled Tubing Services Market Revenue Million Forecast, by Country 2019 & 2032
- Table 42: United States Coiled Tubing Services Market Revenue (Million) Forecast, by Application 2019 & 2032
- Table 43: Canada Coiled Tubing Services Market Revenue (Million) Forecast, by Application 2019 & 2032
- Table 44: Mexico Coiled Tubing Services Market Revenue (Million) Forecast, by Application 2019 & 2032
- Table 45: Global Coiled Tubing Services Market Revenue Million Forecast, by Country 2019 & 2032
- Table 46: United Arab Emirates Coiled Tubing Services Market Revenue (Million) Forecast, by Application 2019 & 2032
- Table 47: Saudi Arabia Coiled Tubing Services Market Revenue (Million) Forecast, by Application 2019 & 2032
- Table 48: South Africa Coiled Tubing Services Market Revenue (Million) Forecast, by Application 2019 & 2032
- Table 49: Rest of Middle East and Africa Coiled Tubing Services Market Revenue (Million) Forecast, by Application 2019 & 2032
- Table 50: Global Coiled Tubing Services Market Revenue Million Forecast, by Application 2019 & 2032
- Table 51: Global Coiled Tubing Services Market Revenue Million Forecast, by Location of Deployment 2019 & 2032
- Table 52: Global Coiled Tubing Services Market Revenue Million Forecast, by Country 2019 & 2032
- Table 53: Global Coiled Tubing Services Market Revenue Million Forecast, by Application 2019 & 2032
- Table 54: Global Coiled Tubing Services Market Revenue Million Forecast, by Location of Deployment 2019 & 2032
- Table 55: Global Coiled Tubing Services Market Revenue Million Forecast, by Country 2019 & 2032
- Table 56: Global Coiled Tubing Services Market Revenue Million Forecast, by Application 2019 & 2032
- Table 57: Global Coiled Tubing Services Market Revenue Million Forecast, by Location of Deployment 2019 & 2032
- Table 58: Global Coiled Tubing Services Market Revenue Million Forecast, by Country 2019 & 2032
- Table 59: Global Coiled Tubing Services Market Revenue Million Forecast, by Application 2019 & 2032
- Table 60: Global Coiled Tubing Services Market Revenue Million Forecast, by Location of Deployment 2019 & 2032
- Table 61: Global Coiled Tubing Services Market Revenue Million Forecast, by Country 2019 & 2032
- Table 62: Global Coiled Tubing Services Market Revenue Million Forecast, by Application 2019 & 2032
- Table 63: Global Coiled Tubing Services Market Revenue Million Forecast, by Location of Deployment 2019 & 2032
- Table 64: Global Coiled Tubing Services Market Revenue Million Forecast, by Country 2019 & 2032
Frequently Asked Questions
1. What is the projected Compound Annual Growth Rate (CAGR) of the Coiled Tubing Services Market?
The projected CAGR is approximately > 6.00%.
2. Which companies are prominent players in the Coiled Tubing Services Market?
Key companies in the market include NexTier Oilfield Solutions Inc, Superior Energy Services Inc, RPC Inc, Basic Energy Services Inc, Weatherford International PLC, Trican Well Service Ltd*List Not Exhaustive, Baker Hughes Company, Halliburton Company, Schlumberger Limited, Calfrac Well Services Ltd.
3. What are the main segments of the Coiled Tubing Services Market?
The market segments include Application, Location of Deployment.
4. Can you provide details about the market size?
The market size is estimated to be USD XX Million as of 2022.
5. What are some drivers contributing to market growth?
4.; Growing demand for natural gas and developing gas infrastructure4.; Increasing offshore oil and Gas Exploration Activities.
6. What are the notable trends driving market growth?
Well Intervention Application Segment to Dominate the Market.
7. Are there any restraints impacting market growth?
4.; Adoption of Cleaner Alternatives.
8. Can you provide examples of recent developments in the market?
In July 2021, The Abu Dhabi National Oil Company (ADNOC) announced an investment of USD 763.7 million (AED 2.8 billion) in integrated rigless services across six of its artificial islands in the Upper Zakum and Satah Al Razboot (SARB) fields. The scope of the contracts includes coiled tubing services with thru-tubing downhole tools, stimulation services, including equipment and chemicals/fluid systems, surface well-testing services, wireline and production logging services and tools, saturation monitoring, and well integrity.
9. What pricing options are available for accessing the report?
Pricing options include single-user, multi-user, and enterprise licenses priced at USD 4750, USD 5250, and USD 8750 respectively.
10. Is the market size provided in terms of value or volume?
The market size is provided in terms of value, measured in Million.
11. Are there any specific market keywords associated with the report?
Yes, the market keyword associated with the report is "Coiled Tubing Services Market," which aids in identifying and referencing the specific market segment covered.
12. How do I determine which pricing option suits my needs best?
The pricing options vary based on user requirements and access needs. Individual users may opt for single-user licenses, while businesses requiring broader access may choose multi-user or enterprise licenses for cost-effective access to the report.
13. Are there any additional resources or data provided in the Coiled Tubing Services Market report?
While the report offers comprehensive insights, it's advisable to review the specific contents or supplementary materials provided to ascertain if additional resources or data are available.
14. How can I stay updated on further developments or reports in the Coiled Tubing Services Market?
To stay informed about further developments, trends, and reports in the Coiled Tubing Services Market, consider subscribing to industry newsletters, following relevant companies and organizations, or regularly checking reputable industry news sources and publications.
Methodology
Step 1 - Identification of Relevant Samples Size from Population Database


Step 2 - Approaches for Defining Global Market Size (Value, Volume* & Price*)

Note*: In applicable scenarios
Step 3 - Data Sources
Primary Research
- Web Analytics
- Survey Reports
- Research Institute
- Latest Research Reports
- Opinion Leaders
Secondary Research
- Annual Reports
- White Paper
- Latest Press Release
- Industry Association
- Paid Database
- Investor Presentations

Step 4 - Data Triangulation
Involves using different sources of information in order to increase the validity of a study
These sources are likely to be stakeholders in a program - participants, other researchers, program staff, other community members, and so on.
Then we put all data in single framework & apply various statistical tools to find out the dynamic on the market.
During the analysis stage, feedback from the stakeholder groups would be compared to determine areas of agreement as well as areas of divergence


