
Key Insights
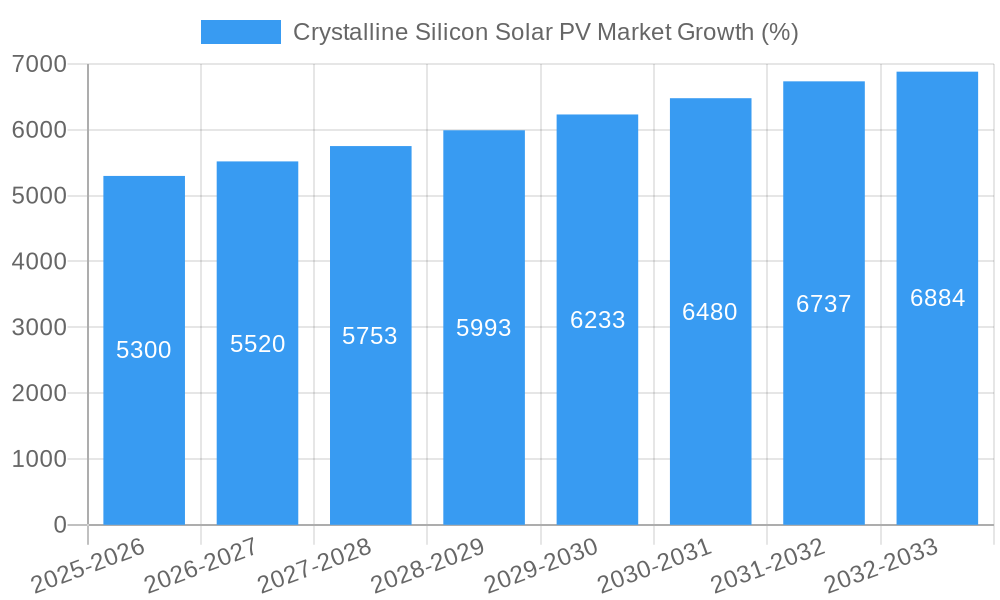
The Crystalline Silicon Solar PV market is experiencing robust growth, driven by increasing global demand for renewable energy sources and supportive government policies aimed at mitigating climate change. The market's 5.30% CAGR from 2019 to 2024 indicates a significant upward trajectory, projected to continue into the forecast period (2025-2033). Mono-crystalline silicon PV cells currently dominate the market due to their higher efficiency compared to poly-crystalline alternatives. However, poly-crystalline cells maintain a substantial market share due to their lower manufacturing costs, making them a competitive option for large-scale utility projects. The residential sector shows steady growth, fueled by decreasing installation costs and increasing consumer awareness of environmental benefits. The commercial sector is also expanding rapidly, driven by corporate sustainability initiatives and the potential for significant energy cost savings. Key geographic regions like North America, Europe, and Asia-Pacific are leading the market expansion, with China currently holding a dominant position due to its massive manufacturing capacity and robust domestic demand. However, other regions are witnessing increasing adoption rates, spurred by government incentives and growing environmental concerns. Market restraints include the intermittent nature of solar power, requiring robust energy storage solutions, and the reliance on raw materials like silicon, which can be subject to price volatility. Nonetheless, technological advancements in solar cell efficiency and manufacturing processes are mitigating these challenges and further propelling market growth.
The competitive landscape is characterized by established players such as JinkoSolar, JA Solar, Canadian Solar, and Trina Solar, alongside other significant international manufacturers. These companies are constantly innovating to improve product efficiency, reduce costs, and expand their market reach. The future of the Crystalline Silicon Solar PV market hinges on continued technological advancements, policy support, and the successful integration of solar energy into broader energy grids. Strategic partnerships, mergers and acquisitions, and the development of innovative financing models will play crucial roles in shaping the market's evolution during the forecast period. The decreasing cost of solar energy, coupled with increasing energy demands and growing concerns about climate change, positions the Crystalline Silicon Solar PV market for sustained and substantial growth in the coming decade. We project a continued expansion of the market, driven by consistent technological progress and a global shift towards renewable energy sources.
Crystalline Silicon Solar PV Market Report: 2019-2033 Forecast
This comprehensive report provides an in-depth analysis of the Crystalline Silicon Solar PV market, offering invaluable insights for industry professionals, investors, and strategic decision-makers. Covering the period from 2019 to 2033, with a focus on 2025, this report meticulously examines market dynamics, technological advancements, and competitive landscapes to provide a clear picture of future growth potential. The report leverages extensive data analysis and industry expertise to deliver actionable recommendations and forecasts.
Crystalline Silicon Solar PV Market Structure & Innovation Trends
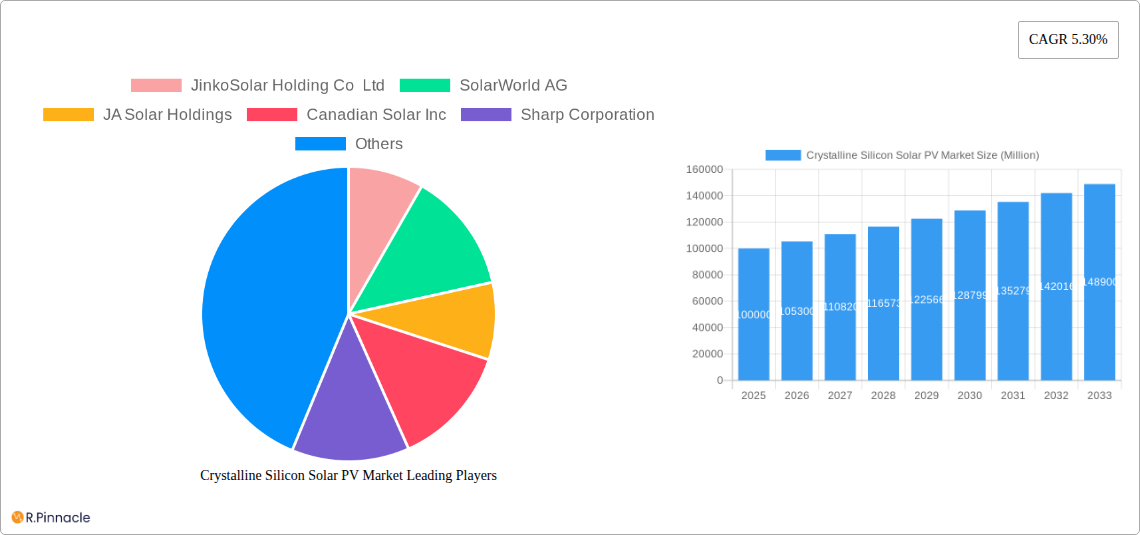
This section analyzes the Crystalline Silicon Solar PV market's structure, examining market concentration, key innovation drivers, regulatory landscapes, product substitutes, end-user demographics, and significant M&A activities. The report assesses the market share of leading players like JinkoSolar Holding Co Ltd, SolarWorld AG, JA Solar Holdings, Canadian Solar Inc, Sharp Corporation, Hanwha Q CELLS Co Ltd, and Trina Solar Limited. The analysis incorporates an evaluation of the value and impact of recent mergers and acquisitions, providing a comprehensive overview of the market's competitive dynamics. For example, the xx% market share held by JinkoSolar in 2024 is projected to grow to xx% by 2033, driven by its aggressive expansion strategy and technological advancements. The report also details the impact of regulatory frameworks like carbon emission reduction targets in various countries which influences market growth and investments. The total value of M&A deals in the Crystalline Silicon Solar PV market during the historical period (2019-2024) was estimated at $xx Million. Future M&A activity is predicted to focus on strengthening supply chains and technological capabilities.
Crystalline Silicon Solar PV Market Dynamics & Trends
This section delves into the key factors shaping the Crystalline Silicon Solar PV market's trajectory. The analysis focuses on market growth drivers, such as increasing government incentives for renewable energy adoption, declining solar panel costs, and rising environmental concerns. Technological advancements like the development of higher-efficiency solar cells and improved energy storage solutions are also thoroughly examined. The report assesses consumer preferences, including the growing demand for aesthetically pleasing solar panels and the desire for energy independence, contributing to the market’s overall growth. The competitive landscape is analyzed, considering factors like pricing strategies, product differentiation, and market penetration. The Compound Annual Growth Rate (CAGR) for the Crystalline Silicon Solar PV market is projected to be xx% during the forecast period (2025-2033), with market penetration expected to reach xx% by 2033.
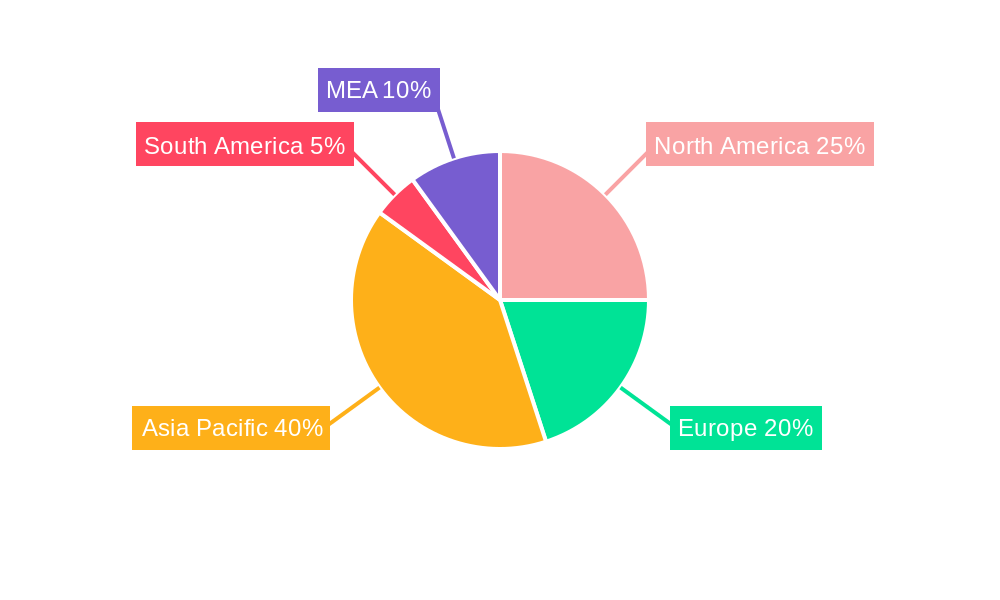
Dominant Regions & Segments in Crystalline Silicon Solar PV Market
This section identifies the leading regions and segments within the Crystalline Silicon Solar PV market. The analysis considers both geographical regions and market segments categorized by type (Mono-Crystalline, Poly-Crystalline/Multi-Crystalline) and end-user (Commercial, Residential, Utility-Scale). China's dominance in the market is explored, factoring in its robust manufacturing base, government support for renewable energy, and extensive deployment of solar PV projects.
Key Drivers by Region/Segment:
- China (Utility-Scale): Favorable government policies, massive infrastructure projects, and a large manufacturing base.
- Europe (Residential): Stringent emission reduction targets, growing environmental awareness, and increasing government incentives.
- North America (Commercial): High adoption rate in commercial buildings, coupled with corporate sustainability initiatives.
- Mono-Crystalline: Higher efficiency and premium pricing compared to polycrystalline counterparts.
- Utility-Scale: Large-scale projects offering significant economies of scale and cost advantages.
The report provides detailed analysis on market size, growth projections and competitive landscape for each region and segment.
Crystalline Silicon Solar PV Market Product Innovations
Recent technological advancements have significantly enhanced the efficiency and cost-effectiveness of crystalline silicon solar panels. Innovations focus on improving cell efficiency through advanced manufacturing processes and materials science. New module designs offer enhanced durability and aesthetics, improving market fit for both residential and commercial applications. The emergence of bifacial solar panels, which capture sunlight from both sides, is also driving market growth, increasing energy yield and return on investment.
Report Scope & Segmentation Analysis
This report segments the Crystalline Silicon Solar PV market based on product type and end-user.
By Type:
Mono-Crystalline: This segment is projected to experience significant growth due to its higher efficiency and premium pricing. Competition is intense amongst leading manufacturers.
Poly-Crystalline/Multi-Crystalline: This segment is expected to maintain a considerable market share due to its cost-effectiveness. The competitive landscape is characterized by intense price competition.
By End-User:
- Commercial: This segment is driven by the rising adoption of renewable energy solutions by businesses and corporations, driven by sustainability goals.
- Residential: This segment is experiencing growth due to decreasing installation costs and favorable government incentives.
- Utility-Scale: This segment is expected to dominate market share due to the large-scale deployment of solar power plants.
Key Drivers of Crystalline Silicon Solar PV Market Growth
Several factors are driving the growth of the Crystalline Silicon Solar PV market. These include declining solar panel costs, which have made solar energy more competitive with traditional fossil fuels. Government support through subsidies, tax incentives, and renewable energy mandates has significantly boosted market demand. Increasing environmental awareness and the global push for decarbonization also play a significant role. Technological improvements leading to higher efficiency and durability further fuel market expansion.
Challenges in the Crystalline Silicon Solar PV Market Sector
The Crystalline Silicon Solar PV market faces challenges, including supply chain disruptions impacting the availability of raw materials and components. Intermittency of solar energy necessitates energy storage solutions, adding to project costs. Furthermore, intense competition among manufacturers and fluctuating prices of raw materials impact profitability. Regulatory uncertainty and inconsistent policy implementation in different regions can also hinder investment and market expansion. The total impact of these challenges is estimated to result in a xx% reduction in market growth by 2033.
Emerging Opportunities in Crystalline Silicon Solar PV Market
Opportunities abound in the Crystalline Silicon Solar PV market, with emerging markets in developing countries presenting significant growth potential. Advancements in energy storage technologies and grid integration solutions are opening new avenues for solar PV adoption. Growing interest in agrivoltaics and floating solar farms demonstrates the market's adaptability and potential for diversification. The increasing focus on circular economy principles and the development of sustainable recycling methods for solar panels present additional growth opportunities.
Leading Players in the Crystalline Silicon Solar PV Market Market
- JinkoSolar Holding Co Ltd
- SolarWorld AG
- JA Solar Holdings
- Canadian Solar Inc
- Sharp Corporation
- Hanwha Q CELLS Co Ltd
- Trina Solar Limited
Key Developments in Crystalline Silicon Solar PV Market Industry
- January 2020: BLD Power Stations Inc commissioned a 0.673 MW solar photovoltaic plant in Nagasaki, Japan, using 280W polycrystalline silicon solar modules supplied by Ningbo Ulica Solar Science & Technology Co Ltd.
- 2021: Artistic Milliners Pvt Ltd started construction of the 50 MW Saleh Pat Solar PV Park, utilizing 340 W polycrystalline silicon modules from JA Solar Holdings Co Ltd.
Future Outlook for Crystalline Silicon Solar PV Market Market
The Crystalline Silicon Solar PV market is poised for continued growth, driven by strong government support, technological advancements, and increasing demand for clean energy. The focus on improving energy storage solutions and grid integration capabilities will further drive market expansion. Continued cost reductions and efficiency improvements will make solar energy even more competitive, opening up new markets and applications. The market's future growth trajectory is projected to be substantial, fueled by the global shift towards sustainable energy practices.
Crystalline Silicon Solar PV Market Segmentation
-
1. type
- 1.1. Mono-Crystalline
- 1.2. Poly-Crystalline or Multi Crystalline
-
2. End-User
- 2.1. Commercial
- 2.2. Residential
- 2.3. Utility Scale
Crystalline Silicon Solar PV Market Segmentation By Geography
- 1. North America
- 2. Europe
- 3. Asia Pacific
- 4. South America
- 5. Middle East and Africa
Crystalline Silicon Solar PV Market REPORT HIGHLIGHTS
| Aspects | Details |
|---|---|
| Study Period | 2019-2033 |
| Base Year | 2024 |
| Estimated Year | 2025 |
| Forecast Period | 2025-2033 |
| Historical Period | 2019-2024 |
| Growth Rate | CAGR of 5.30% from 2019-2033 |
| Segmentation |
|
Table of Contents
- 1. Introduction
- 1.1. Research Scope
- 1.2. Market Segmentation
- 1.3. Research Methodology
- 1.4. Definitions and Assumptions
- 2. Executive Summary
- 2.1. Introduction
- 3. Market Dynamics
- 3.1. Introduction
- 3.2. Market Drivers
- 3.2.1. 4.; Increasing Production from Unconventional Sources4.; Growing Energy Demand in the Region
- 3.3. Market Restrains
- 3.3.1. 4.; Environmental Concerns
- 3.4. Market Trends
- 3.4.1. Multi-Crystalline Silicon PV is Expected to Dominate the Market
- 4. Market Factor Analysis
- 4.1. Porters Five Forces
- 4.2. Supply/Value Chain
- 4.3. PESTEL analysis
- 4.4. Market Entropy
- 4.5. Patent/Trademark Analysis
- 5. Global Crystalline Silicon Solar PV Market Analysis, Insights and Forecast, 2019-2031
- 5.1. Market Analysis, Insights and Forecast - by type
- 5.1.1. Mono-Crystalline
- 5.1.2. Poly-Crystalline or Multi Crystalline
- 5.2. Market Analysis, Insights and Forecast - by End-User
- 5.2.1. Commercial
- 5.2.2. Residential
- 5.2.3. Utility Scale
- 5.3. Market Analysis, Insights and Forecast - by Region
- 5.3.1. North America
- 5.3.2. Europe
- 5.3.3. Asia Pacific
- 5.3.4. South America
- 5.3.5. Middle East and Africa
- 5.1. Market Analysis, Insights and Forecast - by type
- 6. North America Crystalline Silicon Solar PV Market Analysis, Insights and Forecast, 2019-2031
- 6.1. Market Analysis, Insights and Forecast - by type
- 6.1.1. Mono-Crystalline
- 6.1.2. Poly-Crystalline or Multi Crystalline
- 6.2. Market Analysis, Insights and Forecast - by End-User
- 6.2.1. Commercial
- 6.2.2. Residential
- 6.2.3. Utility Scale
- 6.1. Market Analysis, Insights and Forecast - by type
- 7. Europe Crystalline Silicon Solar PV Market Analysis, Insights and Forecast, 2019-2031
- 7.1. Market Analysis, Insights and Forecast - by type
- 7.1.1. Mono-Crystalline
- 7.1.2. Poly-Crystalline or Multi Crystalline
- 7.2. Market Analysis, Insights and Forecast - by End-User
- 7.2.1. Commercial
- 7.2.2. Residential
- 7.2.3. Utility Scale
- 7.1. Market Analysis, Insights and Forecast - by type
- 8. Asia Pacific Crystalline Silicon Solar PV Market Analysis, Insights and Forecast, 2019-2031
- 8.1. Market Analysis, Insights and Forecast - by type
- 8.1.1. Mono-Crystalline
- 8.1.2. Poly-Crystalline or Multi Crystalline
- 8.2. Market Analysis, Insights and Forecast - by End-User
- 8.2.1. Commercial
- 8.2.2. Residential
- 8.2.3. Utility Scale
- 8.1. Market Analysis, Insights and Forecast - by type
- 9. South America Crystalline Silicon Solar PV Market Analysis, Insights and Forecast, 2019-2031
- 9.1. Market Analysis, Insights and Forecast - by type
- 9.1.1. Mono-Crystalline
- 9.1.2. Poly-Crystalline or Multi Crystalline
- 9.2. Market Analysis, Insights and Forecast - by End-User
- 9.2.1. Commercial
- 9.2.2. Residential
- 9.2.3. Utility Scale
- 9.1. Market Analysis, Insights and Forecast - by type
- 10. Middle East and Africa Crystalline Silicon Solar PV Market Analysis, Insights and Forecast, 2019-2031
- 10.1. Market Analysis, Insights and Forecast - by type
- 10.1.1. Mono-Crystalline
- 10.1.2. Poly-Crystalline or Multi Crystalline
- 10.2. Market Analysis, Insights and Forecast - by End-User
- 10.2.1. Commercial
- 10.2.2. Residential
- 10.2.3. Utility Scale
- 10.1. Market Analysis, Insights and Forecast - by type
- 11. North America Crystalline Silicon Solar PV Market Analysis, Insights and Forecast, 2019-2031
- 11.1. Market Analysis, Insights and Forecast - By Country/Sub-region
- 11.1.1 United States
- 11.1.2 Canada
- 11.1.3 Mexico
- 12. Europe Crystalline Silicon Solar PV Market Analysis, Insights and Forecast, 2019-2031
- 12.1. Market Analysis, Insights and Forecast - By Country/Sub-region
- 12.1.1 Germany
- 12.1.2 United Kingdom
- 12.1.3 France
- 12.1.4 Spain
- 12.1.5 Italy
- 12.1.6 Spain
- 12.1.7 Belgium
- 12.1.8 Netherland
- 12.1.9 Nordics
- 12.1.10 Rest of Europe
- 13. Asia Pacific Crystalline Silicon Solar PV Market Analysis, Insights and Forecast, 2019-2031
- 13.1. Market Analysis, Insights and Forecast - By Country/Sub-region
- 13.1.1 China
- 13.1.2 Japan
- 13.1.3 India
- 13.1.4 South Korea
- 13.1.5 Southeast Asia
- 13.1.6 Australia
- 13.1.7 Indonesia
- 13.1.8 Phillipes
- 13.1.9 Singapore
- 13.1.10 Thailandc
- 13.1.11 Rest of Asia Pacific
- 14. South America Crystalline Silicon Solar PV Market Analysis, Insights and Forecast, 2019-2031
- 14.1. Market Analysis, Insights and Forecast - By Country/Sub-region
- 14.1.1 Brazil
- 14.1.2 Argentina
- 14.1.3 Peru
- 14.1.4 Chile
- 14.1.5 Colombia
- 14.1.6 Ecuador
- 14.1.7 Venezuela
- 14.1.8 Rest of South America
- 15. MEA Crystalline Silicon Solar PV Market Analysis, Insights and Forecast, 2019-2031
- 15.1. Market Analysis, Insights and Forecast - By Country/Sub-region
- 15.1.1 United Arab Emirates
- 15.1.2 Saudi Arabia
- 15.1.3 South Africa
- 15.1.4 Rest of Middle East and Africa
- 16. Competitive Analysis
- 16.1. Global Market Share Analysis 2024
- 16.2. Company Profiles
- 16.2.1 JinkoSolar Holding Co Ltd
- 16.2.1.1. Overview
- 16.2.1.2. Products
- 16.2.1.3. SWOT Analysis
- 16.2.1.4. Recent Developments
- 16.2.1.5. Financials (Based on Availability)
- 16.2.2 SolarWorld AG
- 16.2.2.1. Overview
- 16.2.2.2. Products
- 16.2.2.3. SWOT Analysis
- 16.2.2.4. Recent Developments
- 16.2.2.5. Financials (Based on Availability)
- 16.2.3 JA Solar Holdings
- 16.2.3.1. Overview
- 16.2.3.2. Products
- 16.2.3.3. SWOT Analysis
- 16.2.3.4. Recent Developments
- 16.2.3.5. Financials (Based on Availability)
- 16.2.4 Canadian Solar Inc
- 16.2.4.1. Overview
- 16.2.4.2. Products
- 16.2.4.3. SWOT Analysis
- 16.2.4.4. Recent Developments
- 16.2.4.5. Financials (Based on Availability)
- 16.2.5 Sharp Corporation
- 16.2.5.1. Overview
- 16.2.5.2. Products
- 16.2.5.3. SWOT Analysis
- 16.2.5.4. Recent Developments
- 16.2.5.5. Financials (Based on Availability)
- 16.2.6 Hanwha Q CELLS Co Ltd
- 16.2.6.1. Overview
- 16.2.6.2. Products
- 16.2.6.3. SWOT Analysis
- 16.2.6.4. Recent Developments
- 16.2.6.5. Financials (Based on Availability)
- 16.2.7 Trina Solar Limited
- 16.2.7.1. Overview
- 16.2.7.2. Products
- 16.2.7.3. SWOT Analysis
- 16.2.7.4. Recent Developments
- 16.2.7.5. Financials (Based on Availability)
- 16.2.1 JinkoSolar Holding Co Ltd
List of Figures
- Figure 1: Global Crystalline Silicon Solar PV Market Revenue Breakdown (Million, %) by Region 2024 & 2032
- Figure 2: Global Crystalline Silicon Solar PV Market Volume Breakdown (Gigawatt, %) by Region 2024 & 2032
- Figure 3: North America Crystalline Silicon Solar PV Market Revenue (Million), by Country 2024 & 2032
- Figure 4: North America Crystalline Silicon Solar PV Market Volume (Gigawatt), by Country 2024 & 2032
- Figure 5: North America Crystalline Silicon Solar PV Market Revenue Share (%), by Country 2024 & 2032
- Figure 6: North America Crystalline Silicon Solar PV Market Volume Share (%), by Country 2024 & 2032
- Figure 7: Europe Crystalline Silicon Solar PV Market Revenue (Million), by Country 2024 & 2032
- Figure 8: Europe Crystalline Silicon Solar PV Market Volume (Gigawatt), by Country 2024 & 2032
- Figure 9: Europe Crystalline Silicon Solar PV Market Revenue Share (%), by Country 2024 & 2032
- Figure 10: Europe Crystalline Silicon Solar PV Market Volume Share (%), by Country 2024 & 2032
- Figure 11: Asia Pacific Crystalline Silicon Solar PV Market Revenue (Million), by Country 2024 & 2032
- Figure 12: Asia Pacific Crystalline Silicon Solar PV Market Volume (Gigawatt), by Country 2024 & 2032
- Figure 13: Asia Pacific Crystalline Silicon Solar PV Market Revenue Share (%), by Country 2024 & 2032
- Figure 14: Asia Pacific Crystalline Silicon Solar PV Market Volume Share (%), by Country 2024 & 2032
- Figure 15: South America Crystalline Silicon Solar PV Market Revenue (Million), by Country 2024 & 2032
- Figure 16: South America Crystalline Silicon Solar PV Market Volume (Gigawatt), by Country 2024 & 2032
- Figure 17: South America Crystalline Silicon Solar PV Market Revenue Share (%), by Country 2024 & 2032
- Figure 18: South America Crystalline Silicon Solar PV Market Volume Share (%), by Country 2024 & 2032
- Figure 19: MEA Crystalline Silicon Solar PV Market Revenue (Million), by Country 2024 & 2032
- Figure 20: MEA Crystalline Silicon Solar PV Market Volume (Gigawatt), by Country 2024 & 2032
- Figure 21: MEA Crystalline Silicon Solar PV Market Revenue Share (%), by Country 2024 & 2032
- Figure 22: MEA Crystalline Silicon Solar PV Market Volume Share (%), by Country 2024 & 2032
- Figure 23: North America Crystalline Silicon Solar PV Market Revenue (Million), by type 2024 & 2032
- Figure 24: North America Crystalline Silicon Solar PV Market Volume (Gigawatt), by type 2024 & 2032
- Figure 25: North America Crystalline Silicon Solar PV Market Revenue Share (%), by type 2024 & 2032
- Figure 26: North America Crystalline Silicon Solar PV Market Volume Share (%), by type 2024 & 2032
- Figure 27: North America Crystalline Silicon Solar PV Market Revenue (Million), by End-User 2024 & 2032
- Figure 28: North America Crystalline Silicon Solar PV Market Volume (Gigawatt), by End-User 2024 & 2032
- Figure 29: North America Crystalline Silicon Solar PV Market Revenue Share (%), by End-User 2024 & 2032
- Figure 30: North America Crystalline Silicon Solar PV Market Volume Share (%), by End-User 2024 & 2032
- Figure 31: North America Crystalline Silicon Solar PV Market Revenue (Million), by Country 2024 & 2032
- Figure 32: North America Crystalline Silicon Solar PV Market Volume (Gigawatt), by Country 2024 & 2032
- Figure 33: North America Crystalline Silicon Solar PV Market Revenue Share (%), by Country 2024 & 2032
- Figure 34: North America Crystalline Silicon Solar PV Market Volume Share (%), by Country 2024 & 2032
- Figure 35: Europe Crystalline Silicon Solar PV Market Revenue (Million), by type 2024 & 2032
- Figure 36: Europe Crystalline Silicon Solar PV Market Volume (Gigawatt), by type 2024 & 2032
- Figure 37: Europe Crystalline Silicon Solar PV Market Revenue Share (%), by type 2024 & 2032
- Figure 38: Europe Crystalline Silicon Solar PV Market Volume Share (%), by type 2024 & 2032
- Figure 39: Europe Crystalline Silicon Solar PV Market Revenue (Million), by End-User 2024 & 2032
- Figure 40: Europe Crystalline Silicon Solar PV Market Volume (Gigawatt), by End-User 2024 & 2032
- Figure 41: Europe Crystalline Silicon Solar PV Market Revenue Share (%), by End-User 2024 & 2032
- Figure 42: Europe Crystalline Silicon Solar PV Market Volume Share (%), by End-User 2024 & 2032
- Figure 43: Europe Crystalline Silicon Solar PV Market Revenue (Million), by Country 2024 & 2032
- Figure 44: Europe Crystalline Silicon Solar PV Market Volume (Gigawatt), by Country 2024 & 2032
- Figure 45: Europe Crystalline Silicon Solar PV Market Revenue Share (%), by Country 2024 & 2032
- Figure 46: Europe Crystalline Silicon Solar PV Market Volume Share (%), by Country 2024 & 2032
- Figure 47: Asia Pacific Crystalline Silicon Solar PV Market Revenue (Million), by type 2024 & 2032
- Figure 48: Asia Pacific Crystalline Silicon Solar PV Market Volume (Gigawatt), by type 2024 & 2032
- Figure 49: Asia Pacific Crystalline Silicon Solar PV Market Revenue Share (%), by type 2024 & 2032
- Figure 50: Asia Pacific Crystalline Silicon Solar PV Market Volume Share (%), by type 2024 & 2032
- Figure 51: Asia Pacific Crystalline Silicon Solar PV Market Revenue (Million), by End-User 2024 & 2032
- Figure 52: Asia Pacific Crystalline Silicon Solar PV Market Volume (Gigawatt), by End-User 2024 & 2032
- Figure 53: Asia Pacific Crystalline Silicon Solar PV Market Revenue Share (%), by End-User 2024 & 2032
- Figure 54: Asia Pacific Crystalline Silicon Solar PV Market Volume Share (%), by End-User 2024 & 2032
- Figure 55: Asia Pacific Crystalline Silicon Solar PV Market Revenue (Million), by Country 2024 & 2032
- Figure 56: Asia Pacific Crystalline Silicon Solar PV Market Volume (Gigawatt), by Country 2024 & 2032
- Figure 57: Asia Pacific Crystalline Silicon Solar PV Market Revenue Share (%), by Country 2024 & 2032
- Figure 58: Asia Pacific Crystalline Silicon Solar PV Market Volume Share (%), by Country 2024 & 2032
- Figure 59: South America Crystalline Silicon Solar PV Market Revenue (Million), by type 2024 & 2032
- Figure 60: South America Crystalline Silicon Solar PV Market Volume (Gigawatt), by type 2024 & 2032
- Figure 61: South America Crystalline Silicon Solar PV Market Revenue Share (%), by type 2024 & 2032
- Figure 62: South America Crystalline Silicon Solar PV Market Volume Share (%), by type 2024 & 2032
- Figure 63: South America Crystalline Silicon Solar PV Market Revenue (Million), by End-User 2024 & 2032
- Figure 64: South America Crystalline Silicon Solar PV Market Volume (Gigawatt), by End-User 2024 & 2032
- Figure 65: South America Crystalline Silicon Solar PV Market Revenue Share (%), by End-User 2024 & 2032
- Figure 66: South America Crystalline Silicon Solar PV Market Volume Share (%), by End-User 2024 & 2032
- Figure 67: South America Crystalline Silicon Solar PV Market Revenue (Million), by Country 2024 & 2032
- Figure 68: South America Crystalline Silicon Solar PV Market Volume (Gigawatt), by Country 2024 & 2032
- Figure 69: South America Crystalline Silicon Solar PV Market Revenue Share (%), by Country 2024 & 2032
- Figure 70: South America Crystalline Silicon Solar PV Market Volume Share (%), by Country 2024 & 2032
- Figure 71: Middle East and Africa Crystalline Silicon Solar PV Market Revenue (Million), by type 2024 & 2032
- Figure 72: Middle East and Africa Crystalline Silicon Solar PV Market Volume (Gigawatt), by type 2024 & 2032
- Figure 73: Middle East and Africa Crystalline Silicon Solar PV Market Revenue Share (%), by type 2024 & 2032
- Figure 74: Middle East and Africa Crystalline Silicon Solar PV Market Volume Share (%), by type 2024 & 2032
- Figure 75: Middle East and Africa Crystalline Silicon Solar PV Market Revenue (Million), by End-User 2024 & 2032
- Figure 76: Middle East and Africa Crystalline Silicon Solar PV Market Volume (Gigawatt), by End-User 2024 & 2032
- Figure 77: Middle East and Africa Crystalline Silicon Solar PV Market Revenue Share (%), by End-User 2024 & 2032
- Figure 78: Middle East and Africa Crystalline Silicon Solar PV Market Volume Share (%), by End-User 2024 & 2032
- Figure 79: Middle East and Africa Crystalline Silicon Solar PV Market Revenue (Million), by Country 2024 & 2032
- Figure 80: Middle East and Africa Crystalline Silicon Solar PV Market Volume (Gigawatt), by Country 2024 & 2032
- Figure 81: Middle East and Africa Crystalline Silicon Solar PV Market Revenue Share (%), by Country 2024 & 2032
- Figure 82: Middle East and Africa Crystalline Silicon Solar PV Market Volume Share (%), by Country 2024 & 2032
List of Tables
- Table 1: Global Crystalline Silicon Solar PV Market Revenue Million Forecast, by Region 2019 & 2032
- Table 2: Global Crystalline Silicon Solar PV Market Volume Gigawatt Forecast, by Region 2019 & 2032
- Table 3: Global Crystalline Silicon Solar PV Market Revenue Million Forecast, by type 2019 & 2032
- Table 4: Global Crystalline Silicon Solar PV Market Volume Gigawatt Forecast, by type 2019 & 2032
- Table 5: Global Crystalline Silicon Solar PV Market Revenue Million Forecast, by End-User 2019 & 2032
- Table 6: Global Crystalline Silicon Solar PV Market Volume Gigawatt Forecast, by End-User 2019 & 2032
- Table 7: Global Crystalline Silicon Solar PV Market Revenue Million Forecast, by Region 2019 & 2032
- Table 8: Global Crystalline Silicon Solar PV Market Volume Gigawatt Forecast, by Region 2019 & 2032
- Table 9: Global Crystalline Silicon Solar PV Market Revenue Million Forecast, by Country 2019 & 2032
- Table 10: Global Crystalline Silicon Solar PV Market Volume Gigawatt Forecast, by Country 2019 & 2032
- Table 11: United States Crystalline Silicon Solar PV Market Revenue (Million) Forecast, by Application 2019 & 2032
- Table 12: United States Crystalline Silicon Solar PV Market Volume (Gigawatt) Forecast, by Application 2019 & 2032
- Table 13: Canada Crystalline Silicon Solar PV Market Revenue (Million) Forecast, by Application 2019 & 2032
- Table 14: Canada Crystalline Silicon Solar PV Market Volume (Gigawatt) Forecast, by Application 2019 & 2032
- Table 15: Mexico Crystalline Silicon Solar PV Market Revenue (Million) Forecast, by Application 2019 & 2032
- Table 16: Mexico Crystalline Silicon Solar PV Market Volume (Gigawatt) Forecast, by Application 2019 & 2032
- Table 17: Global Crystalline Silicon Solar PV Market Revenue Million Forecast, by Country 2019 & 2032
- Table 18: Global Crystalline Silicon Solar PV Market Volume Gigawatt Forecast, by Country 2019 & 2032
- Table 19: Germany Crystalline Silicon Solar PV Market Revenue (Million) Forecast, by Application 2019 & 2032
- Table 20: Germany Crystalline Silicon Solar PV Market Volume (Gigawatt) Forecast, by Application 2019 & 2032
- Table 21: United Kingdom Crystalline Silicon Solar PV Market Revenue (Million) Forecast, by Application 2019 & 2032
- Table 22: United Kingdom Crystalline Silicon Solar PV Market Volume (Gigawatt) Forecast, by Application 2019 & 2032
- Table 23: France Crystalline Silicon Solar PV Market Revenue (Million) Forecast, by Application 2019 & 2032
- Table 24: France Crystalline Silicon Solar PV Market Volume (Gigawatt) Forecast, by Application 2019 & 2032
- Table 25: Spain Crystalline Silicon Solar PV Market Revenue (Million) Forecast, by Application 2019 & 2032
- Table 26: Spain Crystalline Silicon Solar PV Market Volume (Gigawatt) Forecast, by Application 2019 & 2032
- Table 27: Italy Crystalline Silicon Solar PV Market Revenue (Million) Forecast, by Application 2019 & 2032
- Table 28: Italy Crystalline Silicon Solar PV Market Volume (Gigawatt) Forecast, by Application 2019 & 2032
- Table 29: Spain Crystalline Silicon Solar PV Market Revenue (Million) Forecast, by Application 2019 & 2032
- Table 30: Spain Crystalline Silicon Solar PV Market Volume (Gigawatt) Forecast, by Application 2019 & 2032
- Table 31: Belgium Crystalline Silicon Solar PV Market Revenue (Million) Forecast, by Application 2019 & 2032
- Table 32: Belgium Crystalline Silicon Solar PV Market Volume (Gigawatt) Forecast, by Application 2019 & 2032
- Table 33: Netherland Crystalline Silicon Solar PV Market Revenue (Million) Forecast, by Application 2019 & 2032
- Table 34: Netherland Crystalline Silicon Solar PV Market Volume (Gigawatt) Forecast, by Application 2019 & 2032
- Table 35: Nordics Crystalline Silicon Solar PV Market Revenue (Million) Forecast, by Application 2019 & 2032
- Table 36: Nordics Crystalline Silicon Solar PV Market Volume (Gigawatt) Forecast, by Application 2019 & 2032
- Table 37: Rest of Europe Crystalline Silicon Solar PV Market Revenue (Million) Forecast, by Application 2019 & 2032
- Table 38: Rest of Europe Crystalline Silicon Solar PV Market Volume (Gigawatt) Forecast, by Application 2019 & 2032
- Table 39: Global Crystalline Silicon Solar PV Market Revenue Million Forecast, by Country 2019 & 2032
- Table 40: Global Crystalline Silicon Solar PV Market Volume Gigawatt Forecast, by Country 2019 & 2032
- Table 41: China Crystalline Silicon Solar PV Market Revenue (Million) Forecast, by Application 2019 & 2032
- Table 42: China Crystalline Silicon Solar PV Market Volume (Gigawatt) Forecast, by Application 2019 & 2032
- Table 43: Japan Crystalline Silicon Solar PV Market Revenue (Million) Forecast, by Application 2019 & 2032
- Table 44: Japan Crystalline Silicon Solar PV Market Volume (Gigawatt) Forecast, by Application 2019 & 2032
- Table 45: India Crystalline Silicon Solar PV Market Revenue (Million) Forecast, by Application 2019 & 2032
- Table 46: India Crystalline Silicon Solar PV Market Volume (Gigawatt) Forecast, by Application 2019 & 2032
- Table 47: South Korea Crystalline Silicon Solar PV Market Revenue (Million) Forecast, by Application 2019 & 2032
- Table 48: South Korea Crystalline Silicon Solar PV Market Volume (Gigawatt) Forecast, by Application 2019 & 2032
- Table 49: Southeast Asia Crystalline Silicon Solar PV Market Revenue (Million) Forecast, by Application 2019 & 2032
- Table 50: Southeast Asia Crystalline Silicon Solar PV Market Volume (Gigawatt) Forecast, by Application 2019 & 2032
- Table 51: Australia Crystalline Silicon Solar PV Market Revenue (Million) Forecast, by Application 2019 & 2032
- Table 52: Australia Crystalline Silicon Solar PV Market Volume (Gigawatt) Forecast, by Application 2019 & 2032
- Table 53: Indonesia Crystalline Silicon Solar PV Market Revenue (Million) Forecast, by Application 2019 & 2032
- Table 54: Indonesia Crystalline Silicon Solar PV Market Volume (Gigawatt) Forecast, by Application 2019 & 2032
- Table 55: Phillipes Crystalline Silicon Solar PV Market Revenue (Million) Forecast, by Application 2019 & 2032
- Table 56: Phillipes Crystalline Silicon Solar PV Market Volume (Gigawatt) Forecast, by Application 2019 & 2032
- Table 57: Singapore Crystalline Silicon Solar PV Market Revenue (Million) Forecast, by Application 2019 & 2032
- Table 58: Singapore Crystalline Silicon Solar PV Market Volume (Gigawatt) Forecast, by Application 2019 & 2032
- Table 59: Thailandc Crystalline Silicon Solar PV Market Revenue (Million) Forecast, by Application 2019 & 2032
- Table 60: Thailandc Crystalline Silicon Solar PV Market Volume (Gigawatt) Forecast, by Application 2019 & 2032
- Table 61: Rest of Asia Pacific Crystalline Silicon Solar PV Market Revenue (Million) Forecast, by Application 2019 & 2032
- Table 62: Rest of Asia Pacific Crystalline Silicon Solar PV Market Volume (Gigawatt) Forecast, by Application 2019 & 2032
- Table 63: Global Crystalline Silicon Solar PV Market Revenue Million Forecast, by Country 2019 & 2032
- Table 64: Global Crystalline Silicon Solar PV Market Volume Gigawatt Forecast, by Country 2019 & 2032
- Table 65: Brazil Crystalline Silicon Solar PV Market Revenue (Million) Forecast, by Application 2019 & 2032
- Table 66: Brazil Crystalline Silicon Solar PV Market Volume (Gigawatt) Forecast, by Application 2019 & 2032
- Table 67: Argentina Crystalline Silicon Solar PV Market Revenue (Million) Forecast, by Application 2019 & 2032
- Table 68: Argentina Crystalline Silicon Solar PV Market Volume (Gigawatt) Forecast, by Application 2019 & 2032
- Table 69: Peru Crystalline Silicon Solar PV Market Revenue (Million) Forecast, by Application 2019 & 2032
- Table 70: Peru Crystalline Silicon Solar PV Market Volume (Gigawatt) Forecast, by Application 2019 & 2032
- Table 71: Chile Crystalline Silicon Solar PV Market Revenue (Million) Forecast, by Application 2019 & 2032
- Table 72: Chile Crystalline Silicon Solar PV Market Volume (Gigawatt) Forecast, by Application 2019 & 2032
- Table 73: Colombia Crystalline Silicon Solar PV Market Revenue (Million) Forecast, by Application 2019 & 2032
- Table 74: Colombia Crystalline Silicon Solar PV Market Volume (Gigawatt) Forecast, by Application 2019 & 2032
- Table 75: Ecuador Crystalline Silicon Solar PV Market Revenue (Million) Forecast, by Application 2019 & 2032
- Table 76: Ecuador Crystalline Silicon Solar PV Market Volume (Gigawatt) Forecast, by Application 2019 & 2032
- Table 77: Venezuela Crystalline Silicon Solar PV Market Revenue (Million) Forecast, by Application 2019 & 2032
- Table 78: Venezuela Crystalline Silicon Solar PV Market Volume (Gigawatt) Forecast, by Application 2019 & 2032
- Table 79: Rest of South America Crystalline Silicon Solar PV Market Revenue (Million) Forecast, by Application 2019 & 2032
- Table 80: Rest of South America Crystalline Silicon Solar PV Market Volume (Gigawatt) Forecast, by Application 2019 & 2032
- Table 81: Global Crystalline Silicon Solar PV Market Revenue Million Forecast, by Country 2019 & 2032
- Table 82: Global Crystalline Silicon Solar PV Market Volume Gigawatt Forecast, by Country 2019 & 2032
- Table 83: United Arab Emirates Crystalline Silicon Solar PV Market Revenue (Million) Forecast, by Application 2019 & 2032
- Table 84: United Arab Emirates Crystalline Silicon Solar PV Market Volume (Gigawatt) Forecast, by Application 2019 & 2032
- Table 85: Saudi Arabia Crystalline Silicon Solar PV Market Revenue (Million) Forecast, by Application 2019 & 2032
- Table 86: Saudi Arabia Crystalline Silicon Solar PV Market Volume (Gigawatt) Forecast, by Application 2019 & 2032
- Table 87: South Africa Crystalline Silicon Solar PV Market Revenue (Million) Forecast, by Application 2019 & 2032
- Table 88: South Africa Crystalline Silicon Solar PV Market Volume (Gigawatt) Forecast, by Application 2019 & 2032
- Table 89: Rest of Middle East and Africa Crystalline Silicon Solar PV Market Revenue (Million) Forecast, by Application 2019 & 2032
- Table 90: Rest of Middle East and Africa Crystalline Silicon Solar PV Market Volume (Gigawatt) Forecast, by Application 2019 & 2032
- Table 91: Global Crystalline Silicon Solar PV Market Revenue Million Forecast, by type 2019 & 2032
- Table 92: Global Crystalline Silicon Solar PV Market Volume Gigawatt Forecast, by type 2019 & 2032
- Table 93: Global Crystalline Silicon Solar PV Market Revenue Million Forecast, by End-User 2019 & 2032
- Table 94: Global Crystalline Silicon Solar PV Market Volume Gigawatt Forecast, by End-User 2019 & 2032
- Table 95: Global Crystalline Silicon Solar PV Market Revenue Million Forecast, by Country 2019 & 2032
- Table 96: Global Crystalline Silicon Solar PV Market Volume Gigawatt Forecast, by Country 2019 & 2032
- Table 97: Global Crystalline Silicon Solar PV Market Revenue Million Forecast, by type 2019 & 2032
- Table 98: Global Crystalline Silicon Solar PV Market Volume Gigawatt Forecast, by type 2019 & 2032
- Table 99: Global Crystalline Silicon Solar PV Market Revenue Million Forecast, by End-User 2019 & 2032
- Table 100: Global Crystalline Silicon Solar PV Market Volume Gigawatt Forecast, by End-User 2019 & 2032
- Table 101: Global Crystalline Silicon Solar PV Market Revenue Million Forecast, by Country 2019 & 2032
- Table 102: Global Crystalline Silicon Solar PV Market Volume Gigawatt Forecast, by Country 2019 & 2032
- Table 103: Global Crystalline Silicon Solar PV Market Revenue Million Forecast, by type 2019 & 2032
- Table 104: Global Crystalline Silicon Solar PV Market Volume Gigawatt Forecast, by type 2019 & 2032
- Table 105: Global Crystalline Silicon Solar PV Market Revenue Million Forecast, by End-User 2019 & 2032
- Table 106: Global Crystalline Silicon Solar PV Market Volume Gigawatt Forecast, by End-User 2019 & 2032
- Table 107: Global Crystalline Silicon Solar PV Market Revenue Million Forecast, by Country 2019 & 2032
- Table 108: Global Crystalline Silicon Solar PV Market Volume Gigawatt Forecast, by Country 2019 & 2032
- Table 109: Global Crystalline Silicon Solar PV Market Revenue Million Forecast, by type 2019 & 2032
- Table 110: Global Crystalline Silicon Solar PV Market Volume Gigawatt Forecast, by type 2019 & 2032
- Table 111: Global Crystalline Silicon Solar PV Market Revenue Million Forecast, by End-User 2019 & 2032
- Table 112: Global Crystalline Silicon Solar PV Market Volume Gigawatt Forecast, by End-User 2019 & 2032
- Table 113: Global Crystalline Silicon Solar PV Market Revenue Million Forecast, by Country 2019 & 2032
- Table 114: Global Crystalline Silicon Solar PV Market Volume Gigawatt Forecast, by Country 2019 & 2032
- Table 115: Global Crystalline Silicon Solar PV Market Revenue Million Forecast, by type 2019 & 2032
- Table 116: Global Crystalline Silicon Solar PV Market Volume Gigawatt Forecast, by type 2019 & 2032
- Table 117: Global Crystalline Silicon Solar PV Market Revenue Million Forecast, by End-User 2019 & 2032
- Table 118: Global Crystalline Silicon Solar PV Market Volume Gigawatt Forecast, by End-User 2019 & 2032
- Table 119: Global Crystalline Silicon Solar PV Market Revenue Million Forecast, by Country 2019 & 2032
- Table 120: Global Crystalline Silicon Solar PV Market Volume Gigawatt Forecast, by Country 2019 & 2032
Frequently Asked Questions
1. What is the projected Compound Annual Growth Rate (CAGR) of the Crystalline Silicon Solar PV Market?
The projected CAGR is approximately 5.30%.
2. Which companies are prominent players in the Crystalline Silicon Solar PV Market?
Key companies in the market include JinkoSolar Holding Co Ltd, SolarWorld AG, JA Solar Holdings, Canadian Solar Inc, Sharp Corporation, Hanwha Q CELLS Co Ltd, Trina Solar Limited.
3. What are the main segments of the Crystalline Silicon Solar PV Market?
The market segments include type, End-User.
4. Can you provide details about the market size?
The market size is estimated to be USD XX Million as of 2022.
5. What are some drivers contributing to market growth?
4.; Increasing Production from Unconventional Sources4.; Growing Energy Demand in the Region.
6. What are the notable trends driving market growth?
Multi-Crystalline Silicon PV is Expected to Dominate the Market.
7. Are there any restraints impacting market growth?
4.; Environmental Concerns.
8. Can you provide examples of recent developments in the market?
In January 2020, BLD Power Stations Inc has commissioned 0.673 MW solar photovoltaic plant in Nagasaki, Japan. Ningbo Ulica Solar Science & Technology Co Ltd has supplied 280W polycrystalline silicon solar modules for this project.
9. What pricing options are available for accessing the report?
Pricing options include single-user, multi-user, and enterprise licenses priced at USD 4750, USD 5250, and USD 8750 respectively.
10. Is the market size provided in terms of value or volume?
The market size is provided in terms of value, measured in Million and volume, measured in Gigawatt.
11. Are there any specific market keywords associated with the report?
Yes, the market keyword associated with the report is "Crystalline Silicon Solar PV Market," which aids in identifying and referencing the specific market segment covered.
12. How do I determine which pricing option suits my needs best?
The pricing options vary based on user requirements and access needs. Individual users may opt for single-user licenses, while businesses requiring broader access may choose multi-user or enterprise licenses for cost-effective access to the report.
13. Are there any additional resources or data provided in the Crystalline Silicon Solar PV Market report?
While the report offers comprehensive insights, it's advisable to review the specific contents or supplementary materials provided to ascertain if additional resources or data are available.
14. How can I stay updated on further developments or reports in the Crystalline Silicon Solar PV Market?
To stay informed about further developments, trends, and reports in the Crystalline Silicon Solar PV Market, consider subscribing to industry newsletters, following relevant companies and organizations, or regularly checking reputable industry news sources and publications.
Methodology
Step 1 - Identification of Relevant Samples Size from Population Database


Step 2 - Approaches for Defining Global Market Size (Value, Volume* & Price*)

Note*: In applicable scenarios
Step 3 - Data Sources
Primary Research
- Web Analytics
- Survey Reports
- Research Institute
- Latest Research Reports
- Opinion Leaders
Secondary Research
- Annual Reports
- White Paper
- Latest Press Release
- Industry Association
- Paid Database
- Investor Presentations

Step 4 - Data Triangulation
Involves using different sources of information in order to increase the validity of a study
These sources are likely to be stakeholders in a program - participants, other researchers, program staff, other community members, and so on.
Then we put all data in single framework & apply various statistical tools to find out the dynamic on the market.
During the analysis stage, feedback from the stakeholder groups would be compared to determine areas of agreement as well as areas of divergence


