
Key Insights
The global dental bone graft substitutes market is experiencing robust growth, projected to reach a substantial size by 2033, driven by a 6.80% CAGR. This expansion is fueled by several key factors. The increasing prevalence of periodontal diseases, trauma-related bone loss, and the rising demand for aesthetically pleasing and functional dental implants are major contributors. Advancements in materials science are leading to the development of biocompatible and highly effective bone graft substitutes, further stimulating market growth. The market is segmented by mechanism (osteoconduction, osteoinduction, osteogenesis, osteopromotion), end-user (hospitals, dental clinics, other end-users), and type (xenograft, allograft, autograft, and others). The preference for minimally invasive procedures and the rising adoption of advanced surgical techniques are also contributing to market expansion. Geographic distribution shows significant market penetration in North America and Europe, driven by high healthcare expenditure and technological advancements. However, regulatory hurdles and high costs associated with some advanced substitutes might pose challenges to market growth in certain regions. The competitive landscape includes both established players like Zimmer Biomet, Medtronic, and Johnson & Johnson, and emerging companies innovating in material science and delivery systems. Future growth will likely be influenced by ongoing research into novel biomaterials, personalized medicine approaches, and increasing awareness among dentists and patients about the benefits of bone graft substitutes.
The success of key players in this market hinges on their ability to innovate, secure regulatory approvals, and establish strong distribution networks. Companies are strategically investing in research and development to enhance product efficacy and safety profiles. Strategic partnerships and acquisitions are also common strategies to expand market reach and product portfolios. The market is expected to witness consolidation in the coming years, with larger players acquiring smaller companies specializing in niche technologies. Moreover, the increasing adoption of digital technologies in dentistry, such as 3D printing and computer-aided design/computer-aided manufacturing (CAD/CAM), is likely to further enhance the precision and efficiency of bone grafting procedures, boosting market growth. The market is also expected to see increasing demand for customized solutions tailored to individual patient needs, reflecting the broader trend towards personalized medicine.
Dental Bone Graft Substitutes Industry Market Report: 2019-2033
This comprehensive report provides a detailed analysis of the global Dental Bone Graft Substitutes market, offering valuable insights for industry professionals, investors, and stakeholders. The report covers the period 2019-2033, with a focus on the forecast period 2025-2033 and a base year of 2025. The market is segmented by mechanism (Osteoconduction, Osteoinduction, Osteogenesis, Osteopromotion), end-user (Hospitals, Dental Clinics, Other End Users), and type (Xenograft, Allograft, Autograft, Other Types). The report projects a market value exceeding $xx Million by 2033.
Dental Bone Graft Substitutes Industry Market Structure & Innovation Trends
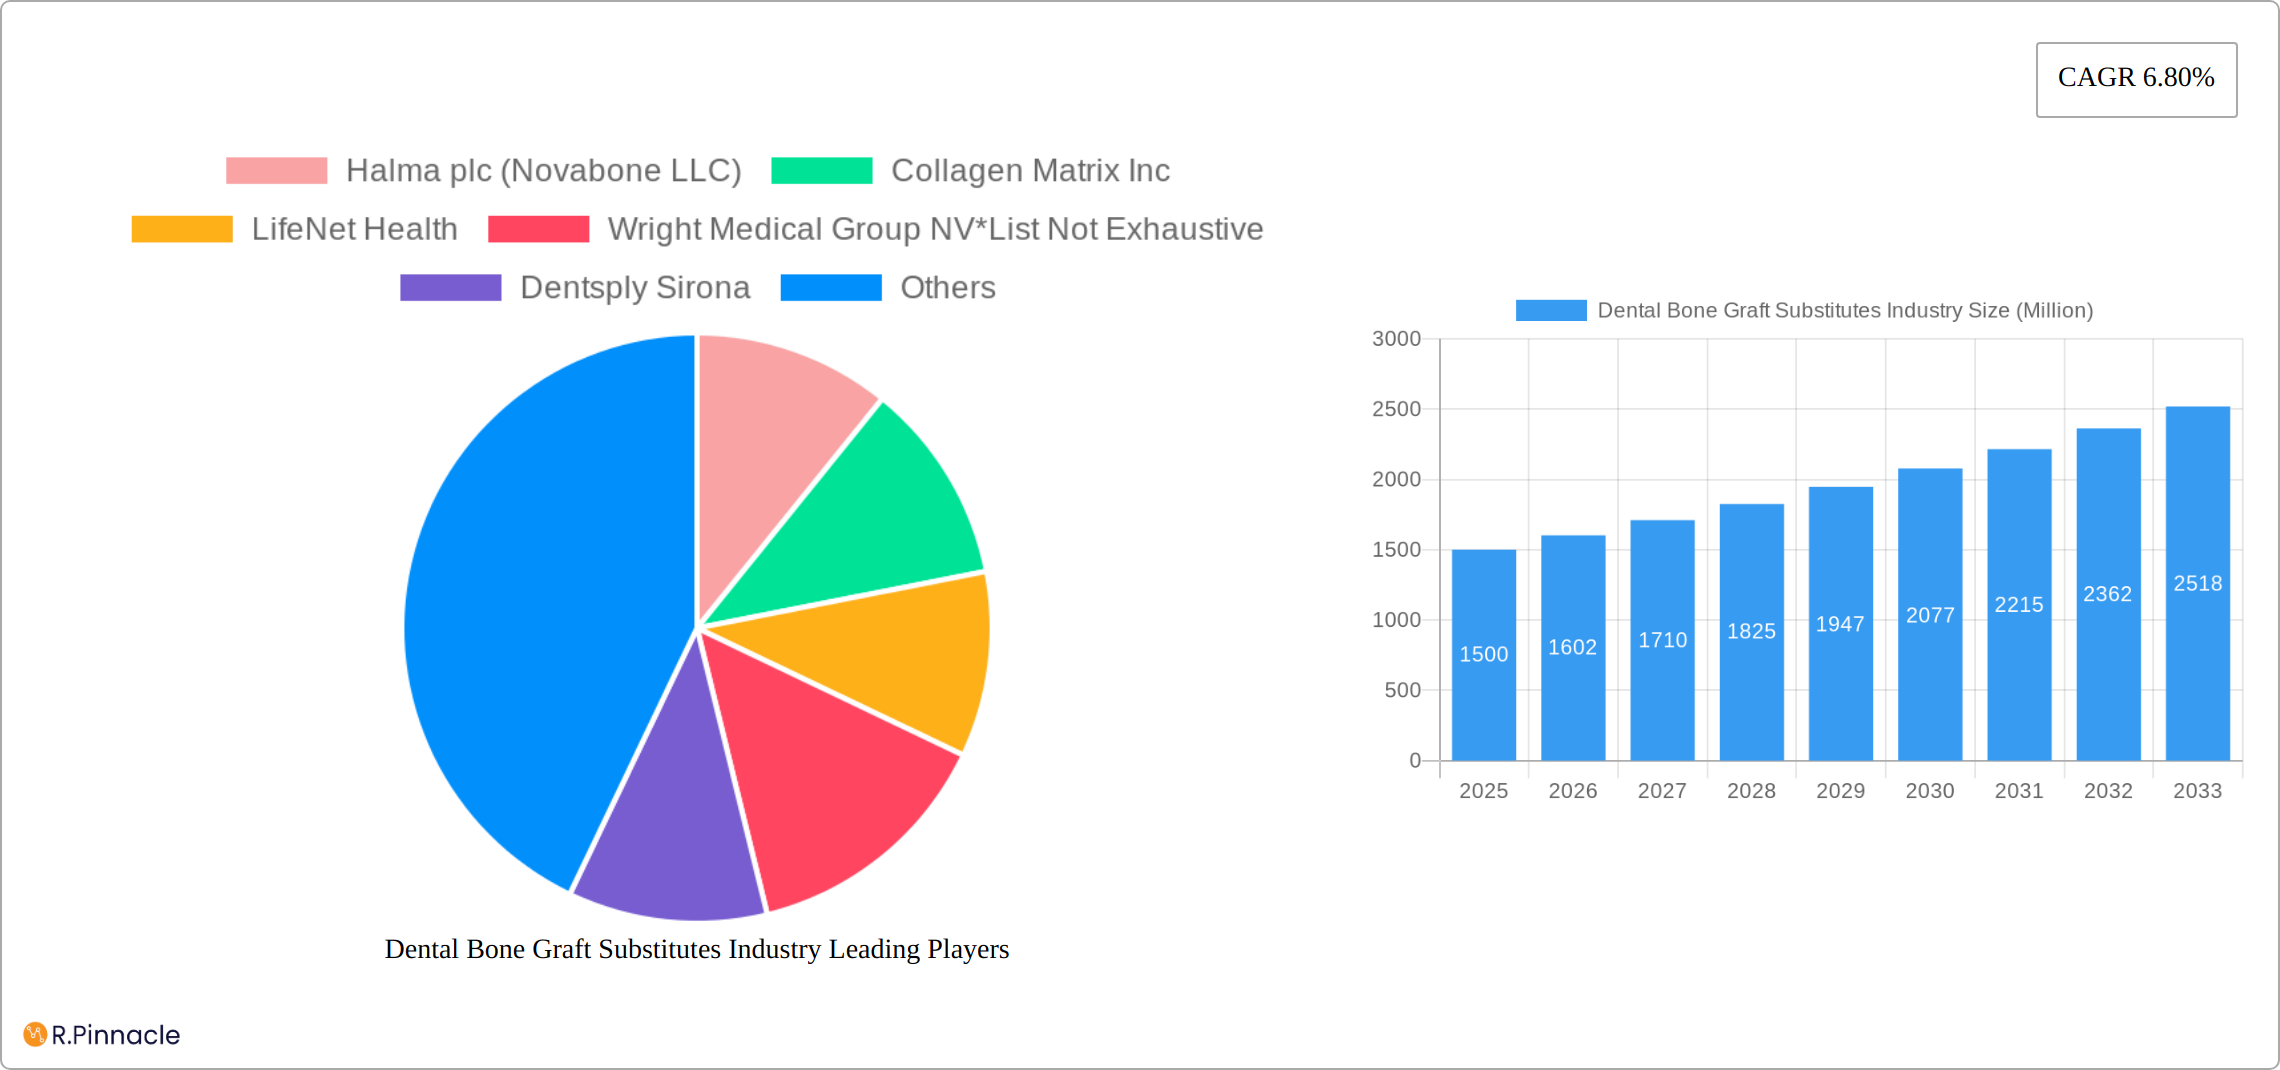
The global dental bone graft substitutes market presents a moderately consolidated structure, with several key players commanding significant market share. Leading companies such as Halma plc (Novabone LLC), Collagen Matrix Inc, LifeNet Health, Wright Medical Group NV, Dentsply Sirona, Dentium, Medtronic PLC, Johnson & Johnson, ZIMMER BIOMET, Institut Straumann AG, Botiss biomaterials GmbH, and Geistlich Pharma are at the forefront, driving innovation and shaping the competitive landscape. While precise 2024 market share data remains proprietary, it's estimated that the top five players control a substantial portion (approximately [Insert Percentage]% - replace with actual data if available) of the total market. The remaining share is dispersed amongst numerous smaller companies and regional players, creating a dynamic and competitive environment.
- Innovation Drivers: The market's robust growth is fueled by continuous advancements in biomaterials science. This progress translates into the development of bone graft substitutes exhibiting superior biocompatibility, osteoconductivity, and osteoinductivity. Further driving market expansion are improvements in material miniaturization and enhanced handling characteristics, making procedures more efficient and less invasive.
- Regulatory Frameworks and Compliance: Stringent regulatory approvals and robust quality control measures significantly influence market dynamics. Adherence to international standards and guidelines, such as those set by [mention relevant regulatory bodies e.g., FDA, etc.], is paramount for market entry and sustained success. This regulatory scrutiny ensures patient safety and maintains high product quality standards.
- Mergers & Acquisitions (M&A) Activity: Strategic mergers and acquisitions have played a notable role in shaping the industry landscape. Recent years have witnessed a moderate but impactful level of M&A activity, with deal values averaging [Insert Average Deal Value - replace with actual data if available] million dollars. These transactions are driven primarily by strategic expansion goals and the acquisition of cutting-edge technologies. Such activities consolidate market share, introduce new product lines, and foster innovation through the integration of diverse expertise.
- Competitive Landscape & Autograft Alternatives: Autografts remain a significant competitor, leveraging the body's natural healing processes. However, the inherent advantages of bone graft substitutes, such as increased convenience, reduced invasiveness, and minimized donor site morbidity, are powerful drivers of market expansion and adoption.
Dental Bone Graft Substitutes Industry Market Dynamics & Trends
The dental bone graft substitutes market is experiencing robust growth, driven by factors like the increasing prevalence of periodontal diseases, rising demand for dental implants, and an aging global population requiring more restorative dental procedures. The market is projected to register a CAGR of xx% during the forecast period (2025-2033). This growth is further fueled by technological advancements in biomaterial science resulting in improved biocompatibility, osteointegration, and handling properties of the grafts. Consumer preferences are shifting towards minimally invasive procedures and faster healing times, leading to increased adoption of advanced substitutes. The competitive landscape is intensely competitive, with key players focusing on product innovation, strategic partnerships, and geographical expansion. Market penetration in developing economies remains relatively low, representing significant growth potential.

Dominant Regions & Segments in Dental Bone Graft Substitutes Industry
Leading Region: North America currently dominates the market, driven by high healthcare expenditure, advanced dental infrastructure, and a high prevalence of dental diseases. Europe follows closely, exhibiting substantial market growth. The Asia-Pacific region is expected to experience the fastest growth during the forecast period, fueled by rising disposable incomes and increased awareness of dental health.
Dominant Segments:
- By Mechanism: Osteoconduction is the currently dominant mechanism segment due to its established efficacy and wide availability. However, osteoinduction and osteogenesis are witnessing increasing adoption due to their enhanced bone regeneration capabilities.
- By End-User: Hospitals and dental clinics account for the largest proportion of the market share, owing to the specialized equipment and skilled professionals required for performing grafting procedures.
- By Type: Allografts hold a significant market share due to their established clinical track record and availability. Xenografts are witnessing increasing adoption due to improvements in biocompatibility and efficacy.
Key Drivers by Region:
- North America: High healthcare spending, strong regulatory frameworks, and a well-established dental infrastructure.
- Europe: Increasing prevalence of dental diseases, aging population, and growing awareness of advanced dental treatments.
- Asia-Pacific: Rising disposable incomes, increasing dental tourism, and government initiatives promoting healthcare infrastructure.
Dental Bone Graft Substitutes Industry Product Innovations
Recent product developments focus on improving biocompatibility, handling characteristics, and bone regeneration efficacy. New generation bone graft substitutes are incorporating advanced materials and technologies, such as nanotechnology and growth factors, to enhance osteointegration and accelerate bone formation. These innovations provide competitive advantages by offering superior clinical outcomes and reduced treatment times, catering to the growing demand for minimally invasive and efficient dental procedures. The market is seeing the introduction of customized grafts tailored to individual patient needs, leveraging advanced imaging and 3D printing technologies.
Report Scope & Segmentation Analysis
This report provides a detailed segmentation of the dental bone graft substitutes market based on mechanism, end-user, and type. Each segment is analyzed with respect to market size, growth projections, and competitive dynamics.
- By Mechanism: Osteoconduction, Osteoinduction, Osteogenesis, and Osteopromotion segments are analyzed individually, with growth projections based on technological advancements and clinical applications.
- By End-User: Hospitals, dental clinics, and other end-users (e.g., research institutions) are profiled, considering their specific requirements and market share.
- By Type: Xenograft, Allograft, Autograft, and other types (e.g., synthetic substitutes) are evaluated, considering their biocompatibility, cost-effectiveness, and clinical efficacy.
Key Drivers of Dental Bone Graft Substitutes Industry Growth
Several factors contribute to the growth of the dental bone graft substitutes market. The rising prevalence of periodontal disease and tooth loss globally is a primary driver. The increasing demand for dental implants, fueled by advancements in implant technology and improved patient outcomes, significantly boosts market growth. Furthermore, technological advancements leading to improved biocompatibility, handling properties, and bone regeneration capabilities of substitutes contribute to market expansion.
Challenges in the Dental Bone Graft Substitutes Industry Sector
The dental bone graft substitutes market faces challenges, including stringent regulatory requirements for approval and high costs associated with product development and manufacturing. The availability of substitutes and the potential for complications related to material degradation and infection pose obstacles to market growth. Competition from autografts and the varying efficacy across different types of substitutes also present challenges. These factors lead to fluctuations in pricing and availability, hindering market expansion.
Emerging Opportunities in Dental Bone Graft Substitutes Industry
Significant opportunities exist in developing economies with rising populations and increasing demand for affordable dental care. The development of novel biomaterials with enhanced bioactivity and improved osseointegration potential presents a substantial opportunity for market growth. Furthermore, the integration of digital technologies, such as 3D printing and AI-driven diagnostics, offers potential for improved product design and personalized treatment plans, opening new avenues for market expansion.
Leading Players in the Dental Bone Graft Substitutes Industry Market
- Halma plc (Novabone LLC)
- Collagen Matrix Inc
- LifeNet Health
- Wright Medical Group NV
- Dentsply Sirona
- Dentium
- Medtronic PLC
- Johnson & Johnson
- ZIMMER BIOMET
- Institut Straumann AG
- Botiss biomaterials GmbH
- Geistlich Pharm
Key Developments in Dental Bone Graft Substitutes Industry Industry
- March 2022: Biocomposites signed an agreement with Zimmer Biomet to distribute the new Genex Bone Graft Substitute, a biphasic composite designed for optimal bone remodeling. This partnership significantly expands the reach and market penetration of the Genex product.
- March 2022: CGbio signed a five-year contract with Kerunxi Medical for the export of Bongros Dental, a bone graft material. This deal showcases expansion into new geographical markets and represents a significant growth opportunity for CGbio.
Future Outlook for Dental Bone Graft Substitutes Industry Market
The dental bone graft substitutes market is poised for sustained growth, driven by a confluence of factors. Technological advancements, increasing awareness of dental health, and the rising prevalence of periodontal diseases contribute to expanding market opportunities. The market is expected to witness continued innovation in biomaterials and treatment techniques, leading to improved patient outcomes and increased adoption of substitutes. Strategic partnerships, geographical expansion, and focus on personalized medicine will further shape the industry's future trajectory.
Dental Bone Graft Substitutes Industry Segmentation
-
1. Type
- 1.1. Xenograft
- 1.2. Allograft
- 1.3. Autograft
- 1.4. Other Types
-
2. Mechanism
- 2.1. Osteoconduction
- 2.2. Osteoinduction
- 2.3. Osteogenesis
- 2.4. Osteopromotion
-
3. End Users
- 3.1. Hospitals
- 3.2. Dental Clinics
- 3.3. Other End Users
Dental Bone Graft Substitutes Industry Segmentation By Geography
-
1. North America
- 1.1. United States
- 1.2. Canada
- 1.3. Mexico
-
2. Europe
- 2.1. Germany
- 2.2. United Kingdom
- 2.3. France
- 2.4. Italy
- 2.5. Spain
- 2.6. Rest of Europe
-
3. Asia Pacific
- 3.1. China
- 3.2. Japan
- 3.3. India
- 3.4. Australia
- 3.5. South Korea
- 3.6. Rest of Asia Pacific
-
4. Middle East and Africa
- 4.1. GCC
- 4.2. South Africa
- 4.3. Rest of Middle East and Africa
-
5. South America
- 5.1. Brazil
- 5.2. Argentina
- 5.3. Rest of South America

Dental Bone Graft Substitutes Industry REPORT HIGHLIGHTS
| Aspects | Details |
|---|---|
| Study Period | 2019-2033 |
| Base Year | 2024 |
| Estimated Year | 2025 |
| Forecast Period | 2025-2033 |
| Historical Period | 2019-2024 |
| Growth Rate | CAGR of 6.80% from 2019-2033 |
| Segmentation |
|
Table of Contents
- 1. Introduction
- 1.1. Research Scope
- 1.2. Market Segmentation
- 1.3. Research Methodology
- 1.4. Definitions and Assumptions
- 2. Executive Summary
- 2.1. Introduction
- 3. Market Dynamics
- 3.1. Introduction
- 3.2. Market Drivers
- 3.2.1. Rising Demand of Medical and Dental Tourism; Rising Burden of Dental Diseases; Technological Advancements
- 3.3. Market Restrains
- 3.3.1. Expensive Dental Procedures; Reimbursement Issues
- 3.4. Market Trends
- 3.4.1. The Xenogaft Segment is Expected to Grow Over the Forecast Period
- 4. Market Factor Analysis
- 4.1. Porters Five Forces
- 4.2. Supply/Value Chain
- 4.3. PESTEL analysis
- 4.4. Market Entropy
- 4.5. Patent/Trademark Analysis
- 5. Global Dental Bone Graft Substitutes Industry Analysis, Insights and Forecast, 2019-2031
- 5.1. Market Analysis, Insights and Forecast - by Type
- 5.1.1. Xenograft
- 5.1.2. Allograft
- 5.1.3. Autograft
- 5.1.4. Other Types
- 5.2. Market Analysis, Insights and Forecast - by Mechanism
- 5.2.1. Osteoconduction
- 5.2.2. Osteoinduction
- 5.2.3. Osteogenesis
- 5.2.4. Osteopromotion
- 5.3. Market Analysis, Insights and Forecast - by End Users
- 5.3.1. Hospitals
- 5.3.2. Dental Clinics
- 5.3.3. Other End Users
- 5.4. Market Analysis, Insights and Forecast - by Region
- 5.4.1. North America
- 5.4.2. Europe
- 5.4.3. Asia Pacific
- 5.4.4. Middle East and Africa
- 5.4.5. South America
- 5.1. Market Analysis, Insights and Forecast - by Type
- 6. North America Dental Bone Graft Substitutes Industry Analysis, Insights and Forecast, 2019-2031
- 6.1. Market Analysis, Insights and Forecast - by Type
- 6.1.1. Xenograft
- 6.1.2. Allograft
- 6.1.3. Autograft
- 6.1.4. Other Types
- 6.2. Market Analysis, Insights and Forecast - by Mechanism
- 6.2.1. Osteoconduction
- 6.2.2. Osteoinduction
- 6.2.3. Osteogenesis
- 6.2.4. Osteopromotion
- 6.3. Market Analysis, Insights and Forecast - by End Users
- 6.3.1. Hospitals
- 6.3.2. Dental Clinics
- 6.3.3. Other End Users
- 6.1. Market Analysis, Insights and Forecast - by Type
- 7. Europe Dental Bone Graft Substitutes Industry Analysis, Insights and Forecast, 2019-2031
- 7.1. Market Analysis, Insights and Forecast - by Type
- 7.1.1. Xenograft
- 7.1.2. Allograft
- 7.1.3. Autograft
- 7.1.4. Other Types
- 7.2. Market Analysis, Insights and Forecast - by Mechanism
- 7.2.1. Osteoconduction
- 7.2.2. Osteoinduction
- 7.2.3. Osteogenesis
- 7.2.4. Osteopromotion
- 7.3. Market Analysis, Insights and Forecast - by End Users
- 7.3.1. Hospitals
- 7.3.2. Dental Clinics
- 7.3.3. Other End Users
- 7.1. Market Analysis, Insights and Forecast - by Type
- 8. Asia Pacific Dental Bone Graft Substitutes Industry Analysis, Insights and Forecast, 2019-2031
- 8.1. Market Analysis, Insights and Forecast - by Type
- 8.1.1. Xenograft
- 8.1.2. Allograft
- 8.1.3. Autograft
- 8.1.4. Other Types
- 8.2. Market Analysis, Insights and Forecast - by Mechanism
- 8.2.1. Osteoconduction
- 8.2.2. Osteoinduction
- 8.2.3. Osteogenesis
- 8.2.4. Osteopromotion
- 8.3. Market Analysis, Insights and Forecast - by End Users
- 8.3.1. Hospitals
- 8.3.2. Dental Clinics
- 8.3.3. Other End Users
- 8.1. Market Analysis, Insights and Forecast - by Type
- 9. Middle East and Africa Dental Bone Graft Substitutes Industry Analysis, Insights and Forecast, 2019-2031
- 9.1. Market Analysis, Insights and Forecast - by Type
- 9.1.1. Xenograft
- 9.1.2. Allograft
- 9.1.3. Autograft
- 9.1.4. Other Types
- 9.2. Market Analysis, Insights and Forecast - by Mechanism
- 9.2.1. Osteoconduction
- 9.2.2. Osteoinduction
- 9.2.3. Osteogenesis
- 9.2.4. Osteopromotion
- 9.3. Market Analysis, Insights and Forecast - by End Users
- 9.3.1. Hospitals
- 9.3.2. Dental Clinics
- 9.3.3. Other End Users
- 9.1. Market Analysis, Insights and Forecast - by Type
- 10. South America Dental Bone Graft Substitutes Industry Analysis, Insights and Forecast, 2019-2031
- 10.1. Market Analysis, Insights and Forecast - by Type
- 10.1.1. Xenograft
- 10.1.2. Allograft
- 10.1.3. Autograft
- 10.1.4. Other Types
- 10.2. Market Analysis, Insights and Forecast - by Mechanism
- 10.2.1. Osteoconduction
- 10.2.2. Osteoinduction
- 10.2.3. Osteogenesis
- 10.2.4. Osteopromotion
- 10.3. Market Analysis, Insights and Forecast - by End Users
- 10.3.1. Hospitals
- 10.3.2. Dental Clinics
- 10.3.3. Other End Users
- 10.1. Market Analysis, Insights and Forecast - by Type
- 11. North America Dental Bone Graft Substitutes Industry Analysis, Insights and Forecast, 2019-2031
- 11.1. Market Analysis, Insights and Forecast - By Country/Sub-region
- 11.1.1 United States
- 11.1.2 Canada
- 11.1.3 Mexico
- 12. Europe Dental Bone Graft Substitutes Industry Analysis, Insights and Forecast, 2019-2031
- 12.1. Market Analysis, Insights and Forecast - By Country/Sub-region
- 12.1.1 Germany
- 12.1.2 United Kingdom
- 12.1.3 France
- 12.1.4 Italy
- 12.1.5 Spain
- 12.1.6 Rest of Europe
- 13. Asia Pacific Dental Bone Graft Substitutes Industry Analysis, Insights and Forecast, 2019-2031
- 13.1. Market Analysis, Insights and Forecast - By Country/Sub-region
- 13.1.1 China
- 13.1.2 Japan
- 13.1.3 India
- 13.1.4 Australia
- 13.1.5 South Korea
- 13.1.6 Rest of Asia Pacific
- 14. Middle East and Africa Dental Bone Graft Substitutes Industry Analysis, Insights and Forecast, 2019-2031
- 14.1. Market Analysis, Insights and Forecast - By Country/Sub-region
- 14.1.1 GCC
- 14.1.2 South Africa
- 14.1.3 Rest of Middle East and Africa
- 15. South America Dental Bone Graft Substitutes Industry Analysis, Insights and Forecast, 2019-2031
- 15.1. Market Analysis, Insights and Forecast - By Country/Sub-region
- 15.1.1 Brazil
- 15.1.2 Argentina
- 15.1.3 Rest of South America
- 16. Competitive Analysis
- 16.1. Global Market Share Analysis 2024
- 16.2. Company Profiles
- 16.2.1 Halma plc (Novabone LLC)
- 16.2.1.1. Overview
- 16.2.1.2. Products
- 16.2.1.3. SWOT Analysis
- 16.2.1.4. Recent Developments
- 16.2.1.5. Financials (Based on Availability)
- 16.2.2 Collagen Matrix Inc
- 16.2.2.1. Overview
- 16.2.2.2. Products
- 16.2.2.3. SWOT Analysis
- 16.2.2.4. Recent Developments
- 16.2.2.5. Financials (Based on Availability)
- 16.2.3 LifeNet Health
- 16.2.3.1. Overview
- 16.2.3.2. Products
- 16.2.3.3. SWOT Analysis
- 16.2.3.4. Recent Developments
- 16.2.3.5. Financials (Based on Availability)
- 16.2.4 Wright Medical Group NV*List Not Exhaustive
- 16.2.4.1. Overview
- 16.2.4.2. Products
- 16.2.4.3. SWOT Analysis
- 16.2.4.4. Recent Developments
- 16.2.4.5. Financials (Based on Availability)
- 16.2.5 Dentsply Sirona
- 16.2.5.1. Overview
- 16.2.5.2. Products
- 16.2.5.3. SWOT Analysis
- 16.2.5.4. Recent Developments
- 16.2.5.5. Financials (Based on Availability)
- 16.2.6 Dentium
- 16.2.6.1. Overview
- 16.2.6.2. Products
- 16.2.6.3. SWOT Analysis
- 16.2.6.4. Recent Developments
- 16.2.6.5. Financials (Based on Availability)
- 16.2.7 Medtronic PLC
- 16.2.7.1. Overview
- 16.2.7.2. Products
- 16.2.7.3. SWOT Analysis
- 16.2.7.4. Recent Developments
- 16.2.7.5. Financials (Based on Availability)
- 16.2.8 Johnson & Johnson
- 16.2.8.1. Overview
- 16.2.8.2. Products
- 16.2.8.3. SWOT Analysis
- 16.2.8.4. Recent Developments
- 16.2.8.5. Financials (Based on Availability)
- 16.2.9 ZIMMER BIOMET
- 16.2.9.1. Overview
- 16.2.9.2. Products
- 16.2.9.3. SWOT Analysis
- 16.2.9.4. Recent Developments
- 16.2.9.5. Financials (Based on Availability)
- 16.2.10 Institut Straumann AG
- 16.2.10.1. Overview
- 16.2.10.2. Products
- 16.2.10.3. SWOT Analysis
- 16.2.10.4. Recent Developments
- 16.2.10.5. Financials (Based on Availability)
- 16.2.11 Botiss biomaterials GmbH
- 16.2.11.1. Overview
- 16.2.11.2. Products
- 16.2.11.3. SWOT Analysis
- 16.2.11.4. Recent Developments
- 16.2.11.5. Financials (Based on Availability)
- 16.2.12 Geistlich Pharm
- 16.2.12.1. Overview
- 16.2.12.2. Products
- 16.2.12.3. SWOT Analysis
- 16.2.12.4. Recent Developments
- 16.2.12.5. Financials (Based on Availability)
- 16.2.1 Halma plc (Novabone LLC)
List of Figures
- Figure 1: Global Dental Bone Graft Substitutes Industry Revenue Breakdown (Million, %) by Region 2024 & 2032
- Figure 2: North America Dental Bone Graft Substitutes Industry Revenue (Million), by Country 2024 & 2032
- Figure 3: North America Dental Bone Graft Substitutes Industry Revenue Share (%), by Country 2024 & 2032
- Figure 4: Europe Dental Bone Graft Substitutes Industry Revenue (Million), by Country 2024 & 2032
- Figure 5: Europe Dental Bone Graft Substitutes Industry Revenue Share (%), by Country 2024 & 2032
- Figure 6: Asia Pacific Dental Bone Graft Substitutes Industry Revenue (Million), by Country 2024 & 2032
- Figure 7: Asia Pacific Dental Bone Graft Substitutes Industry Revenue Share (%), by Country 2024 & 2032
- Figure 8: Middle East and Africa Dental Bone Graft Substitutes Industry Revenue (Million), by Country 2024 & 2032
- Figure 9: Middle East and Africa Dental Bone Graft Substitutes Industry Revenue Share (%), by Country 2024 & 2032
- Figure 10: South America Dental Bone Graft Substitutes Industry Revenue (Million), by Country 2024 & 2032
- Figure 11: South America Dental Bone Graft Substitutes Industry Revenue Share (%), by Country 2024 & 2032
- Figure 12: North America Dental Bone Graft Substitutes Industry Revenue (Million), by Type 2024 & 2032
- Figure 13: North America Dental Bone Graft Substitutes Industry Revenue Share (%), by Type 2024 & 2032
- Figure 14: North America Dental Bone Graft Substitutes Industry Revenue (Million), by Mechanism 2024 & 2032
- Figure 15: North America Dental Bone Graft Substitutes Industry Revenue Share (%), by Mechanism 2024 & 2032
- Figure 16: North America Dental Bone Graft Substitutes Industry Revenue (Million), by End Users 2024 & 2032
- Figure 17: North America Dental Bone Graft Substitutes Industry Revenue Share (%), by End Users 2024 & 2032
- Figure 18: North America Dental Bone Graft Substitutes Industry Revenue (Million), by Country 2024 & 2032
- Figure 19: North America Dental Bone Graft Substitutes Industry Revenue Share (%), by Country 2024 & 2032
- Figure 20: Europe Dental Bone Graft Substitutes Industry Revenue (Million), by Type 2024 & 2032
- Figure 21: Europe Dental Bone Graft Substitutes Industry Revenue Share (%), by Type 2024 & 2032
- Figure 22: Europe Dental Bone Graft Substitutes Industry Revenue (Million), by Mechanism 2024 & 2032
- Figure 23: Europe Dental Bone Graft Substitutes Industry Revenue Share (%), by Mechanism 2024 & 2032
- Figure 24: Europe Dental Bone Graft Substitutes Industry Revenue (Million), by End Users 2024 & 2032
- Figure 25: Europe Dental Bone Graft Substitutes Industry Revenue Share (%), by End Users 2024 & 2032
- Figure 26: Europe Dental Bone Graft Substitutes Industry Revenue (Million), by Country 2024 & 2032
- Figure 27: Europe Dental Bone Graft Substitutes Industry Revenue Share (%), by Country 2024 & 2032
- Figure 28: Asia Pacific Dental Bone Graft Substitutes Industry Revenue (Million), by Type 2024 & 2032
- Figure 29: Asia Pacific Dental Bone Graft Substitutes Industry Revenue Share (%), by Type 2024 & 2032
- Figure 30: Asia Pacific Dental Bone Graft Substitutes Industry Revenue (Million), by Mechanism 2024 & 2032
- Figure 31: Asia Pacific Dental Bone Graft Substitutes Industry Revenue Share (%), by Mechanism 2024 & 2032
- Figure 32: Asia Pacific Dental Bone Graft Substitutes Industry Revenue (Million), by End Users 2024 & 2032
- Figure 33: Asia Pacific Dental Bone Graft Substitutes Industry Revenue Share (%), by End Users 2024 & 2032
- Figure 34: Asia Pacific Dental Bone Graft Substitutes Industry Revenue (Million), by Country 2024 & 2032
- Figure 35: Asia Pacific Dental Bone Graft Substitutes Industry Revenue Share (%), by Country 2024 & 2032
- Figure 36: Middle East and Africa Dental Bone Graft Substitutes Industry Revenue (Million), by Type 2024 & 2032
- Figure 37: Middle East and Africa Dental Bone Graft Substitutes Industry Revenue Share (%), by Type 2024 & 2032
- Figure 38: Middle East and Africa Dental Bone Graft Substitutes Industry Revenue (Million), by Mechanism 2024 & 2032
- Figure 39: Middle East and Africa Dental Bone Graft Substitutes Industry Revenue Share (%), by Mechanism 2024 & 2032
- Figure 40: Middle East and Africa Dental Bone Graft Substitutes Industry Revenue (Million), by End Users 2024 & 2032
- Figure 41: Middle East and Africa Dental Bone Graft Substitutes Industry Revenue Share (%), by End Users 2024 & 2032
- Figure 42: Middle East and Africa Dental Bone Graft Substitutes Industry Revenue (Million), by Country 2024 & 2032
- Figure 43: Middle East and Africa Dental Bone Graft Substitutes Industry Revenue Share (%), by Country 2024 & 2032
- Figure 44: South America Dental Bone Graft Substitutes Industry Revenue (Million), by Type 2024 & 2032
- Figure 45: South America Dental Bone Graft Substitutes Industry Revenue Share (%), by Type 2024 & 2032
- Figure 46: South America Dental Bone Graft Substitutes Industry Revenue (Million), by Mechanism 2024 & 2032
- Figure 47: South America Dental Bone Graft Substitutes Industry Revenue Share (%), by Mechanism 2024 & 2032
- Figure 48: South America Dental Bone Graft Substitutes Industry Revenue (Million), by End Users 2024 & 2032
- Figure 49: South America Dental Bone Graft Substitutes Industry Revenue Share (%), by End Users 2024 & 2032
- Figure 50: South America Dental Bone Graft Substitutes Industry Revenue (Million), by Country 2024 & 2032
- Figure 51: South America Dental Bone Graft Substitutes Industry Revenue Share (%), by Country 2024 & 2032
List of Tables
- Table 1: Global Dental Bone Graft Substitutes Industry Revenue Million Forecast, by Region 2019 & 2032
- Table 2: Global Dental Bone Graft Substitutes Industry Revenue Million Forecast, by Type 2019 & 2032
- Table 3: Global Dental Bone Graft Substitutes Industry Revenue Million Forecast, by Mechanism 2019 & 2032
- Table 4: Global Dental Bone Graft Substitutes Industry Revenue Million Forecast, by End Users 2019 & 2032
- Table 5: Global Dental Bone Graft Substitutes Industry Revenue Million Forecast, by Region 2019 & 2032
- Table 6: Global Dental Bone Graft Substitutes Industry Revenue Million Forecast, by Country 2019 & 2032
- Table 7: United States Dental Bone Graft Substitutes Industry Revenue (Million) Forecast, by Application 2019 & 2032
- Table 8: Canada Dental Bone Graft Substitutes Industry Revenue (Million) Forecast, by Application 2019 & 2032
- Table 9: Mexico Dental Bone Graft Substitutes Industry Revenue (Million) Forecast, by Application 2019 & 2032
- Table 10: Global Dental Bone Graft Substitutes Industry Revenue Million Forecast, by Country 2019 & 2032
- Table 11: Germany Dental Bone Graft Substitutes Industry Revenue (Million) Forecast, by Application 2019 & 2032
- Table 12: United Kingdom Dental Bone Graft Substitutes Industry Revenue (Million) Forecast, by Application 2019 & 2032
- Table 13: France Dental Bone Graft Substitutes Industry Revenue (Million) Forecast, by Application 2019 & 2032
- Table 14: Italy Dental Bone Graft Substitutes Industry Revenue (Million) Forecast, by Application 2019 & 2032
- Table 15: Spain Dental Bone Graft Substitutes Industry Revenue (Million) Forecast, by Application 2019 & 2032
- Table 16: Rest of Europe Dental Bone Graft Substitutes Industry Revenue (Million) Forecast, by Application 2019 & 2032
- Table 17: Global Dental Bone Graft Substitutes Industry Revenue Million Forecast, by Country 2019 & 2032
- Table 18: China Dental Bone Graft Substitutes Industry Revenue (Million) Forecast, by Application 2019 & 2032
- Table 19: Japan Dental Bone Graft Substitutes Industry Revenue (Million) Forecast, by Application 2019 & 2032
- Table 20: India Dental Bone Graft Substitutes Industry Revenue (Million) Forecast, by Application 2019 & 2032
- Table 21: Australia Dental Bone Graft Substitutes Industry Revenue (Million) Forecast, by Application 2019 & 2032
- Table 22: South Korea Dental Bone Graft Substitutes Industry Revenue (Million) Forecast, by Application 2019 & 2032
- Table 23: Rest of Asia Pacific Dental Bone Graft Substitutes Industry Revenue (Million) Forecast, by Application 2019 & 2032
- Table 24: Global Dental Bone Graft Substitutes Industry Revenue Million Forecast, by Country 2019 & 2032
- Table 25: GCC Dental Bone Graft Substitutes Industry Revenue (Million) Forecast, by Application 2019 & 2032
- Table 26: South Africa Dental Bone Graft Substitutes Industry Revenue (Million) Forecast, by Application 2019 & 2032
- Table 27: Rest of Middle East and Africa Dental Bone Graft Substitutes Industry Revenue (Million) Forecast, by Application 2019 & 2032
- Table 28: Global Dental Bone Graft Substitutes Industry Revenue Million Forecast, by Country 2019 & 2032
- Table 29: Brazil Dental Bone Graft Substitutes Industry Revenue (Million) Forecast, by Application 2019 & 2032
- Table 30: Argentina Dental Bone Graft Substitutes Industry Revenue (Million) Forecast, by Application 2019 & 2032
- Table 31: Rest of South America Dental Bone Graft Substitutes Industry Revenue (Million) Forecast, by Application 2019 & 2032
- Table 32: Global Dental Bone Graft Substitutes Industry Revenue Million Forecast, by Type 2019 & 2032
- Table 33: Global Dental Bone Graft Substitutes Industry Revenue Million Forecast, by Mechanism 2019 & 2032
- Table 34: Global Dental Bone Graft Substitutes Industry Revenue Million Forecast, by End Users 2019 & 2032
- Table 35: Global Dental Bone Graft Substitutes Industry Revenue Million Forecast, by Country 2019 & 2032
- Table 36: United States Dental Bone Graft Substitutes Industry Revenue (Million) Forecast, by Application 2019 & 2032
- Table 37: Canada Dental Bone Graft Substitutes Industry Revenue (Million) Forecast, by Application 2019 & 2032
- Table 38: Mexico Dental Bone Graft Substitutes Industry Revenue (Million) Forecast, by Application 2019 & 2032
- Table 39: Global Dental Bone Graft Substitutes Industry Revenue Million Forecast, by Type 2019 & 2032
- Table 40: Global Dental Bone Graft Substitutes Industry Revenue Million Forecast, by Mechanism 2019 & 2032
- Table 41: Global Dental Bone Graft Substitutes Industry Revenue Million Forecast, by End Users 2019 & 2032
- Table 42: Global Dental Bone Graft Substitutes Industry Revenue Million Forecast, by Country 2019 & 2032
- Table 43: Germany Dental Bone Graft Substitutes Industry Revenue (Million) Forecast, by Application 2019 & 2032
- Table 44: United Kingdom Dental Bone Graft Substitutes Industry Revenue (Million) Forecast, by Application 2019 & 2032
- Table 45: France Dental Bone Graft Substitutes Industry Revenue (Million) Forecast, by Application 2019 & 2032
- Table 46: Italy Dental Bone Graft Substitutes Industry Revenue (Million) Forecast, by Application 2019 & 2032
- Table 47: Spain Dental Bone Graft Substitutes Industry Revenue (Million) Forecast, by Application 2019 & 2032
- Table 48: Rest of Europe Dental Bone Graft Substitutes Industry Revenue (Million) Forecast, by Application 2019 & 2032
- Table 49: Global Dental Bone Graft Substitutes Industry Revenue Million Forecast, by Type 2019 & 2032
- Table 50: Global Dental Bone Graft Substitutes Industry Revenue Million Forecast, by Mechanism 2019 & 2032
- Table 51: Global Dental Bone Graft Substitutes Industry Revenue Million Forecast, by End Users 2019 & 2032
- Table 52: Global Dental Bone Graft Substitutes Industry Revenue Million Forecast, by Country 2019 & 2032
- Table 53: China Dental Bone Graft Substitutes Industry Revenue (Million) Forecast, by Application 2019 & 2032
- Table 54: Japan Dental Bone Graft Substitutes Industry Revenue (Million) Forecast, by Application 2019 & 2032
- Table 55: India Dental Bone Graft Substitutes Industry Revenue (Million) Forecast, by Application 2019 & 2032
- Table 56: Australia Dental Bone Graft Substitutes Industry Revenue (Million) Forecast, by Application 2019 & 2032
- Table 57: South Korea Dental Bone Graft Substitutes Industry Revenue (Million) Forecast, by Application 2019 & 2032
- Table 58: Rest of Asia Pacific Dental Bone Graft Substitutes Industry Revenue (Million) Forecast, by Application 2019 & 2032
- Table 59: Global Dental Bone Graft Substitutes Industry Revenue Million Forecast, by Type 2019 & 2032
- Table 60: Global Dental Bone Graft Substitutes Industry Revenue Million Forecast, by Mechanism 2019 & 2032
- Table 61: Global Dental Bone Graft Substitutes Industry Revenue Million Forecast, by End Users 2019 & 2032
- Table 62: Global Dental Bone Graft Substitutes Industry Revenue Million Forecast, by Country 2019 & 2032
- Table 63: GCC Dental Bone Graft Substitutes Industry Revenue (Million) Forecast, by Application 2019 & 2032
- Table 64: South Africa Dental Bone Graft Substitutes Industry Revenue (Million) Forecast, by Application 2019 & 2032
- Table 65: Rest of Middle East and Africa Dental Bone Graft Substitutes Industry Revenue (Million) Forecast, by Application 2019 & 2032
- Table 66: Global Dental Bone Graft Substitutes Industry Revenue Million Forecast, by Type 2019 & 2032
- Table 67: Global Dental Bone Graft Substitutes Industry Revenue Million Forecast, by Mechanism 2019 & 2032
- Table 68: Global Dental Bone Graft Substitutes Industry Revenue Million Forecast, by End Users 2019 & 2032
- Table 69: Global Dental Bone Graft Substitutes Industry Revenue Million Forecast, by Country 2019 & 2032
- Table 70: Brazil Dental Bone Graft Substitutes Industry Revenue (Million) Forecast, by Application 2019 & 2032
- Table 71: Argentina Dental Bone Graft Substitutes Industry Revenue (Million) Forecast, by Application 2019 & 2032
- Table 72: Rest of South America Dental Bone Graft Substitutes Industry Revenue (Million) Forecast, by Application 2019 & 2032
Frequently Asked Questions
1. What is the projected Compound Annual Growth Rate (CAGR) of the Dental Bone Graft Substitutes Industry?
The projected CAGR is approximately 6.80%.
2. Which companies are prominent players in the Dental Bone Graft Substitutes Industry?
Key companies in the market include Halma plc (Novabone LLC), Collagen Matrix Inc, LifeNet Health, Wright Medical Group NV*List Not Exhaustive, Dentsply Sirona, Dentium, Medtronic PLC, Johnson & Johnson, ZIMMER BIOMET, Institut Straumann AG, Botiss biomaterials GmbH, Geistlich Pharm.
3. What are the main segments of the Dental Bone Graft Substitutes Industry?
The market segments include Type, Mechanism, End Users.
4. Can you provide details about the market size?
The market size is estimated to be USD XX Million as of 2022.
5. What are some drivers contributing to market growth?
Rising Demand of Medical and Dental Tourism; Rising Burden of Dental Diseases; Technological Advancements.
6. What are the notable trends driving market growth?
The Xenogaft Segment is Expected to Grow Over the Forecast Period.
7. Are there any restraints impacting market growth?
Expensive Dental Procedures; Reimbursement Issues.
8. Can you provide examples of recent developments in the market?
In March 2022, Biocomposites signed an agreement with Zimmer Biomet to distribute the new genex Bone Graft Substitute. Genex Bone Graft Substitute is a biphasic composite of exceptional purity specifically formulated to balance osteoconductive scaffold strength and persistence in the body to enable the optimal remodeling of bone architecture.
9. What pricing options are available for accessing the report?
Pricing options include single-user, multi-user, and enterprise licenses priced at USD 4750, USD 5250, and USD 8750 respectively.
10. Is the market size provided in terms of value or volume?
The market size is provided in terms of value, measured in Million.
11. Are there any specific market keywords associated with the report?
Yes, the market keyword associated with the report is "Dental Bone Graft Substitutes Industry," which aids in identifying and referencing the specific market segment covered.
12. How do I determine which pricing option suits my needs best?
The pricing options vary based on user requirements and access needs. Individual users may opt for single-user licenses, while businesses requiring broader access may choose multi-user or enterprise licenses for cost-effective access to the report.
13. Are there any additional resources or data provided in the Dental Bone Graft Substitutes Industry report?
While the report offers comprehensive insights, it's advisable to review the specific contents or supplementary materials provided to ascertain if additional resources or data are available.
14. How can I stay updated on further developments or reports in the Dental Bone Graft Substitutes Industry?
To stay informed about further developments, trends, and reports in the Dental Bone Graft Substitutes Industry, consider subscribing to industry newsletters, following relevant companies and organizations, or regularly checking reputable industry news sources and publications.
Methodology
Step 1 - Identification of Relevant Samples Size from Population Database


Step 2 - Approaches for Defining Global Market Size (Value, Volume* & Price*)

Note*: In applicable scenarios
Step 3 - Data Sources
Primary Research
- Web Analytics
- Survey Reports
- Research Institute
- Latest Research Reports
- Opinion Leaders
Secondary Research
- Annual Reports
- White Paper
- Latest Press Release
- Industry Association
- Paid Database
- Investor Presentations

Step 4 - Data Triangulation
Involves using different sources of information in order to increase the validity of a study
These sources are likely to be stakeholders in a program - participants, other researchers, program staff, other community members, and so on.
Then we put all data in single framework & apply various statistical tools to find out the dynamic on the market.
During the analysis stage, feedback from the stakeholder groups would be compared to determine areas of agreement as well as areas of divergence


