
Key Insights
The global dental CAM milling machine market is experiencing robust growth, driven by the increasing demand for precise and efficient dental restorations. The market's expansion is fueled by several key factors. Technological advancements in CAD/CAM software and milling machines are leading to faster production times, improved accuracy, and reduced material waste. The rising prevalence of dental procedures, coupled with the growing adoption of digital dentistry workflows, is significantly boosting market demand. Furthermore, the increasing preference for aesthetically pleasing and durable restorations is driving the adoption of these machines across dental laboratories and clinics. The market is segmented by machine type (in-lab vs. in-office), size (tabletop, bench-top, standalone), and technology (copying vs. CAD/CAM milling). In-office milling machines are gaining traction due to their convenience and reduced turnaround times, offering immediate restorations to patients. CAD/CAM milling is the dominant technology, owing to its superior precision and design flexibility. Geographic analysis reveals strong growth in North America and Europe, driven by high adoption rates and established dental infrastructure. However, the Asia-Pacific region is expected to witness significant growth in the coming years due to rising disposable incomes and increasing awareness of advanced dental treatments. Competition is intense, with key players like Zimmer Biomet, 3M, Dentsply Sirona, and others constantly innovating to maintain market share. While high initial investment costs can pose a restraint, the long-term cost savings and improved efficiency are driving market adoption. The overall market is poised for sustained growth throughout the forecast period, projected to reach a substantial valuation by 2033.
The market is expected to continue its upward trajectory, propelled by several factors. The integration of artificial intelligence and machine learning in CAD/CAM systems promises even greater precision and automation. Furthermore, the development of new biocompatible materials compatible with these milling machines will further expand the applications and market reach. However, challenges remain, including the need for skilled technicians to operate these advanced machines and the potential for high maintenance costs. The market will likely see further consolidation as larger players acquire smaller companies, leading to a more concentrated competitive landscape. Nevertheless, the overall outlook for the dental CAM milling machine market remains positive, with continued growth driven by technological innovation, rising demand for advanced dental care, and increasing adoption in developing economies. The focus on providing efficient, cost-effective solutions, alongside continuous improvement in machine precision and user-friendliness, will be critical for market success.
Dental CAM Milling Machine Industry Market Report: 2019-2033
This comprehensive report provides an in-depth analysis of the global Dental CAM Milling Machine industry, projecting a market value exceeding $XX billion by 2033. The report covers the period 2019-2033, with a focus on the forecast period 2025-2033 and a base year of 2025. It offers actionable insights for industry professionals, investors, and stakeholders seeking to understand market dynamics, growth opportunities, and competitive landscapes within this rapidly evolving sector.
Dental CAM Milling Machine Industry Market Structure & Innovation Trends
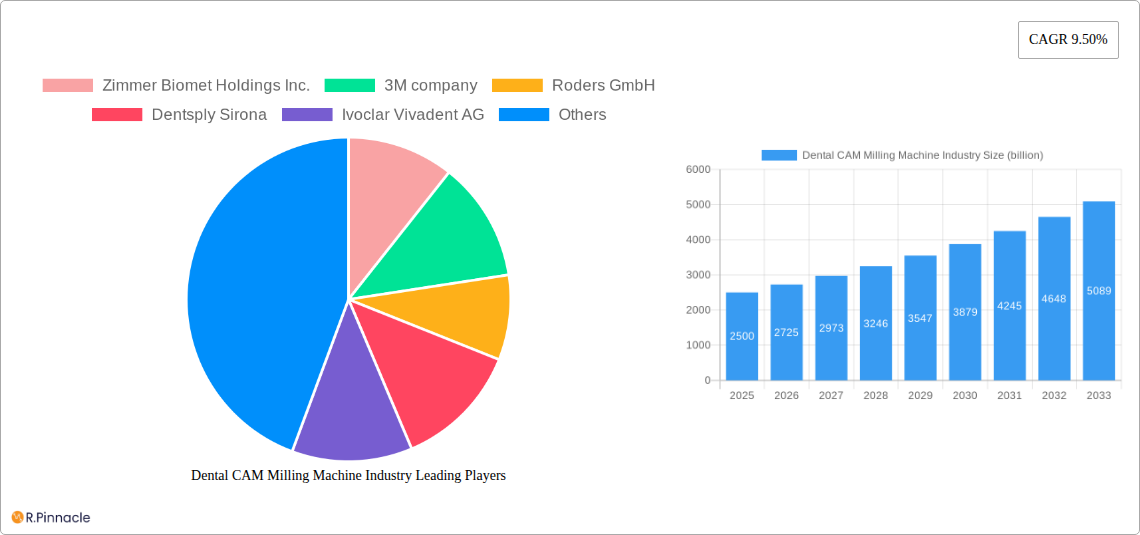
The global dental CAM milling machine market exhibits a moderately concentrated structure, with key players like Zimmer Biomet Holdings Inc., 3M Company, Dentsply Sirona, and others holding significant market share. The exact figures for market share are unavailable for this report, but estimates suggest that these players collectively account for over 50% of the global market. Innovation is driven by advancements in CAD/CAM software, material science (e.g., development of stronger and more biocompatible materials), and miniaturization of milling machines. Regulatory frameworks, such as those related to medical device approvals (e.g., FDA in the US, CE marking in Europe) significantly influence market entry and product development. Product substitutes, including traditional methods of dental restoration, present competitive pressure. The end-user demographic consists primarily of dental laboratories and dental clinics, with a growing adoption rate among general dentists. M&A activity has been significant in the past few years, with deal values in the billions driving consolidation and expansion within the industry. For instance, while specific deal values are unavailable for this report, significant acquisitions between xx to xx billion USD were observed in past years.
- Market Concentration: Moderately concentrated
- Innovation Drivers: CAD/CAM software advancements, material science, miniaturization
- Regulatory Frameworks: FDA (US), CE marking (Europe)
- Product Substitutes: Traditional dental restoration methods
- End-Users: Dental laboratories, dental clinics
- M&A Activity: Significant activity with deals valued in the billions of USD observed in the past few years.
Dental CAM Milling Machine Industry Market Dynamics & Trends
The global dental CAM milling machine market is experiencing robust growth, driven primarily by increasing demand for aesthetically pleasing and precise dental restorations. The rising prevalence of dental diseases and an aging global population are fueling this demand. Technological disruptions, such as the introduction of artificial intelligence (AI) in CAD/CAM software and the development of faster and more efficient milling machines, are further accelerating market expansion. Consumer preferences are shifting towards minimally invasive procedures and same-day restorations, boosting the adoption of in-office milling machines. The market is characterized by intense competition, with both established players and emerging companies vying for market share. The compound annual growth rate (CAGR) for the market is estimated at xx% during the forecast period (2025-2033). Market penetration remains significantly high in developed countries with higher spending power, but rapid adoption is observed in developing countries. The market penetration in the developed regions has already reached high value, but the developing countries are showing a rapid adoption rate.
Dominant Regions & Segments in Dental CAM Milling Machine Industry
North America currently holds the largest market share within the dental CAM milling machine industry, fueled by high adoption rates of advanced technologies and a well-established dental infrastructure. Europe also holds a significant market share, while the Asia-Pacific region is projected to witness the highest growth rate during the forecast period driven by rising disposable income and improved healthcare infrastructure. The in-lab milling machine segment dominates the market in terms of revenue, but the in-office segment is witnessing faster growth due to its efficiency and convenience. Bench-top and standalone machines hold a larger market share compared to tabletop machines. CAD/CAM milling technology is the dominant technology, while copying milling technology still holds a niche market.
- Key Drivers for North America: High technology adoption, strong dental infrastructure
- Key Drivers for Europe: Established healthcare systems, high per capita spending
- Key Drivers for Asia-Pacific: Rising disposable incomes, improving healthcare infrastructure
- Dominant Segment (Type): In-lab milling machines
- Fastest-Growing Segment (Type): In-office milling machines
- Dominant Segment (Size): Bench-top and Standalone
- Dominant Segment (Technology): CAD/CAM milling
Dental CAM Milling Machine Industry Product Innovations
Recent product innovations in the dental CAM milling machine industry focus on enhanced speed, precision, and ease of use. Manufacturers are integrating advanced features like AI-powered software for automated workflow optimization and improved material handling systems. The development of dry milling capabilities minimizes the need for coolant, simplifying operation and maintenance. New materials compatible with milling machines are also emerging, expanding application possibilities. These innovations cater to the increasing demand for efficient and cost-effective dental restorations, creating stronger market fit and improving competitive advantage.
Report Scope & Segmentation Analysis
This report segments the dental CAM milling machine market based on type (in-lab vs. in-office), size (tabletop, bench-top, standalone), and technology (copying vs. CAD/CAM milling). Each segment is analyzed in detail, providing market size, growth projections, and competitive dynamics. For example, the in-office segment is projected to witness a higher CAGR compared to the in-lab segment, driven by the increasing preference for same-day restorations. The bench-top and standalone machines are experiencing high growth due to their versatility. The CAD/CAM technology segment continues to dominate due to its improved efficiency and accuracy.
Key Drivers of Dental CAM Milling Machine Industry Growth
The growth of the dental CAM milling machine industry is driven by several key factors, including the increasing prevalence of dental diseases globally, the rising demand for aesthetically pleasing and durable restorations, and advancements in CAD/CAM technology. Economic factors, such as rising disposable incomes in developing countries, are also fueling market expansion. Furthermore, supportive regulatory frameworks are facilitating market entry and technological advancements.
Challenges in the Dental CAM Milling Machine Industry Sector
Challenges facing the industry include the high initial investment costs associated with acquiring milling machines and software, the need for skilled technicians, and intense competition among manufacturers. Supply chain disruptions can impact the availability of materials and components. Stringent regulatory requirements for medical devices also present significant hurdles for market entry. These factors collectively can restrain the market growth to some extent.
Emerging Opportunities in Dental CAM Milling Machine Industry
Emerging opportunities include the expansion into new markets, particularly in developing countries, and the development of more user-friendly and cost-effective milling machines. Integration of AI and machine learning is expected to enhance automation and efficiency, while the development of biocompatible materials will broaden application possibilities. Growing focus on digital dentistry presents significant opportunities for growth.
Leading Players in the Dental CAM Milling Machine Industry Market
- Zimmer Biomet Holdings Inc.
- 3M Company
- Roders GmbH
- Dentsply Sirona
- Ivoclar Vivadent AG
- Zirkonzahn AG
- Amann Girrbach AG
- Renishaw Plc
- DATRON AG
- VHF (vhf camfacture AG)
- iMes-iCore GmbH
- Institut Straumann AG
- Planmeca Oy
Key Developments in Dental CAM Milling Machine Industry
- February 2022: Planmeca USA launched the Planmeca PlanMill 35, a new wet/dry chairside mill.
- January 2022: Proto3000 partnered with vhf to expand its dental milling portfolio.
Future Outlook for Dental CAM Milling Machine Industry Market
The future outlook for the dental CAM milling machine industry is positive, with continued growth driven by technological advancements, increasing demand for advanced dental treatments, and expanding market penetration in developing countries. Strategic partnerships, product diversification, and a focus on innovation will be crucial for success in this competitive landscape. The market is poised for significant expansion as digital dentistry gains further momentum.
Dental CAM Milling Machine Industry Segmentation
-
1. Type
- 1.1. In Lab Milling Machines
- 1.2. In Office Milling Machines
-
2. Size
- 2.1. Tabletop
- 2.2. Bench-Top
- 2.3. Standalone
-
3. Technology
- 3.1. Copying Milling
- 3.2. CAD/CAM Milling
Dental CAM Milling Machine Industry Segmentation By Geography
-
1. North America
- 1.1. United States
- 1.2. Canada
- 1.3. Mexico
-
2. Europe
- 2.1. Germany
- 2.2. United Kingdom
- 2.3. France
- 2.4. Italy
- 2.5. Spain
- 2.6. Rest of Europe
-
3. Asia Pacific
- 3.1. China
- 3.2. Japan
- 3.3. India
- 3.4. Australia
- 3.5. South Korea
- 3.6. Rest of Asia Pacific
-
4. Middle East and Africa
- 4.1. GCC
- 4.2. South Africa
- 4.3. Rest of Middle East and Africa
-
5. South America
- 5.1. Brazil
- 5.2. Argentina
- 5.3. Rest of South America

Dental CAM Milling Machine Industry REPORT HIGHLIGHTS
| Aspects | Details |
|---|---|
| Study Period | 2019-2033 |
| Base Year | 2024 |
| Estimated Year | 2025 |
| Forecast Period | 2025-2033 |
| Historical Period | 2019-2024 |
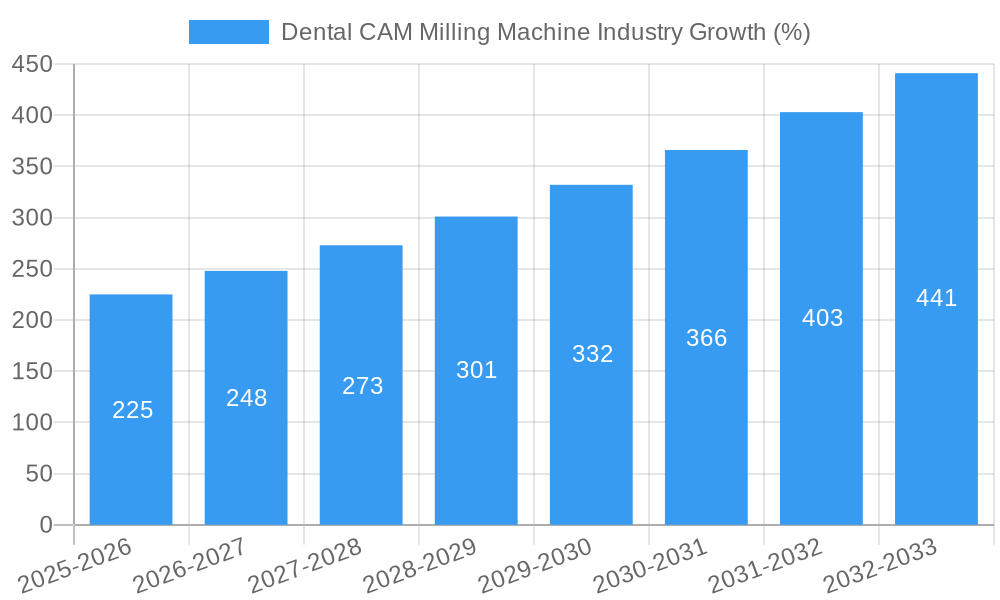
| Growth Rate | CAGR of 9.50% from 2019-2033 |
| Segmentation |
|
Table of Contents
- 1. Introduction
- 1.1. Research Scope
- 1.2. Market Segmentation
- 1.3. Research Methodology
- 1.4. Definitions and Assumptions
- 2. Executive Summary
- 2.1. Introduction
- 3. Market Dynamics
- 3.1. Introduction
- 3.2. Market Drivers
- 3.2.1. Growing Burden of Dental Diseases and Rising Geriatric Population; Technological Advancements in Cosmetic Dentistry; Rising Application of CAD/CAM Technology In Dentistry
- 3.3. Market Restrains
- 3.3.1. High Cost of Dental Milling Machines; Reimbursement Issue In Dental Procedures
- 3.4. Market Trends
- 3.4.1. CAD/CAM Milling Segment is Expected to Dominate the Market Over the Forecast Period
- 4. Market Factor Analysis
- 4.1. Porters Five Forces
- 4.2. Supply/Value Chain
- 4.3. PESTEL analysis
- 4.4. Market Entropy
- 4.5. Patent/Trademark Analysis
- 5. Global Dental CAM Milling Machine Industry Analysis, Insights and Forecast, 2019-2031
- 5.1. Market Analysis, Insights and Forecast - by Type
- 5.1.1. In Lab Milling Machines
- 5.1.2. In Office Milling Machines
- 5.2. Market Analysis, Insights and Forecast - by Size
- 5.2.1. Tabletop
- 5.2.2. Bench-Top
- 5.2.3. Standalone
- 5.3. Market Analysis, Insights and Forecast - by Technology
- 5.3.1. Copying Milling
- 5.3.2. CAD/CAM Milling
- 5.4. Market Analysis, Insights and Forecast - by Region
- 5.4.1. North America
- 5.4.2. Europe
- 5.4.3. Asia Pacific
- 5.4.4. Middle East and Africa
- 5.4.5. South America
- 5.1. Market Analysis, Insights and Forecast - by Type
- 6. North America Dental CAM Milling Machine Industry Analysis, Insights and Forecast, 2019-2031
- 6.1. Market Analysis, Insights and Forecast - by Type
- 6.1.1. In Lab Milling Machines
- 6.1.2. In Office Milling Machines
- 6.2. Market Analysis, Insights and Forecast - by Size
- 6.2.1. Tabletop
- 6.2.2. Bench-Top
- 6.2.3. Standalone
- 6.3. Market Analysis, Insights and Forecast - by Technology
- 6.3.1. Copying Milling
- 6.3.2. CAD/CAM Milling
- 6.1. Market Analysis, Insights and Forecast - by Type
- 7. Europe Dental CAM Milling Machine Industry Analysis, Insights and Forecast, 2019-2031
- 7.1. Market Analysis, Insights and Forecast - by Type
- 7.1.1. In Lab Milling Machines
- 7.1.2. In Office Milling Machines
- 7.2. Market Analysis, Insights and Forecast - by Size
- 7.2.1. Tabletop
- 7.2.2. Bench-Top
- 7.2.3. Standalone
- 7.3. Market Analysis, Insights and Forecast - by Technology
- 7.3.1. Copying Milling
- 7.3.2. CAD/CAM Milling
- 7.1. Market Analysis, Insights and Forecast - by Type
- 8. Asia Pacific Dental CAM Milling Machine Industry Analysis, Insights and Forecast, 2019-2031
- 8.1. Market Analysis, Insights and Forecast - by Type
- 8.1.1. In Lab Milling Machines
- 8.1.2. In Office Milling Machines
- 8.2. Market Analysis, Insights and Forecast - by Size
- 8.2.1. Tabletop
- 8.2.2. Bench-Top
- 8.2.3. Standalone
- 8.3. Market Analysis, Insights and Forecast - by Technology
- 8.3.1. Copying Milling
- 8.3.2. CAD/CAM Milling
- 8.1. Market Analysis, Insights and Forecast - by Type
- 9. Middle East and Africa Dental CAM Milling Machine Industry Analysis, Insights and Forecast, 2019-2031
- 9.1. Market Analysis, Insights and Forecast - by Type
- 9.1.1. In Lab Milling Machines
- 9.1.2. In Office Milling Machines
- 9.2. Market Analysis, Insights and Forecast - by Size
- 9.2.1. Tabletop
- 9.2.2. Bench-Top
- 9.2.3. Standalone
- 9.3. Market Analysis, Insights and Forecast - by Technology
- 9.3.1. Copying Milling
- 9.3.2. CAD/CAM Milling
- 9.1. Market Analysis, Insights and Forecast - by Type
- 10. South America Dental CAM Milling Machine Industry Analysis, Insights and Forecast, 2019-2031
- 10.1. Market Analysis, Insights and Forecast - by Type
- 10.1.1. In Lab Milling Machines
- 10.1.2. In Office Milling Machines
- 10.2. Market Analysis, Insights and Forecast - by Size
- 10.2.1. Tabletop
- 10.2.2. Bench-Top
- 10.2.3. Standalone
- 10.3. Market Analysis, Insights and Forecast - by Technology
- 10.3.1. Copying Milling
- 10.3.2. CAD/CAM Milling
- 10.1. Market Analysis, Insights and Forecast - by Type
- 11. North Americ Dental CAM Milling Machine Industry Analysis, Insights and Forecast, 2019-2031
- 11.1. Market Analysis, Insights and Forecast - By Country/Sub-region
- 11.1.1 United States
- 11.1.2 Canada
- 11.1.3 Mexico
- 12. South America Dental CAM Milling Machine Industry Analysis, Insights and Forecast, 2019-2031
- 12.1. Market Analysis, Insights and Forecast - By Country/Sub-region
- 12.1.1 Brazil
- 12.1.2 Mexico
- 12.1.3 Rest of South America
- 13. Europe Dental CAM Milling Machine Industry Analysis, Insights and Forecast, 2019-2031
- 13.1. Market Analysis, Insights and Forecast - By Country/Sub-region
- 13.1.1 Germany
- 13.1.2 United Kingdom
- 13.1.3 France
- 13.1.4 Italy
- 13.1.5 Spain
- 13.1.6 Rest of Europe
- 14. Asia Pacific Dental CAM Milling Machine Industry Analysis, Insights and Forecast, 2019-2031
- 14.1. Market Analysis, Insights and Forecast - By Country/Sub-region
- 14.1.1 China
- 14.1.2 Japan
- 14.1.3 India
- 14.1.4 South Korea
- 14.1.5 Taiwan
- 14.1.6 Australia
- 14.1.7 Rest of Asia-Pacific
- 15. MEA Dental CAM Milling Machine Industry Analysis, Insights and Forecast, 2019-2031
- 15.1. Market Analysis, Insights and Forecast - By Country/Sub-region
- 15.1.1 Middle East
- 15.1.2 Africa
- 16. Competitive Analysis
- 16.1. Global Market Share Analysis 2024
- 16.2. Company Profiles
- 16.2.1 Zimmer Biomet Holdings Inc.
- 16.2.1.1. Overview
- 16.2.1.2. Products
- 16.2.1.3. SWOT Analysis
- 16.2.1.4. Recent Developments
- 16.2.1.5. Financials (Based on Availability)
- 16.2.2 3M company
- 16.2.2.1. Overview
- 16.2.2.2. Products
- 16.2.2.3. SWOT Analysis
- 16.2.2.4. Recent Developments
- 16.2.2.5. Financials (Based on Availability)
- 16.2.3 Roders GmbH
- 16.2.3.1. Overview
- 16.2.3.2. Products
- 16.2.3.3. SWOT Analysis
- 16.2.3.4. Recent Developments
- 16.2.3.5. Financials (Based on Availability)
- 16.2.4 Dentsply Sirona
- 16.2.4.1. Overview
- 16.2.4.2. Products
- 16.2.4.3. SWOT Analysis
- 16.2.4.4. Recent Developments
- 16.2.4.5. Financials (Based on Availability)
- 16.2.5 Ivoclar Vivadent AG
- 16.2.5.1. Overview
- 16.2.5.2. Products
- 16.2.5.3. SWOT Analysis
- 16.2.5.4. Recent Developments
- 16.2.5.5. Financials (Based on Availability)
- 16.2.6 Zirkonzahn AG
- 16.2.6.1. Overview
- 16.2.6.2. Products
- 16.2.6.3. SWOT Analysis
- 16.2.6.4. Recent Developments
- 16.2.6.5. Financials (Based on Availability)
- 16.2.7 Amann Girrbach AG
- 16.2.7.1. Overview
- 16.2.7.2. Products
- 16.2.7.3. SWOT Analysis
- 16.2.7.4. Recent Developments
- 16.2.7.5. Financials (Based on Availability)
- 16.2.8 Renishaw Plc
- 16.2.8.1. Overview
- 16.2.8.2. Products
- 16.2.8.3. SWOT Analysis
- 16.2.8.4. Recent Developments
- 16.2.8.5. Financials (Based on Availability)
- 16.2.9 DATRON AG
- 16.2.9.1. Overview
- 16.2.9.2. Products
- 16.2.9.3. SWOT Analysis
- 16.2.9.4. Recent Developments
- 16.2.9.5. Financials (Based on Availability)
- 16.2.10 VHF (vhf camfacture AG)
- 16.2.10.1. Overview
- 16.2.10.2. Products
- 16.2.10.3. SWOT Analysis
- 16.2.10.4. Recent Developments
- 16.2.10.5. Financials (Based on Availability)
- 16.2.11 iMes-iCore GmbH
- 16.2.11.1. Overview
- 16.2.11.2. Products
- 16.2.11.3. SWOT Analysis
- 16.2.11.4. Recent Developments
- 16.2.11.5. Financials (Based on Availability)
- 16.2.12 Institut Straumann AG
- 16.2.12.1. Overview
- 16.2.12.2. Products
- 16.2.12.3. SWOT Analysis
- 16.2.12.4. Recent Developments
- 16.2.12.5. Financials (Based on Availability)
- 16.2.13 Planmeca Oy
- 16.2.13.1. Overview
- 16.2.13.2. Products
- 16.2.13.3. SWOT Analysis
- 16.2.13.4. Recent Developments
- 16.2.13.5. Financials (Based on Availability)
- 16.2.1 Zimmer Biomet Holdings Inc.
List of Figures
- Figure 1: Global Dental CAM Milling Machine Industry Revenue Breakdown (billion, %) by Region 2024 & 2032
- Figure 2: Global Dental CAM Milling Machine Industry Volume Breakdown (K Units, %) by Region 2024 & 2032
- Figure 3: North Americ Dental CAM Milling Machine Industry Revenue (billion), by Country 2024 & 2032
- Figure 4: North Americ Dental CAM Milling Machine Industry Volume (K Units), by Country 2024 & 2032
- Figure 5: North Americ Dental CAM Milling Machine Industry Revenue Share (%), by Country 2024 & 2032
- Figure 6: North Americ Dental CAM Milling Machine Industry Volume Share (%), by Country 2024 & 2032
- Figure 7: South America Dental CAM Milling Machine Industry Revenue (billion), by Country 2024 & 2032
- Figure 8: South America Dental CAM Milling Machine Industry Volume (K Units), by Country 2024 & 2032
- Figure 9: South America Dental CAM Milling Machine Industry Revenue Share (%), by Country 2024 & 2032
- Figure 10: South America Dental CAM Milling Machine Industry Volume Share (%), by Country 2024 & 2032
- Figure 11: Europe Dental CAM Milling Machine Industry Revenue (billion), by Country 2024 & 2032
- Figure 12: Europe Dental CAM Milling Machine Industry Volume (K Units), by Country 2024 & 2032
- Figure 13: Europe Dental CAM Milling Machine Industry Revenue Share (%), by Country 2024 & 2032
- Figure 14: Europe Dental CAM Milling Machine Industry Volume Share (%), by Country 2024 & 2032
- Figure 15: Asia Pacific Dental CAM Milling Machine Industry Revenue (billion), by Country 2024 & 2032
- Figure 16: Asia Pacific Dental CAM Milling Machine Industry Volume (K Units), by Country 2024 & 2032
- Figure 17: Asia Pacific Dental CAM Milling Machine Industry Revenue Share (%), by Country 2024 & 2032
- Figure 18: Asia Pacific Dental CAM Milling Machine Industry Volume Share (%), by Country 2024 & 2032
- Figure 19: MEA Dental CAM Milling Machine Industry Revenue (billion), by Country 2024 & 2032
- Figure 20: MEA Dental CAM Milling Machine Industry Volume (K Units), by Country 2024 & 2032
- Figure 21: MEA Dental CAM Milling Machine Industry Revenue Share (%), by Country 2024 & 2032
- Figure 22: MEA Dental CAM Milling Machine Industry Volume Share (%), by Country 2024 & 2032
- Figure 23: North America Dental CAM Milling Machine Industry Revenue (billion), by Type 2024 & 2032
- Figure 24: North America Dental CAM Milling Machine Industry Volume (K Units), by Type 2024 & 2032
- Figure 25: North America Dental CAM Milling Machine Industry Revenue Share (%), by Type 2024 & 2032
- Figure 26: North America Dental CAM Milling Machine Industry Volume Share (%), by Type 2024 & 2032
- Figure 27: North America Dental CAM Milling Machine Industry Revenue (billion), by Size 2024 & 2032
- Figure 28: North America Dental CAM Milling Machine Industry Volume (K Units), by Size 2024 & 2032
- Figure 29: North America Dental CAM Milling Machine Industry Revenue Share (%), by Size 2024 & 2032
- Figure 30: North America Dental CAM Milling Machine Industry Volume Share (%), by Size 2024 & 2032
- Figure 31: North America Dental CAM Milling Machine Industry Revenue (billion), by Technology 2024 & 2032
- Figure 32: North America Dental CAM Milling Machine Industry Volume (K Units), by Technology 2024 & 2032
- Figure 33: North America Dental CAM Milling Machine Industry Revenue Share (%), by Technology 2024 & 2032
- Figure 34: North America Dental CAM Milling Machine Industry Volume Share (%), by Technology 2024 & 2032
- Figure 35: North America Dental CAM Milling Machine Industry Revenue (billion), by Country 2024 & 2032
- Figure 36: North America Dental CAM Milling Machine Industry Volume (K Units), by Country 2024 & 2032
- Figure 37: North America Dental CAM Milling Machine Industry Revenue Share (%), by Country 2024 & 2032
- Figure 38: North America Dental CAM Milling Machine Industry Volume Share (%), by Country 2024 & 2032
- Figure 39: Europe Dental CAM Milling Machine Industry Revenue (billion), by Type 2024 & 2032
- Figure 40: Europe Dental CAM Milling Machine Industry Volume (K Units), by Type 2024 & 2032
- Figure 41: Europe Dental CAM Milling Machine Industry Revenue Share (%), by Type 2024 & 2032
- Figure 42: Europe Dental CAM Milling Machine Industry Volume Share (%), by Type 2024 & 2032
- Figure 43: Europe Dental CAM Milling Machine Industry Revenue (billion), by Size 2024 & 2032
- Figure 44: Europe Dental CAM Milling Machine Industry Volume (K Units), by Size 2024 & 2032
- Figure 45: Europe Dental CAM Milling Machine Industry Revenue Share (%), by Size 2024 & 2032
- Figure 46: Europe Dental CAM Milling Machine Industry Volume Share (%), by Size 2024 & 2032
- Figure 47: Europe Dental CAM Milling Machine Industry Revenue (billion), by Technology 2024 & 2032
- Figure 48: Europe Dental CAM Milling Machine Industry Volume (K Units), by Technology 2024 & 2032
- Figure 49: Europe Dental CAM Milling Machine Industry Revenue Share (%), by Technology 2024 & 2032
- Figure 50: Europe Dental CAM Milling Machine Industry Volume Share (%), by Technology 2024 & 2032
- Figure 51: Europe Dental CAM Milling Machine Industry Revenue (billion), by Country 2024 & 2032
- Figure 52: Europe Dental CAM Milling Machine Industry Volume (K Units), by Country 2024 & 2032
- Figure 53: Europe Dental CAM Milling Machine Industry Revenue Share (%), by Country 2024 & 2032
- Figure 54: Europe Dental CAM Milling Machine Industry Volume Share (%), by Country 2024 & 2032
- Figure 55: Asia Pacific Dental CAM Milling Machine Industry Revenue (billion), by Type 2024 & 2032
- Figure 56: Asia Pacific Dental CAM Milling Machine Industry Volume (K Units), by Type 2024 & 2032
- Figure 57: Asia Pacific Dental CAM Milling Machine Industry Revenue Share (%), by Type 2024 & 2032
- Figure 58: Asia Pacific Dental CAM Milling Machine Industry Volume Share (%), by Type 2024 & 2032
- Figure 59: Asia Pacific Dental CAM Milling Machine Industry Revenue (billion), by Size 2024 & 2032
- Figure 60: Asia Pacific Dental CAM Milling Machine Industry Volume (K Units), by Size 2024 & 2032
- Figure 61: Asia Pacific Dental CAM Milling Machine Industry Revenue Share (%), by Size 2024 & 2032
- Figure 62: Asia Pacific Dental CAM Milling Machine Industry Volume Share (%), by Size 2024 & 2032
- Figure 63: Asia Pacific Dental CAM Milling Machine Industry Revenue (billion), by Technology 2024 & 2032
- Figure 64: Asia Pacific Dental CAM Milling Machine Industry Volume (K Units), by Technology 2024 & 2032
- Figure 65: Asia Pacific Dental CAM Milling Machine Industry Revenue Share (%), by Technology 2024 & 2032
- Figure 66: Asia Pacific Dental CAM Milling Machine Industry Volume Share (%), by Technology 2024 & 2032
- Figure 67: Asia Pacific Dental CAM Milling Machine Industry Revenue (billion), by Country 2024 & 2032
- Figure 68: Asia Pacific Dental CAM Milling Machine Industry Volume (K Units), by Country 2024 & 2032
- Figure 69: Asia Pacific Dental CAM Milling Machine Industry Revenue Share (%), by Country 2024 & 2032
- Figure 70: Asia Pacific Dental CAM Milling Machine Industry Volume Share (%), by Country 2024 & 2032
- Figure 71: Middle East and Africa Dental CAM Milling Machine Industry Revenue (billion), by Type 2024 & 2032
- Figure 72: Middle East and Africa Dental CAM Milling Machine Industry Volume (K Units), by Type 2024 & 2032
- Figure 73: Middle East and Africa Dental CAM Milling Machine Industry Revenue Share (%), by Type 2024 & 2032
- Figure 74: Middle East and Africa Dental CAM Milling Machine Industry Volume Share (%), by Type 2024 & 2032
- Figure 75: Middle East and Africa Dental CAM Milling Machine Industry Revenue (billion), by Size 2024 & 2032
- Figure 76: Middle East and Africa Dental CAM Milling Machine Industry Volume (K Units), by Size 2024 & 2032
- Figure 77: Middle East and Africa Dental CAM Milling Machine Industry Revenue Share (%), by Size 2024 & 2032
- Figure 78: Middle East and Africa Dental CAM Milling Machine Industry Volume Share (%), by Size 2024 & 2032
- Figure 79: Middle East and Africa Dental CAM Milling Machine Industry Revenue (billion), by Technology 2024 & 2032
- Figure 80: Middle East and Africa Dental CAM Milling Machine Industry Volume (K Units), by Technology 2024 & 2032
- Figure 81: Middle East and Africa Dental CAM Milling Machine Industry Revenue Share (%), by Technology 2024 & 2032
- Figure 82: Middle East and Africa Dental CAM Milling Machine Industry Volume Share (%), by Technology 2024 & 2032
- Figure 83: Middle East and Africa Dental CAM Milling Machine Industry Revenue (billion), by Country 2024 & 2032
- Figure 84: Middle East and Africa Dental CAM Milling Machine Industry Volume (K Units), by Country 2024 & 2032
- Figure 85: Middle East and Africa Dental CAM Milling Machine Industry Revenue Share (%), by Country 2024 & 2032
- Figure 86: Middle East and Africa Dental CAM Milling Machine Industry Volume Share (%), by Country 2024 & 2032
- Figure 87: South America Dental CAM Milling Machine Industry Revenue (billion), by Type 2024 & 2032
- Figure 88: South America Dental CAM Milling Machine Industry Volume (K Units), by Type 2024 & 2032
- Figure 89: South America Dental CAM Milling Machine Industry Revenue Share (%), by Type 2024 & 2032
- Figure 90: South America Dental CAM Milling Machine Industry Volume Share (%), by Type 2024 & 2032
- Figure 91: South America Dental CAM Milling Machine Industry Revenue (billion), by Size 2024 & 2032
- Figure 92: South America Dental CAM Milling Machine Industry Volume (K Units), by Size 2024 & 2032
- Figure 93: South America Dental CAM Milling Machine Industry Revenue Share (%), by Size 2024 & 2032
- Figure 94: South America Dental CAM Milling Machine Industry Volume Share (%), by Size 2024 & 2032
- Figure 95: South America Dental CAM Milling Machine Industry Revenue (billion), by Technology 2024 & 2032
- Figure 96: South America Dental CAM Milling Machine Industry Volume (K Units), by Technology 2024 & 2032
- Figure 97: South America Dental CAM Milling Machine Industry Revenue Share (%), by Technology 2024 & 2032
- Figure 98: South America Dental CAM Milling Machine Industry Volume Share (%), by Technology 2024 & 2032
- Figure 99: South America Dental CAM Milling Machine Industry Revenue (billion), by Country 2024 & 2032
- Figure 100: South America Dental CAM Milling Machine Industry Volume (K Units), by Country 2024 & 2032
- Figure 101: South America Dental CAM Milling Machine Industry Revenue Share (%), by Country 2024 & 2032
- Figure 102: South America Dental CAM Milling Machine Industry Volume Share (%), by Country 2024 & 2032
List of Tables
- Table 1: Global Dental CAM Milling Machine Industry Revenue billion Forecast, by Region 2019 & 2032
- Table 2: Global Dental CAM Milling Machine Industry Volume K Units Forecast, by Region 2019 & 2032
- Table 3: Global Dental CAM Milling Machine Industry Revenue billion Forecast, by Type 2019 & 2032
- Table 4: Global Dental CAM Milling Machine Industry Volume K Units Forecast, by Type 2019 & 2032
- Table 5: Global Dental CAM Milling Machine Industry Revenue billion Forecast, by Size 2019 & 2032
- Table 6: Global Dental CAM Milling Machine Industry Volume K Units Forecast, by Size 2019 & 2032
- Table 7: Global Dental CAM Milling Machine Industry Revenue billion Forecast, by Technology 2019 & 2032
- Table 8: Global Dental CAM Milling Machine Industry Volume K Units Forecast, by Technology 2019 & 2032
- Table 9: Global Dental CAM Milling Machine Industry Revenue billion Forecast, by Region 2019 & 2032
- Table 10: Global Dental CAM Milling Machine Industry Volume K Units Forecast, by Region 2019 & 2032
- Table 11: Global Dental CAM Milling Machine Industry Revenue billion Forecast, by Country 2019 & 2032
- Table 12: Global Dental CAM Milling Machine Industry Volume K Units Forecast, by Country 2019 & 2032
- Table 13: United States Dental CAM Milling Machine Industry Revenue (billion) Forecast, by Application 2019 & 2032
- Table 14: United States Dental CAM Milling Machine Industry Volume (K Units) Forecast, by Application 2019 & 2032
- Table 15: Canada Dental CAM Milling Machine Industry Revenue (billion) Forecast, by Application 2019 & 2032
- Table 16: Canada Dental CAM Milling Machine Industry Volume (K Units) Forecast, by Application 2019 & 2032
- Table 17: Mexico Dental CAM Milling Machine Industry Revenue (billion) Forecast, by Application 2019 & 2032
- Table 18: Mexico Dental CAM Milling Machine Industry Volume (K Units) Forecast, by Application 2019 & 2032
- Table 19: Global Dental CAM Milling Machine Industry Revenue billion Forecast, by Country 2019 & 2032
- Table 20: Global Dental CAM Milling Machine Industry Volume K Units Forecast, by Country 2019 & 2032
- Table 21: Brazil Dental CAM Milling Machine Industry Revenue (billion) Forecast, by Application 2019 & 2032
- Table 22: Brazil Dental CAM Milling Machine Industry Volume (K Units) Forecast, by Application 2019 & 2032
- Table 23: Mexico Dental CAM Milling Machine Industry Revenue (billion) Forecast, by Application 2019 & 2032
- Table 24: Mexico Dental CAM Milling Machine Industry Volume (K Units) Forecast, by Application 2019 & 2032
- Table 25: Rest of South America Dental CAM Milling Machine Industry Revenue (billion) Forecast, by Application 2019 & 2032
- Table 26: Rest of South America Dental CAM Milling Machine Industry Volume (K Units) Forecast, by Application 2019 & 2032
- Table 27: Global Dental CAM Milling Machine Industry Revenue billion Forecast, by Country 2019 & 2032
- Table 28: Global Dental CAM Milling Machine Industry Volume K Units Forecast, by Country 2019 & 2032
- Table 29: Germany Dental CAM Milling Machine Industry Revenue (billion) Forecast, by Application 2019 & 2032
- Table 30: Germany Dental CAM Milling Machine Industry Volume (K Units) Forecast, by Application 2019 & 2032
- Table 31: United Kingdom Dental CAM Milling Machine Industry Revenue (billion) Forecast, by Application 2019 & 2032
- Table 32: United Kingdom Dental CAM Milling Machine Industry Volume (K Units) Forecast, by Application 2019 & 2032
- Table 33: France Dental CAM Milling Machine Industry Revenue (billion) Forecast, by Application 2019 & 2032
- Table 34: France Dental CAM Milling Machine Industry Volume (K Units) Forecast, by Application 2019 & 2032
- Table 35: Italy Dental CAM Milling Machine Industry Revenue (billion) Forecast, by Application 2019 & 2032
- Table 36: Italy Dental CAM Milling Machine Industry Volume (K Units) Forecast, by Application 2019 & 2032
- Table 37: Spain Dental CAM Milling Machine Industry Revenue (billion) Forecast, by Application 2019 & 2032
- Table 38: Spain Dental CAM Milling Machine Industry Volume (K Units) Forecast, by Application 2019 & 2032
- Table 39: Rest of Europe Dental CAM Milling Machine Industry Revenue (billion) Forecast, by Application 2019 & 2032
- Table 40: Rest of Europe Dental CAM Milling Machine Industry Volume (K Units) Forecast, by Application 2019 & 2032
- Table 41: Global Dental CAM Milling Machine Industry Revenue billion Forecast, by Country 2019 & 2032
- Table 42: Global Dental CAM Milling Machine Industry Volume K Units Forecast, by Country 2019 & 2032
- Table 43: China Dental CAM Milling Machine Industry Revenue (billion) Forecast, by Application 2019 & 2032
- Table 44: China Dental CAM Milling Machine Industry Volume (K Units) Forecast, by Application 2019 & 2032
- Table 45: Japan Dental CAM Milling Machine Industry Revenue (billion) Forecast, by Application 2019 & 2032
- Table 46: Japan Dental CAM Milling Machine Industry Volume (K Units) Forecast, by Application 2019 & 2032
- Table 47: India Dental CAM Milling Machine Industry Revenue (billion) Forecast, by Application 2019 & 2032
- Table 48: India Dental CAM Milling Machine Industry Volume (K Units) Forecast, by Application 2019 & 2032
- Table 49: South Korea Dental CAM Milling Machine Industry Revenue (billion) Forecast, by Application 2019 & 2032
- Table 50: South Korea Dental CAM Milling Machine Industry Volume (K Units) Forecast, by Application 2019 & 2032
- Table 51: Taiwan Dental CAM Milling Machine Industry Revenue (billion) Forecast, by Application 2019 & 2032
- Table 52: Taiwan Dental CAM Milling Machine Industry Volume (K Units) Forecast, by Application 2019 & 2032
- Table 53: Australia Dental CAM Milling Machine Industry Revenue (billion) Forecast, by Application 2019 & 2032
- Table 54: Australia Dental CAM Milling Machine Industry Volume (K Units) Forecast, by Application 2019 & 2032
- Table 55: Rest of Asia-Pacific Dental CAM Milling Machine Industry Revenue (billion) Forecast, by Application 2019 & 2032
- Table 56: Rest of Asia-Pacific Dental CAM Milling Machine Industry Volume (K Units) Forecast, by Application 2019 & 2032
- Table 57: Global Dental CAM Milling Machine Industry Revenue billion Forecast, by Country 2019 & 2032
- Table 58: Global Dental CAM Milling Machine Industry Volume K Units Forecast, by Country 2019 & 2032
- Table 59: Middle East Dental CAM Milling Machine Industry Revenue (billion) Forecast, by Application 2019 & 2032
- Table 60: Middle East Dental CAM Milling Machine Industry Volume (K Units) Forecast, by Application 2019 & 2032
- Table 61: Africa Dental CAM Milling Machine Industry Revenue (billion) Forecast, by Application 2019 & 2032
- Table 62: Africa Dental CAM Milling Machine Industry Volume (K Units) Forecast, by Application 2019 & 2032
- Table 63: Global Dental CAM Milling Machine Industry Revenue billion Forecast, by Type 2019 & 2032
- Table 64: Global Dental CAM Milling Machine Industry Volume K Units Forecast, by Type 2019 & 2032
- Table 65: Global Dental CAM Milling Machine Industry Revenue billion Forecast, by Size 2019 & 2032
- Table 66: Global Dental CAM Milling Machine Industry Volume K Units Forecast, by Size 2019 & 2032
- Table 67: Global Dental CAM Milling Machine Industry Revenue billion Forecast, by Technology 2019 & 2032
- Table 68: Global Dental CAM Milling Machine Industry Volume K Units Forecast, by Technology 2019 & 2032
- Table 69: Global Dental CAM Milling Machine Industry Revenue billion Forecast, by Country 2019 & 2032
- Table 70: Global Dental CAM Milling Machine Industry Volume K Units Forecast, by Country 2019 & 2032
- Table 71: United States Dental CAM Milling Machine Industry Revenue (billion) Forecast, by Application 2019 & 2032
- Table 72: United States Dental CAM Milling Machine Industry Volume (K Units) Forecast, by Application 2019 & 2032
- Table 73: Canada Dental CAM Milling Machine Industry Revenue (billion) Forecast, by Application 2019 & 2032
- Table 74: Canada Dental CAM Milling Machine Industry Volume (K Units) Forecast, by Application 2019 & 2032
- Table 75: Mexico Dental CAM Milling Machine Industry Revenue (billion) Forecast, by Application 2019 & 2032
- Table 76: Mexico Dental CAM Milling Machine Industry Volume (K Units) Forecast, by Application 2019 & 2032
- Table 77: Global Dental CAM Milling Machine Industry Revenue billion Forecast, by Type 2019 & 2032
- Table 78: Global Dental CAM Milling Machine Industry Volume K Units Forecast, by Type 2019 & 2032
- Table 79: Global Dental CAM Milling Machine Industry Revenue billion Forecast, by Size 2019 & 2032
- Table 80: Global Dental CAM Milling Machine Industry Volume K Units Forecast, by Size 2019 & 2032
- Table 81: Global Dental CAM Milling Machine Industry Revenue billion Forecast, by Technology 2019 & 2032
- Table 82: Global Dental CAM Milling Machine Industry Volume K Units Forecast, by Technology 2019 & 2032
- Table 83: Global Dental CAM Milling Machine Industry Revenue billion Forecast, by Country 2019 & 2032
- Table 84: Global Dental CAM Milling Machine Industry Volume K Units Forecast, by Country 2019 & 2032
- Table 85: Germany Dental CAM Milling Machine Industry Revenue (billion) Forecast, by Application 2019 & 2032
- Table 86: Germany Dental CAM Milling Machine Industry Volume (K Units) Forecast, by Application 2019 & 2032
- Table 87: United Kingdom Dental CAM Milling Machine Industry Revenue (billion) Forecast, by Application 2019 & 2032
- Table 88: United Kingdom Dental CAM Milling Machine Industry Volume (K Units) Forecast, by Application 2019 & 2032
- Table 89: France Dental CAM Milling Machine Industry Revenue (billion) Forecast, by Application 2019 & 2032
- Table 90: France Dental CAM Milling Machine Industry Volume (K Units) Forecast, by Application 2019 & 2032
- Table 91: Italy Dental CAM Milling Machine Industry Revenue (billion) Forecast, by Application 2019 & 2032
- Table 92: Italy Dental CAM Milling Machine Industry Volume (K Units) Forecast, by Application 2019 & 2032
- Table 93: Spain Dental CAM Milling Machine Industry Revenue (billion) Forecast, by Application 2019 & 2032
- Table 94: Spain Dental CAM Milling Machine Industry Volume (K Units) Forecast, by Application 2019 & 2032
- Table 95: Rest of Europe Dental CAM Milling Machine Industry Revenue (billion) Forecast, by Application 2019 & 2032
- Table 96: Rest of Europe Dental CAM Milling Machine Industry Volume (K Units) Forecast, by Application 2019 & 2032
- Table 97: Global Dental CAM Milling Machine Industry Revenue billion Forecast, by Type 2019 & 2032
- Table 98: Global Dental CAM Milling Machine Industry Volume K Units Forecast, by Type 2019 & 2032
- Table 99: Global Dental CAM Milling Machine Industry Revenue billion Forecast, by Size 2019 & 2032
- Table 100: Global Dental CAM Milling Machine Industry Volume K Units Forecast, by Size 2019 & 2032
- Table 101: Global Dental CAM Milling Machine Industry Revenue billion Forecast, by Technology 2019 & 2032
- Table 102: Global Dental CAM Milling Machine Industry Volume K Units Forecast, by Technology 2019 & 2032
- Table 103: Global Dental CAM Milling Machine Industry Revenue billion Forecast, by Country 2019 & 2032
- Table 104: Global Dental CAM Milling Machine Industry Volume K Units Forecast, by Country 2019 & 2032
- Table 105: China Dental CAM Milling Machine Industry Revenue (billion) Forecast, by Application 2019 & 2032
- Table 106: China Dental CAM Milling Machine Industry Volume (K Units) Forecast, by Application 2019 & 2032
- Table 107: Japan Dental CAM Milling Machine Industry Revenue (billion) Forecast, by Application 2019 & 2032
- Table 108: Japan Dental CAM Milling Machine Industry Volume (K Units) Forecast, by Application 2019 & 2032
- Table 109: India Dental CAM Milling Machine Industry Revenue (billion) Forecast, by Application 2019 & 2032
- Table 110: India Dental CAM Milling Machine Industry Volume (K Units) Forecast, by Application 2019 & 2032
- Table 111: Australia Dental CAM Milling Machine Industry Revenue (billion) Forecast, by Application 2019 & 2032
- Table 112: Australia Dental CAM Milling Machine Industry Volume (K Units) Forecast, by Application 2019 & 2032
- Table 113: South Korea Dental CAM Milling Machine Industry Revenue (billion) Forecast, by Application 2019 & 2032
- Table 114: South Korea Dental CAM Milling Machine Industry Volume (K Units) Forecast, by Application 2019 & 2032
- Table 115: Rest of Asia Pacific Dental CAM Milling Machine Industry Revenue (billion) Forecast, by Application 2019 & 2032
- Table 116: Rest of Asia Pacific Dental CAM Milling Machine Industry Volume (K Units) Forecast, by Application 2019 & 2032
- Table 117: Global Dental CAM Milling Machine Industry Revenue billion Forecast, by Type 2019 & 2032
- Table 118: Global Dental CAM Milling Machine Industry Volume K Units Forecast, by Type 2019 & 2032
- Table 119: Global Dental CAM Milling Machine Industry Revenue billion Forecast, by Size 2019 & 2032
- Table 120: Global Dental CAM Milling Machine Industry Volume K Units Forecast, by Size 2019 & 2032
- Table 121: Global Dental CAM Milling Machine Industry Revenue billion Forecast, by Technology 2019 & 2032
- Table 122: Global Dental CAM Milling Machine Industry Volume K Units Forecast, by Technology 2019 & 2032
- Table 123: Global Dental CAM Milling Machine Industry Revenue billion Forecast, by Country 2019 & 2032
- Table 124: Global Dental CAM Milling Machine Industry Volume K Units Forecast, by Country 2019 & 2032
- Table 125: GCC Dental CAM Milling Machine Industry Revenue (billion) Forecast, by Application 2019 & 2032
- Table 126: GCC Dental CAM Milling Machine Industry Volume (K Units) Forecast, by Application 2019 & 2032
- Table 127: South Africa Dental CAM Milling Machine Industry Revenue (billion) Forecast, by Application 2019 & 2032
- Table 128: South Africa Dental CAM Milling Machine Industry Volume (K Units) Forecast, by Application 2019 & 2032
- Table 129: Rest of Middle East and Africa Dental CAM Milling Machine Industry Revenue (billion) Forecast, by Application 2019 & 2032
- Table 130: Rest of Middle East and Africa Dental CAM Milling Machine Industry Volume (K Units) Forecast, by Application 2019 & 2032
- Table 131: Global Dental CAM Milling Machine Industry Revenue billion Forecast, by Type 2019 & 2032
- Table 132: Global Dental CAM Milling Machine Industry Volume K Units Forecast, by Type 2019 & 2032
- Table 133: Global Dental CAM Milling Machine Industry Revenue billion Forecast, by Size 2019 & 2032
- Table 134: Global Dental CAM Milling Machine Industry Volume K Units Forecast, by Size 2019 & 2032
- Table 135: Global Dental CAM Milling Machine Industry Revenue billion Forecast, by Technology 2019 & 2032
- Table 136: Global Dental CAM Milling Machine Industry Volume K Units Forecast, by Technology 2019 & 2032
- Table 137: Global Dental CAM Milling Machine Industry Revenue billion Forecast, by Country 2019 & 2032
- Table 138: Global Dental CAM Milling Machine Industry Volume K Units Forecast, by Country 2019 & 2032
- Table 139: Brazil Dental CAM Milling Machine Industry Revenue (billion) Forecast, by Application 2019 & 2032
- Table 140: Brazil Dental CAM Milling Machine Industry Volume (K Units) Forecast, by Application 2019 & 2032
- Table 141: Argentina Dental CAM Milling Machine Industry Revenue (billion) Forecast, by Application 2019 & 2032
- Table 142: Argentina Dental CAM Milling Machine Industry Volume (K Units) Forecast, by Application 2019 & 2032
- Table 143: Rest of South America Dental CAM Milling Machine Industry Revenue (billion) Forecast, by Application 2019 & 2032
- Table 144: Rest of South America Dental CAM Milling Machine Industry Volume (K Units) Forecast, by Application 2019 & 2032
Frequently Asked Questions
1. What is the projected Compound Annual Growth Rate (CAGR) of the Dental CAM Milling Machine Industry?
The projected CAGR is approximately 9.50%.
2. Which companies are prominent players in the Dental CAM Milling Machine Industry?
Key companies in the market include Zimmer Biomet Holdings Inc., 3M company, Roders GmbH, Dentsply Sirona, Ivoclar Vivadent AG, Zirkonzahn AG, Amann Girrbach AG, Renishaw Plc, DATRON AG, VHF (vhf camfacture AG), iMes-iCore GmbH, Institut Straumann AG, Planmeca Oy.
3. What are the main segments of the Dental CAM Milling Machine Industry?
The market segments include Type, Size, Technology.
4. Can you provide details about the market size?
The market size is estimated to be USD XX billion as of 2022.
5. What are some drivers contributing to market growth?
Growing Burden of Dental Diseases and Rising Geriatric Population; Technological Advancements in Cosmetic Dentistry; Rising Application of CAD/CAM Technology In Dentistry.
6. What are the notable trends driving market growth?
CAD/CAM Milling Segment is Expected to Dominate the Market Over the Forecast Period.
7. Are there any restraints impacting market growth?
High Cost of Dental Milling Machines; Reimbursement Issue In Dental Procedures.
8. Can you provide examples of recent developments in the market?
In February 2022, Planmeca USA, a leading manufacturer of dental imaging and CAD/CAM equipment, introduced the Planmeca PlanMill 35, a new wet/dry chairside mill.
9. What pricing options are available for accessing the report?
Pricing options include single-user, multi-user, and enterprise licenses priced at USD 4750, USD 5250, and USD 8750 respectively.
10. Is the market size provided in terms of value or volume?
The market size is provided in terms of value, measured in billion and volume, measured in K Units.
11. Are there any specific market keywords associated with the report?
Yes, the market keyword associated with the report is "Dental CAM Milling Machine Industry," which aids in identifying and referencing the specific market segment covered.
12. How do I determine which pricing option suits my needs best?
The pricing options vary based on user requirements and access needs. Individual users may opt for single-user licenses, while businesses requiring broader access may choose multi-user or enterprise licenses for cost-effective access to the report.
13. Are there any additional resources or data provided in the Dental CAM Milling Machine Industry report?
While the report offers comprehensive insights, it's advisable to review the specific contents or supplementary materials provided to ascertain if additional resources or data are available.
14. How can I stay updated on further developments or reports in the Dental CAM Milling Machine Industry?
To stay informed about further developments, trends, and reports in the Dental CAM Milling Machine Industry, consider subscribing to industry newsletters, following relevant companies and organizations, or regularly checking reputable industry news sources and publications.
Methodology
Step 1 - Identification of Relevant Samples Size from Population Database


Step 2 - Approaches for Defining Global Market Size (Value, Volume* & Price*)

Note*: In applicable scenarios
Step 3 - Data Sources
Primary Research
- Web Analytics
- Survey Reports
- Research Institute
- Latest Research Reports
- Opinion Leaders
Secondary Research
- Annual Reports
- White Paper
- Latest Press Release
- Industry Association
- Paid Database
- Investor Presentations

Step 4 - Data Triangulation
Involves using different sources of information in order to increase the validity of a study
These sources are likely to be stakeholders in a program - participants, other researchers, program staff, other community members, and so on.
Then we put all data in single framework & apply various statistical tools to find out the dynamic on the market.
During the analysis stage, feedback from the stakeholder groups would be compared to determine areas of agreement as well as areas of divergence


