
Key Insights
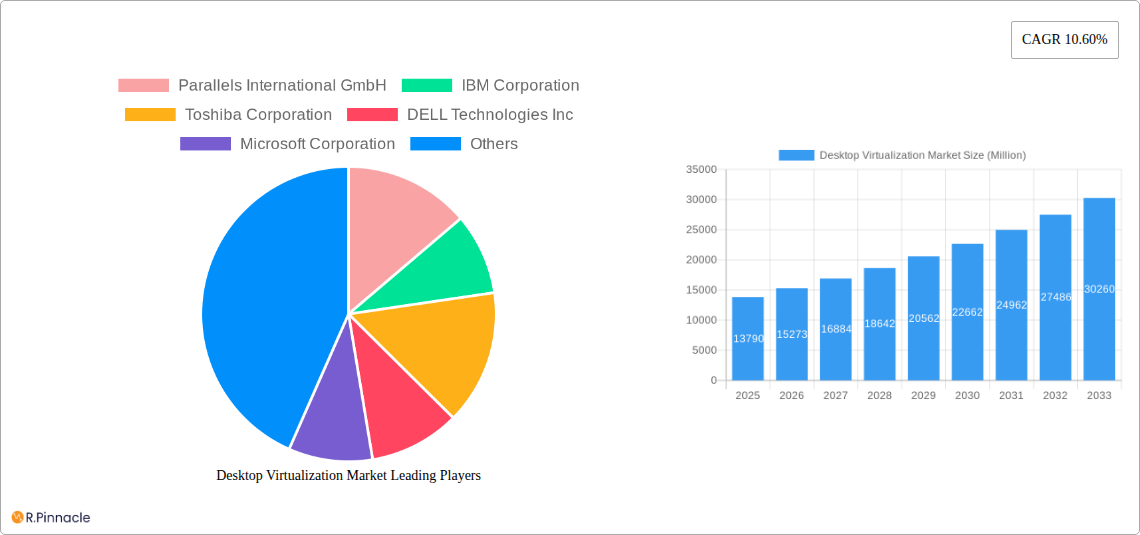
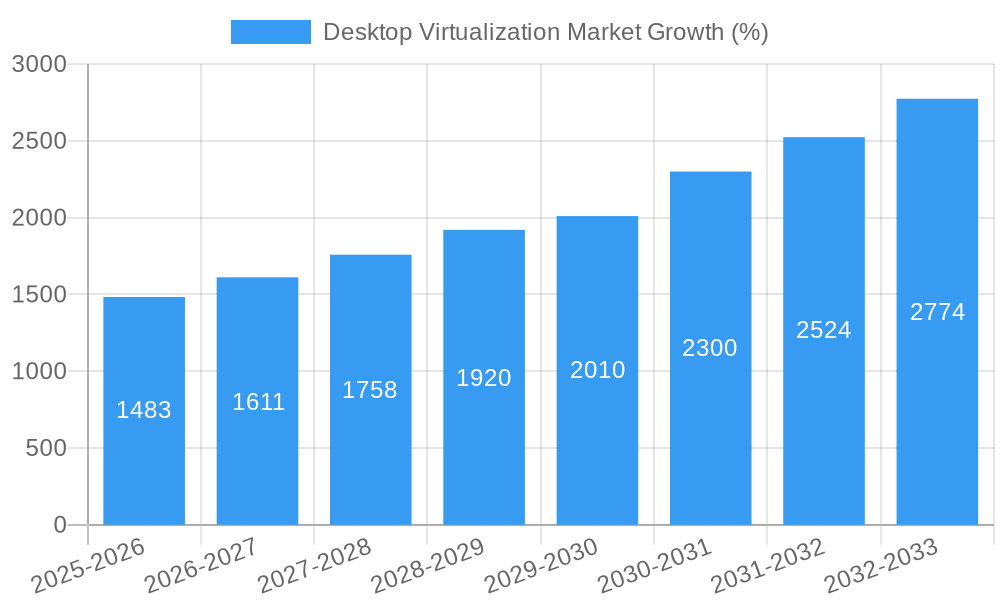
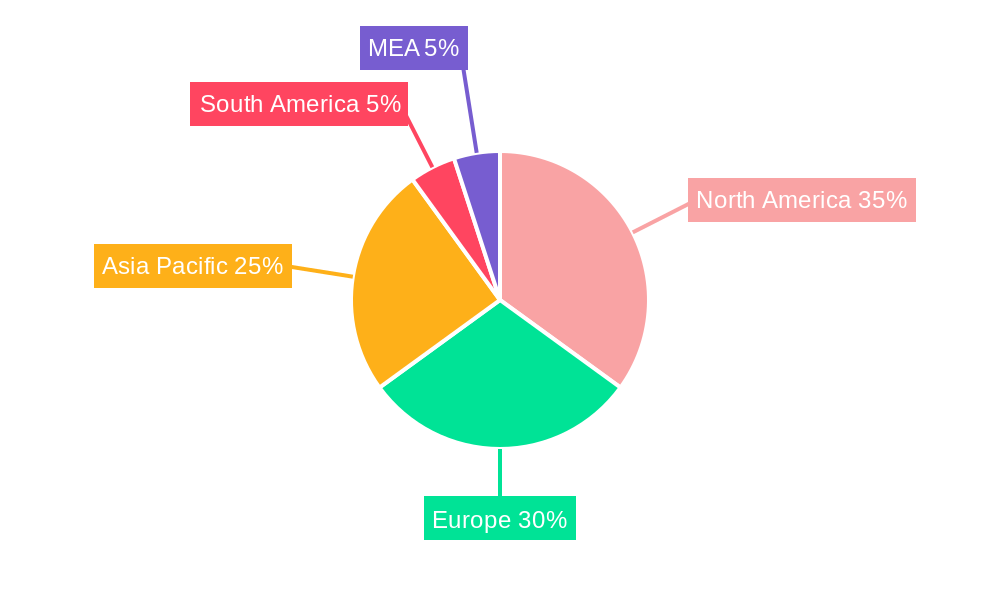
The global Desktop Virtualization market, valued at $13.79 billion in 2025, is projected to experience robust growth, exhibiting a Compound Annual Growth Rate (CAGR) of 10.60% from 2025 to 2033. This expansion is driven by several key factors. Increasing adoption of cloud computing and the rise of remote work models significantly fuel demand for secure and flexible access to applications and data. Enhanced security features within desktop virtualization solutions, mitigating risks associated with data breaches and cyber threats, are also major contributors to market growth. Furthermore, the cost-effectiveness of managing and maintaining virtual desktops compared to traditional physical desktops, particularly in large enterprises, is a compelling driver. The market is segmented by delivery platform (Hosted Virtual Desktop, Hosted Shared Desktop, and others), deployment mode (on-premise and cloud), and end-user vertical (financial services, healthcare, manufacturing, IT & telecommunications, and others). The cloud deployment mode is expected to witness the highest growth due to its scalability and accessibility benefits. North America and Europe currently hold significant market shares, but the Asia-Pacific region is poised for substantial growth owing to increasing digitalization and technological advancements.
The competitive landscape comprises both established players like Citrix, Microsoft, and VMware and emerging innovative companies. While competition is intense, the market offers ample opportunities for growth and innovation, particularly in areas such as enhanced security features, improved user experience, and support for advanced technologies like artificial intelligence and machine learning. The ongoing development of 5G networks is also expected to positively impact market growth by enabling high-bandwidth, low-latency connections for seamless virtual desktop access. Continued investment in research and development of new technologies and solutions will be crucial for companies to maintain a competitive edge and capitalize on the market’s potential. Market restraints might include the initial investment costs associated with implementing desktop virtualization solutions and the need for specialized technical expertise in deployment and management. However, the long-term cost savings and improved efficiency outweigh these challenges for many organizations.
Desktop Virtualization Market Report: 2019-2033
This comprehensive report provides an in-depth analysis of the Desktop Virtualization Market, offering actionable insights for industry professionals and strategic decision-makers. The study covers the period from 2019 to 2033, with a focus on the 2025-2033 forecast period. The report segments the market by desktop delivery platform, deployment mode, and end-user vertical, providing a granular view of market dynamics and growth opportunities. Key players such as Parallels International GmbH, IBM Corporation, Toshiba Corporation, DELL Technologies Inc, Microsoft Corporation, Red Hat Inc, NComputing Co Ltd, Huawei Technologies Co Ltd, Ericom Software Inc, and Citrix Systems Inc are analyzed for their market share, strategies, and competitive landscape. The report also tracks and analyzes significant industry developments impacting the market’s trajectory.
Desktop Virtualization Market Structure & Innovation Trends
The Desktop Virtualization Market exhibits a moderately concentrated structure, with a few major players holding significant market share. However, the market is also characterized by several smaller niche players offering specialized solutions. Innovation in the sector is driven by increasing demand for enhanced security, improved scalability, and seamless user experience, particularly in the cloud-based segment. The regulatory landscape, though generally supportive of virtualization technologies, varies by region and impacts the adoption rate across different geographical areas. Product substitutes, such as traditional on-premise client-server systems, are facing declining adoption, replaced by the flexible and cost-effective advantages of desktop virtualization. The end-user demographic is expanding rapidly, driven by increased remote workforce adoption, digital transformation initiatives, and the rise of hybrid work models. M&A activity has been relatively moderate in recent years, with deal values averaging around xx Million USD. Specific examples include:
- Market Share: Microsoft and Citrix hold significant market shares, with estimates of xx% and xx%, respectively, in 2025.
- M&A Activity: The past five years witnessed xx major M&A deals, with an aggregate value exceeding xx Million USD. These deals highlight a growing trend of consolidation within the industry.
Desktop Virtualization Market Dynamics & Trends
The Desktop Virtualization Market is experiencing robust growth, driven by several key factors. The increasing adoption of cloud computing, the proliferation of remote work models accelerated by the pandemic, and the rising need for enhanced security are major catalysts for market expansion. Technological disruptions, such as the advancements in artificial intelligence (AI) and machine learning (ML) are leading to the development of more intelligent and automated virtualization solutions. Consumer preferences are shifting towards user-friendly interfaces, improved performance, and enhanced security features, while organizations favor cost-effective solutions that can be easily scaled and managed. Competitive dynamics are characterized by both intense competition and strategic collaborations. The Compound Annual Growth Rate (CAGR) during the forecast period (2025-2033) is projected at xx%. Market penetration across various sectors is increasing steadily, with projections of xx% penetration in the healthcare industry and xx% in the financial services sector by 2033.
Dominant Regions & Segments in Desktop Virtualization Market
The North American region currently holds the dominant position in the global Desktop Virtualization Market, fueled by robust technological adoption, a strong IT infrastructure, and a high concentration of major players. However, the Asia-Pacific region exhibits significant growth potential, propelled by rapid economic growth, expanding digitalization initiatives, and a rising need for efficient IT solutions.
- By Desktop Delivery Platform: The Hosted Virtual Desktop (HVD) segment is currently the leading platform due to the benefits of high scalability and cost-effectiveness, projected to reach xx Million USD by 2033.
- By Deployment Mode: The cloud deployment model is experiencing rapid growth, exceeding xx Million USD in 2025 and projected to dominate the market by 2033, driven by ease of access, scalability, and cost advantages.
- By End-User Vertical: The financial services sector holds the largest market share among end-user verticals, with a projected value of xx Million USD by 2033. This sector’s strong focus on data security and regulatory compliance drives its adoption of virtualization technologies. Healthcare is another key vertical, with significant growth driven by telehealth and remote patient monitoring initiatives.
Key drivers for regional dominance include:
- North America: Strong IT infrastructure, high technological adoption rates, and presence of major players.
- Asia-Pacific: Rapid economic growth, increasing digitalization, and large population base.
Desktop Virtualization Market Product Innovations
Recent innovations in desktop virtualization focus on enhancing security, improving user experience, and optimizing performance. This includes advancements in multi-factor authentication (MFA), single sign-on (SSO), and AI-powered resource management. The integration of cloud-native technologies, such as containers and serverless computing, is further improving the scalability and efficiency of virtualization solutions. New platforms are being created for enhanced manageability and reduced total cost of ownership (TCO). These improvements are helping to expand the reach of desktop virtualization to new markets and sectors.
Report Scope & Segmentation Analysis
This report provides a comprehensive analysis of the Desktop Virtualization Market, segmented by:
- By Desktop Delivery Platform: Hosted Virtual Desktop (HVD), Hosted Shared Desktop (HSD), Other Desktop Delivery Forms (Each segment’s growth trajectory and competitive landscape are analyzed).
- By Deployment Mode: On-premise, Cloud (Market size, growth projections, and competitive dynamics are evaluated for each deployment type).
- By End-User Vertical: Financial Services, Healthcare, Manufacturing, IT & Telecommunications, Other End-User Verticals (Individual verticals are assessed for their market size, growth potential, and key drivers).
Each segment's market size, growth projections, and competitive dynamics are detailed within the full report.
Key Drivers of Desktop Virtualization Market Growth
The Desktop Virtualization Market’s growth is fueled by several key drivers:
- Increased adoption of cloud computing: Offering scalability and flexibility.
- Rise of remote work: Demands for secure access to corporate resources.
- Enhanced security: Addressing growing cyber threats.
- Improved cost-effectiveness: Lowering IT infrastructure costs.
Challenges in the Desktop Virtualization Market Sector
Despite its growth, the market faces several challenges:
- Security concerns: Data breaches and unauthorized access remain significant threats.
- Complexity of implementation: Requires specialized skills and expertise.
- Cost of transition: Migrating to a virtualized environment can be expensive.
- Integration issues: Compatibility problems with existing systems.
Emerging Opportunities in Desktop Virtualization Market
Emerging opportunities abound in the Desktop Virtualization Market:
- Integration with AI/ML: Enabling intelligent resource management and automation.
- Expansion into new verticals: Targeting industries with limited virtualization adoption.
- Development of edge computing solutions: Enhancing performance and reducing latency.
- Focus on sustainability: Reducing energy consumption and carbon footprint.
Leading Players in the Desktop Virtualization Market Market
- Parallels International GmbH
- IBM Corporation
- Toshiba Corporation
- DELL Technologies Inc
- Microsoft Corporation
- Red Hat Inc
- NComputing Co Ltd
- Huawei Technologies Co Ltd
- Ericom Software Inc
- Citrix Systems Inc
Key Developments in Desktop Virtualization Market Industry
- November 2023: IGEL and Imprivata partnered to integrate multi-factor authentication (MFA) and single sign-on (SSO) for enhanced security in accessing virtual desktops and applications. This improves security and user experience for healthcare clinicians using cloud services like Microsoft Azure Virtual Desktop (AVD) and Windows 365 Cloud PC.
- April 2023: Virtual Cable and Huawei Cloud formed a technology alliance to boost public cloud adoption in digital workplaces, improving security, productivity, and efficiency. This partnership expands the reach of Virtual Cable's UDS Enterprise software for desktop and application virtualization.
Future Outlook for Desktop Virtualization Market Market
The Desktop Virtualization Market is poised for continued robust growth, driven by ongoing technological advancements, increasing demand for secure remote access, and the expanding adoption of cloud-based solutions. Strategic partnerships, mergers, and acquisitions are expected to reshape the competitive landscape, while innovation in security features and user experience will continue to attract new customers and expand market penetration across various sectors. The market is expected to see significant expansion in both developed and developing economies.
Desktop Virtualization Market Segmentation
-
1. Desktop Delivery Platform
- 1.1. Hosted Virtual Desktop (HVD)
- 1.2. Hosted Shared Desktop (HSD)
- 1.3. Other Desktop Delivery Forms
-
2. Deployment Mode
- 2.1. On-premise
- 2.2. Cloud
-
3. End-User Vertical
- 3.1. Financial Services
- 3.2. Healthcare
- 3.3. Manufacturing
- 3.4. IT & Telecommunications
- 3.5. Other End-User Verticals
Desktop Virtualization Market Segmentation By Geography
- 1. North America
- 2. Europe
- 3. Asia Pacific
- 4. Latin America
- 5. Middle East and Africa
Desktop Virtualization Market REPORT HIGHLIGHTS
| Aspects | Details |
|---|---|
| Study Period | 2019-2033 |
| Base Year | 2024 |
| Estimated Year | 2025 |
| Forecast Period | 2025-2033 |
| Historical Period | 2019-2024 |
| Growth Rate | CAGR of 10.60% from 2019-2033 |
| Segmentation |
|
Table of Contents
- 1. Introduction
- 1.1. Research Scope
- 1.2. Market Segmentation
- 1.3. Research Methodology
- 1.4. Definitions and Assumptions
- 2. Executive Summary
- 2.1. Introduction
- 3. Market Dynamics
- 3.1. Introduction
- 3.2. Market Drivers
- 3.2.1. Increasing Demand for Bring Your Own Device; Growing Adoption of Cloud Computing
- 3.3. Market Restrains
- 3.3.1. Infrastructural Constraints
- 3.4. Market Trends
- 3.4.1. Cloud Deployment Mode is Expected to Witness Significant Growth
- 4. Market Factor Analysis
- 4.1. Porters Five Forces
- 4.2. Supply/Value Chain
- 4.3. PESTEL analysis
- 4.4. Market Entropy
- 4.5. Patent/Trademark Analysis
- 5. Global Desktop Virtualization Market Analysis, Insights and Forecast, 2019-2031
- 5.1. Market Analysis, Insights and Forecast - by Desktop Delivery Platform
- 5.1.1. Hosted Virtual Desktop (HVD)
- 5.1.2. Hosted Shared Desktop (HSD)
- 5.1.3. Other Desktop Delivery Forms
- 5.2. Market Analysis, Insights and Forecast - by Deployment Mode
- 5.2.1. On-premise
- 5.2.2. Cloud
- 5.3. Market Analysis, Insights and Forecast - by End-User Vertical
- 5.3.1. Financial Services
- 5.3.2. Healthcare
- 5.3.3. Manufacturing
- 5.3.4. IT & Telecommunications
- 5.3.5. Other End-User Verticals
- 5.4. Market Analysis, Insights and Forecast - by Region
- 5.4.1. North America
- 5.4.2. Europe
- 5.4.3. Asia Pacific
- 5.4.4. Latin America
- 5.4.5. Middle East and Africa
- 5.1. Market Analysis, Insights and Forecast - by Desktop Delivery Platform
- 6. North America Desktop Virtualization Market Analysis, Insights and Forecast, 2019-2031
- 6.1. Market Analysis, Insights and Forecast - by Desktop Delivery Platform
- 6.1.1. Hosted Virtual Desktop (HVD)
- 6.1.2. Hosted Shared Desktop (HSD)
- 6.1.3. Other Desktop Delivery Forms
- 6.2. Market Analysis, Insights and Forecast - by Deployment Mode
- 6.2.1. On-premise
- 6.2.2. Cloud
- 6.3. Market Analysis, Insights and Forecast - by End-User Vertical
- 6.3.1. Financial Services
- 6.3.2. Healthcare
- 6.3.3. Manufacturing
- 6.3.4. IT & Telecommunications
- 6.3.5. Other End-User Verticals
- 6.1. Market Analysis, Insights and Forecast - by Desktop Delivery Platform
- 7. Europe Desktop Virtualization Market Analysis, Insights and Forecast, 2019-2031
- 7.1. Market Analysis, Insights and Forecast - by Desktop Delivery Platform
- 7.1.1. Hosted Virtual Desktop (HVD)
- 7.1.2. Hosted Shared Desktop (HSD)
- 7.1.3. Other Desktop Delivery Forms
- 7.2. Market Analysis, Insights and Forecast - by Deployment Mode
- 7.2.1. On-premise
- 7.2.2. Cloud
- 7.3. Market Analysis, Insights and Forecast - by End-User Vertical
- 7.3.1. Financial Services
- 7.3.2. Healthcare
- 7.3.3. Manufacturing
- 7.3.4. IT & Telecommunications
- 7.3.5. Other End-User Verticals
- 7.1. Market Analysis, Insights and Forecast - by Desktop Delivery Platform
- 8. Asia Pacific Desktop Virtualization Market Analysis, Insights and Forecast, 2019-2031
- 8.1. Market Analysis, Insights and Forecast - by Desktop Delivery Platform
- 8.1.1. Hosted Virtual Desktop (HVD)
- 8.1.2. Hosted Shared Desktop (HSD)
- 8.1.3. Other Desktop Delivery Forms
- 8.2. Market Analysis, Insights and Forecast - by Deployment Mode
- 8.2.1. On-premise
- 8.2.2. Cloud
- 8.3. Market Analysis, Insights and Forecast - by End-User Vertical
- 8.3.1. Financial Services
- 8.3.2. Healthcare
- 8.3.3. Manufacturing
- 8.3.4. IT & Telecommunications
- 8.3.5. Other End-User Verticals
- 8.1. Market Analysis, Insights and Forecast - by Desktop Delivery Platform
- 9. Latin America Desktop Virtualization Market Analysis, Insights and Forecast, 2019-2031
- 9.1. Market Analysis, Insights and Forecast - by Desktop Delivery Platform
- 9.1.1. Hosted Virtual Desktop (HVD)
- 9.1.2. Hosted Shared Desktop (HSD)
- 9.1.3. Other Desktop Delivery Forms
- 9.2. Market Analysis, Insights and Forecast - by Deployment Mode
- 9.2.1. On-premise
- 9.2.2. Cloud
- 9.3. Market Analysis, Insights and Forecast - by End-User Vertical
- 9.3.1. Financial Services
- 9.3.2. Healthcare
- 9.3.3. Manufacturing
- 9.3.4. IT & Telecommunications
- 9.3.5. Other End-User Verticals
- 9.1. Market Analysis, Insights and Forecast - by Desktop Delivery Platform
- 10. Middle East and Africa Desktop Virtualization Market Analysis, Insights and Forecast, 2019-2031
- 10.1. Market Analysis, Insights and Forecast - by Desktop Delivery Platform
- 10.1.1. Hosted Virtual Desktop (HVD)
- 10.1.2. Hosted Shared Desktop (HSD)
- 10.1.3. Other Desktop Delivery Forms
- 10.2. Market Analysis, Insights and Forecast - by Deployment Mode
- 10.2.1. On-premise
- 10.2.2. Cloud
- 10.3. Market Analysis, Insights and Forecast - by End-User Vertical
- 10.3.1. Financial Services
- 10.3.2. Healthcare
- 10.3.3. Manufacturing
- 10.3.4. IT & Telecommunications
- 10.3.5. Other End-User Verticals
- 10.1. Market Analysis, Insights and Forecast - by Desktop Delivery Platform
- 11. North America Desktop Virtualization Market Analysis, Insights and Forecast, 2019-2031
- 11.1. Market Analysis, Insights and Forecast - By Country/Sub-region
- 11.1.1 United States
- 11.1.2 Canada
- 11.1.3 Mexico
- 12. Europe Desktop Virtualization Market Analysis, Insights and Forecast, 2019-2031
- 12.1. Market Analysis, Insights and Forecast - By Country/Sub-region
- 12.1.1 Germany
- 12.1.2 United Kingdom
- 12.1.3 France
- 12.1.4 Spain
- 12.1.5 Italy
- 12.1.6 Spain
- 12.1.7 Belgium
- 12.1.8 Netherland
- 12.1.9 Nordics
- 12.1.10 Rest of Europe
- 13. Asia Pacific Desktop Virtualization Market Analysis, Insights and Forecast, 2019-2031
- 13.1. Market Analysis, Insights and Forecast - By Country/Sub-region
- 13.1.1 China
- 13.1.2 Japan
- 13.1.3 India
- 13.1.4 South Korea
- 13.1.5 Southeast Asia
- 13.1.6 Australia
- 13.1.7 Indonesia
- 13.1.8 Phillipes
- 13.1.9 Singapore
- 13.1.10 Thailandc
- 13.1.11 Rest of Asia Pacific
- 14. South America Desktop Virtualization Market Analysis, Insights and Forecast, 2019-2031
- 14.1. Market Analysis, Insights and Forecast - By Country/Sub-region
- 14.1.1 Brazil
- 14.1.2 Argentina
- 14.1.3 Peru
- 14.1.4 Chile
- 14.1.5 Colombia
- 14.1.6 Ecuador
- 14.1.7 Venezuela
- 14.1.8 Rest of South America
- 15. North America Desktop Virtualization Market Analysis, Insights and Forecast, 2019-2031
- 15.1. Market Analysis, Insights and Forecast - By Country/Sub-region
- 15.1.1 United States
- 15.1.2 Canada
- 15.1.3 Mexico
- 16. MEA Desktop Virtualization Market Analysis, Insights and Forecast, 2019-2031
- 16.1. Market Analysis, Insights and Forecast - By Country/Sub-region
- 16.1.1 United Arab Emirates
- 16.1.2 Saudi Arabia
- 16.1.3 South Africa
- 16.1.4 Rest of Middle East and Africa
- 17. Competitive Analysis
- 17.1. Global Market Share Analysis 2024
- 17.2. Company Profiles
- 17.2.1 Parallels International GmbH
- 17.2.1.1. Overview
- 17.2.1.2. Products
- 17.2.1.3. SWOT Analysis
- 17.2.1.4. Recent Developments
- 17.2.1.5. Financials (Based on Availability)
- 17.2.2 IBM Corporation
- 17.2.2.1. Overview
- 17.2.2.2. Products
- 17.2.2.3. SWOT Analysis
- 17.2.2.4. Recent Developments
- 17.2.2.5. Financials (Based on Availability)
- 17.2.3 Toshiba Corporation
- 17.2.3.1. Overview
- 17.2.3.2. Products
- 17.2.3.3. SWOT Analysis
- 17.2.3.4. Recent Developments
- 17.2.3.5. Financials (Based on Availability)
- 17.2.4 DELL Technologies Inc
- 17.2.4.1. Overview
- 17.2.4.2. Products
- 17.2.4.3. SWOT Analysis
- 17.2.4.4. Recent Developments
- 17.2.4.5. Financials (Based on Availability)
- 17.2.5 Microsoft Corporation
- 17.2.5.1. Overview
- 17.2.5.2. Products
- 17.2.5.3. SWOT Analysis
- 17.2.5.4. Recent Developments
- 17.2.5.5. Financials (Based on Availability)
- 17.2.6 Red Hat Inc
- 17.2.6.1. Overview
- 17.2.6.2. Products
- 17.2.6.3. SWOT Analysis
- 17.2.6.4. Recent Developments
- 17.2.6.5. Financials (Based on Availability)
- 17.2.7 NComputing Co Ltd
- 17.2.7.1. Overview
- 17.2.7.2. Products
- 17.2.7.3. SWOT Analysis
- 17.2.7.4. Recent Developments
- 17.2.7.5. Financials (Based on Availability)
- 17.2.8 Huawei Technologies Co Ltd
- 17.2.8.1. Overview
- 17.2.8.2. Products
- 17.2.8.3. SWOT Analysis
- 17.2.8.4. Recent Developments
- 17.2.8.5. Financials (Based on Availability)
- 17.2.9 Ericom Software Inc
- 17.2.9.1. Overview
- 17.2.9.2. Products
- 17.2.9.3. SWOT Analysis
- 17.2.9.4. Recent Developments
- 17.2.9.5. Financials (Based on Availability)
- 17.2.10 Citrix Systems Inc
- 17.2.10.1. Overview
- 17.2.10.2. Products
- 17.2.10.3. SWOT Analysis
- 17.2.10.4. Recent Developments
- 17.2.10.5. Financials (Based on Availability)
- 17.2.1 Parallels International GmbH
List of Figures
- Figure 1: Global Desktop Virtualization Market Revenue Breakdown (Million, %) by Region 2024 & 2032
- Figure 2: North America Desktop Virtualization Market Revenue (Million), by Country 2024 & 2032
- Figure 3: North America Desktop Virtualization Market Revenue Share (%), by Country 2024 & 2032
- Figure 4: Europe Desktop Virtualization Market Revenue (Million), by Country 2024 & 2032
- Figure 5: Europe Desktop Virtualization Market Revenue Share (%), by Country 2024 & 2032
- Figure 6: Asia Pacific Desktop Virtualization Market Revenue (Million), by Country 2024 & 2032
- Figure 7: Asia Pacific Desktop Virtualization Market Revenue Share (%), by Country 2024 & 2032
- Figure 8: South America Desktop Virtualization Market Revenue (Million), by Country 2024 & 2032
- Figure 9: South America Desktop Virtualization Market Revenue Share (%), by Country 2024 & 2032
- Figure 10: North America Desktop Virtualization Market Revenue (Million), by Country 2024 & 2032
- Figure 11: North America Desktop Virtualization Market Revenue Share (%), by Country 2024 & 2032
- Figure 12: MEA Desktop Virtualization Market Revenue (Million), by Country 2024 & 2032
- Figure 13: MEA Desktop Virtualization Market Revenue Share (%), by Country 2024 & 2032
- Figure 14: North America Desktop Virtualization Market Revenue (Million), by Desktop Delivery Platform 2024 & 2032
- Figure 15: North America Desktop Virtualization Market Revenue Share (%), by Desktop Delivery Platform 2024 & 2032
- Figure 16: North America Desktop Virtualization Market Revenue (Million), by Deployment Mode 2024 & 2032
- Figure 17: North America Desktop Virtualization Market Revenue Share (%), by Deployment Mode 2024 & 2032
- Figure 18: North America Desktop Virtualization Market Revenue (Million), by End-User Vertical 2024 & 2032
- Figure 19: North America Desktop Virtualization Market Revenue Share (%), by End-User Vertical 2024 & 2032
- Figure 20: North America Desktop Virtualization Market Revenue (Million), by Country 2024 & 2032
- Figure 21: North America Desktop Virtualization Market Revenue Share (%), by Country 2024 & 2032
- Figure 22: Europe Desktop Virtualization Market Revenue (Million), by Desktop Delivery Platform 2024 & 2032
- Figure 23: Europe Desktop Virtualization Market Revenue Share (%), by Desktop Delivery Platform 2024 & 2032
- Figure 24: Europe Desktop Virtualization Market Revenue (Million), by Deployment Mode 2024 & 2032
- Figure 25: Europe Desktop Virtualization Market Revenue Share (%), by Deployment Mode 2024 & 2032
- Figure 26: Europe Desktop Virtualization Market Revenue (Million), by End-User Vertical 2024 & 2032
- Figure 27: Europe Desktop Virtualization Market Revenue Share (%), by End-User Vertical 2024 & 2032
- Figure 28: Europe Desktop Virtualization Market Revenue (Million), by Country 2024 & 2032
- Figure 29: Europe Desktop Virtualization Market Revenue Share (%), by Country 2024 & 2032
- Figure 30: Asia Pacific Desktop Virtualization Market Revenue (Million), by Desktop Delivery Platform 2024 & 2032
- Figure 31: Asia Pacific Desktop Virtualization Market Revenue Share (%), by Desktop Delivery Platform 2024 & 2032
- Figure 32: Asia Pacific Desktop Virtualization Market Revenue (Million), by Deployment Mode 2024 & 2032
- Figure 33: Asia Pacific Desktop Virtualization Market Revenue Share (%), by Deployment Mode 2024 & 2032
- Figure 34: Asia Pacific Desktop Virtualization Market Revenue (Million), by End-User Vertical 2024 & 2032
- Figure 35: Asia Pacific Desktop Virtualization Market Revenue Share (%), by End-User Vertical 2024 & 2032
- Figure 36: Asia Pacific Desktop Virtualization Market Revenue (Million), by Country 2024 & 2032
- Figure 37: Asia Pacific Desktop Virtualization Market Revenue Share (%), by Country 2024 & 2032
- Figure 38: Latin America Desktop Virtualization Market Revenue (Million), by Desktop Delivery Platform 2024 & 2032
- Figure 39: Latin America Desktop Virtualization Market Revenue Share (%), by Desktop Delivery Platform 2024 & 2032
- Figure 40: Latin America Desktop Virtualization Market Revenue (Million), by Deployment Mode 2024 & 2032
- Figure 41: Latin America Desktop Virtualization Market Revenue Share (%), by Deployment Mode 2024 & 2032
- Figure 42: Latin America Desktop Virtualization Market Revenue (Million), by End-User Vertical 2024 & 2032
- Figure 43: Latin America Desktop Virtualization Market Revenue Share (%), by End-User Vertical 2024 & 2032
- Figure 44: Latin America Desktop Virtualization Market Revenue (Million), by Country 2024 & 2032
- Figure 45: Latin America Desktop Virtualization Market Revenue Share (%), by Country 2024 & 2032
- Figure 46: Middle East and Africa Desktop Virtualization Market Revenue (Million), by Desktop Delivery Platform 2024 & 2032
- Figure 47: Middle East and Africa Desktop Virtualization Market Revenue Share (%), by Desktop Delivery Platform 2024 & 2032
- Figure 48: Middle East and Africa Desktop Virtualization Market Revenue (Million), by Deployment Mode 2024 & 2032
- Figure 49: Middle East and Africa Desktop Virtualization Market Revenue Share (%), by Deployment Mode 2024 & 2032
- Figure 50: Middle East and Africa Desktop Virtualization Market Revenue (Million), by End-User Vertical 2024 & 2032
- Figure 51: Middle East and Africa Desktop Virtualization Market Revenue Share (%), by End-User Vertical 2024 & 2032
- Figure 52: Middle East and Africa Desktop Virtualization Market Revenue (Million), by Country 2024 & 2032
- Figure 53: Middle East and Africa Desktop Virtualization Market Revenue Share (%), by Country 2024 & 2032
List of Tables
- Table 1: Global Desktop Virtualization Market Revenue Million Forecast, by Region 2019 & 2032
- Table 2: Global Desktop Virtualization Market Revenue Million Forecast, by Desktop Delivery Platform 2019 & 2032
- Table 3: Global Desktop Virtualization Market Revenue Million Forecast, by Deployment Mode 2019 & 2032
- Table 4: Global Desktop Virtualization Market Revenue Million Forecast, by End-User Vertical 2019 & 2032
- Table 5: Global Desktop Virtualization Market Revenue Million Forecast, by Region 2019 & 2032
- Table 6: Global Desktop Virtualization Market Revenue Million Forecast, by Country 2019 & 2032
- Table 7: United States Desktop Virtualization Market Revenue (Million) Forecast, by Application 2019 & 2032
- Table 8: Canada Desktop Virtualization Market Revenue (Million) Forecast, by Application 2019 & 2032
- Table 9: Mexico Desktop Virtualization Market Revenue (Million) Forecast, by Application 2019 & 2032
- Table 10: Global Desktop Virtualization Market Revenue Million Forecast, by Country 2019 & 2032
- Table 11: Germany Desktop Virtualization Market Revenue (Million) Forecast, by Application 2019 & 2032
- Table 12: United Kingdom Desktop Virtualization Market Revenue (Million) Forecast, by Application 2019 & 2032
- Table 13: France Desktop Virtualization Market Revenue (Million) Forecast, by Application 2019 & 2032
- Table 14: Spain Desktop Virtualization Market Revenue (Million) Forecast, by Application 2019 & 2032
- Table 15: Italy Desktop Virtualization Market Revenue (Million) Forecast, by Application 2019 & 2032
- Table 16: Spain Desktop Virtualization Market Revenue (Million) Forecast, by Application 2019 & 2032
- Table 17: Belgium Desktop Virtualization Market Revenue (Million) Forecast, by Application 2019 & 2032
- Table 18: Netherland Desktop Virtualization Market Revenue (Million) Forecast, by Application 2019 & 2032
- Table 19: Nordics Desktop Virtualization Market Revenue (Million) Forecast, by Application 2019 & 2032
- Table 20: Rest of Europe Desktop Virtualization Market Revenue (Million) Forecast, by Application 2019 & 2032
- Table 21: Global Desktop Virtualization Market Revenue Million Forecast, by Country 2019 & 2032
- Table 22: China Desktop Virtualization Market Revenue (Million) Forecast, by Application 2019 & 2032
- Table 23: Japan Desktop Virtualization Market Revenue (Million) Forecast, by Application 2019 & 2032
- Table 24: India Desktop Virtualization Market Revenue (Million) Forecast, by Application 2019 & 2032
- Table 25: South Korea Desktop Virtualization Market Revenue (Million) Forecast, by Application 2019 & 2032
- Table 26: Southeast Asia Desktop Virtualization Market Revenue (Million) Forecast, by Application 2019 & 2032
- Table 27: Australia Desktop Virtualization Market Revenue (Million) Forecast, by Application 2019 & 2032
- Table 28: Indonesia Desktop Virtualization Market Revenue (Million) Forecast, by Application 2019 & 2032
- Table 29: Phillipes Desktop Virtualization Market Revenue (Million) Forecast, by Application 2019 & 2032
- Table 30: Singapore Desktop Virtualization Market Revenue (Million) Forecast, by Application 2019 & 2032
- Table 31: Thailandc Desktop Virtualization Market Revenue (Million) Forecast, by Application 2019 & 2032
- Table 32: Rest of Asia Pacific Desktop Virtualization Market Revenue (Million) Forecast, by Application 2019 & 2032
- Table 33: Global Desktop Virtualization Market Revenue Million Forecast, by Country 2019 & 2032
- Table 34: Brazil Desktop Virtualization Market Revenue (Million) Forecast, by Application 2019 & 2032
- Table 35: Argentina Desktop Virtualization Market Revenue (Million) Forecast, by Application 2019 & 2032
- Table 36: Peru Desktop Virtualization Market Revenue (Million) Forecast, by Application 2019 & 2032
- Table 37: Chile Desktop Virtualization Market Revenue (Million) Forecast, by Application 2019 & 2032
- Table 38: Colombia Desktop Virtualization Market Revenue (Million) Forecast, by Application 2019 & 2032
- Table 39: Ecuador Desktop Virtualization Market Revenue (Million) Forecast, by Application 2019 & 2032
- Table 40: Venezuela Desktop Virtualization Market Revenue (Million) Forecast, by Application 2019 & 2032
- Table 41: Rest of South America Desktop Virtualization Market Revenue (Million) Forecast, by Application 2019 & 2032
- Table 42: Global Desktop Virtualization Market Revenue Million Forecast, by Country 2019 & 2032
- Table 43: United States Desktop Virtualization Market Revenue (Million) Forecast, by Application 2019 & 2032
- Table 44: Canada Desktop Virtualization Market Revenue (Million) Forecast, by Application 2019 & 2032
- Table 45: Mexico Desktop Virtualization Market Revenue (Million) Forecast, by Application 2019 & 2032
- Table 46: Global Desktop Virtualization Market Revenue Million Forecast, by Country 2019 & 2032
- Table 47: United Arab Emirates Desktop Virtualization Market Revenue (Million) Forecast, by Application 2019 & 2032
- Table 48: Saudi Arabia Desktop Virtualization Market Revenue (Million) Forecast, by Application 2019 & 2032
- Table 49: South Africa Desktop Virtualization Market Revenue (Million) Forecast, by Application 2019 & 2032
- Table 50: Rest of Middle East and Africa Desktop Virtualization Market Revenue (Million) Forecast, by Application 2019 & 2032
- Table 51: Global Desktop Virtualization Market Revenue Million Forecast, by Desktop Delivery Platform 2019 & 2032
- Table 52: Global Desktop Virtualization Market Revenue Million Forecast, by Deployment Mode 2019 & 2032
- Table 53: Global Desktop Virtualization Market Revenue Million Forecast, by End-User Vertical 2019 & 2032
- Table 54: Global Desktop Virtualization Market Revenue Million Forecast, by Country 2019 & 2032
- Table 55: Global Desktop Virtualization Market Revenue Million Forecast, by Desktop Delivery Platform 2019 & 2032
- Table 56: Global Desktop Virtualization Market Revenue Million Forecast, by Deployment Mode 2019 & 2032
- Table 57: Global Desktop Virtualization Market Revenue Million Forecast, by End-User Vertical 2019 & 2032
- Table 58: Global Desktop Virtualization Market Revenue Million Forecast, by Country 2019 & 2032
- Table 59: Global Desktop Virtualization Market Revenue Million Forecast, by Desktop Delivery Platform 2019 & 2032
- Table 60: Global Desktop Virtualization Market Revenue Million Forecast, by Deployment Mode 2019 & 2032
- Table 61: Global Desktop Virtualization Market Revenue Million Forecast, by End-User Vertical 2019 & 2032
- Table 62: Global Desktop Virtualization Market Revenue Million Forecast, by Country 2019 & 2032
- Table 63: Global Desktop Virtualization Market Revenue Million Forecast, by Desktop Delivery Platform 2019 & 2032
- Table 64: Global Desktop Virtualization Market Revenue Million Forecast, by Deployment Mode 2019 & 2032
- Table 65: Global Desktop Virtualization Market Revenue Million Forecast, by End-User Vertical 2019 & 2032
- Table 66: Global Desktop Virtualization Market Revenue Million Forecast, by Country 2019 & 2032
- Table 67: Global Desktop Virtualization Market Revenue Million Forecast, by Desktop Delivery Platform 2019 & 2032
- Table 68: Global Desktop Virtualization Market Revenue Million Forecast, by Deployment Mode 2019 & 2032
- Table 69: Global Desktop Virtualization Market Revenue Million Forecast, by End-User Vertical 2019 & 2032
- Table 70: Global Desktop Virtualization Market Revenue Million Forecast, by Country 2019 & 2032
Frequently Asked Questions
1. What is the projected Compound Annual Growth Rate (CAGR) of the Desktop Virtualization Market?
The projected CAGR is approximately 10.60%.
2. Which companies are prominent players in the Desktop Virtualization Market?
Key companies in the market include Parallels International GmbH, IBM Corporation, Toshiba Corporation, DELL Technologies Inc, Microsoft Corporation, Red Hat Inc, NComputing Co Ltd, Huawei Technologies Co Ltd, Ericom Software Inc , Citrix Systems Inc.
3. What are the main segments of the Desktop Virtualization Market?
The market segments include Desktop Delivery Platform, Deployment Mode, End-User Vertical.
4. Can you provide details about the market size?
The market size is estimated to be USD 13.79 Million as of 2022.
5. What are some drivers contributing to market growth?
Increasing Demand for Bring Your Own Device; Growing Adoption of Cloud Computing.
6. What are the notable trends driving market growth?
Cloud Deployment Mode is Expected to Witness Significant Growth.
7. Are there any restraints impacting market growth?
Infrastructural Constraints.
8. Can you provide examples of recent developments in the market?
November 2023 - IGEL, a provider of the managed endpoint operating system for secured access to any digital workspace, and Imprivata announced the availability of an integrated solution for IGEL and Imprivata consumers that enables multi-factor authentication (MFA) and single sign-on (SSO) for clinicians accessing their virtual apps and desktops. The new IGEL Agent for Imprivata OneSign Enterprise Access Management enables and controls digital identities with secure, no-click access to Microsoft Azure Virtual Desktop (AVD) and Windows 365 Cloud PC cloud resources.
9. What pricing options are available for accessing the report?
Pricing options include single-user, multi-user, and enterprise licenses priced at USD 4750, USD 5250, and USD 8750 respectively.
10. Is the market size provided in terms of value or volume?
The market size is provided in terms of value, measured in Million.
11. Are there any specific market keywords associated with the report?
Yes, the market keyword associated with the report is "Desktop Virtualization Market," which aids in identifying and referencing the specific market segment covered.
12. How do I determine which pricing option suits my needs best?
The pricing options vary based on user requirements and access needs. Individual users may opt for single-user licenses, while businesses requiring broader access may choose multi-user or enterprise licenses for cost-effective access to the report.
13. Are there any additional resources or data provided in the Desktop Virtualization Market report?
While the report offers comprehensive insights, it's advisable to review the specific contents or supplementary materials provided to ascertain if additional resources or data are available.
14. How can I stay updated on further developments or reports in the Desktop Virtualization Market?
To stay informed about further developments, trends, and reports in the Desktop Virtualization Market, consider subscribing to industry newsletters, following relevant companies and organizations, or regularly checking reputable industry news sources and publications.
Methodology
Step 1 - Identification of Relevant Samples Size from Population Database


Step 2 - Approaches for Defining Global Market Size (Value, Volume* & Price*)

Note*: In applicable scenarios
Step 3 - Data Sources
Primary Research
- Web Analytics
- Survey Reports
- Research Institute
- Latest Research Reports
- Opinion Leaders
Secondary Research
- Annual Reports
- White Paper
- Latest Press Release
- Industry Association
- Paid Database
- Investor Presentations

Step 4 - Data Triangulation
Involves using different sources of information in order to increase the validity of a study
These sources are likely to be stakeholders in a program - participants, other researchers, program staff, other community members, and so on.
Then we put all data in single framework & apply various statistical tools to find out the dynamic on the market.
During the analysis stage, feedback from the stakeholder groups would be compared to determine areas of agreement as well as areas of divergence


