
Key Insights
The smart home security services market is experiencing robust growth, driven by increasing concerns about home safety, rising adoption of smart home devices, and the convenience offered by integrated security systems. A 24.10% CAGR from 2019 to 2024 suggests a significant expansion, and this momentum is expected to continue through 2033. The market is segmented by product (video surveillance, access control) and installation type (professional, self-installation), with professional installation currently holding a larger market share due to the complexity of some systems and the desire for expert setup and support. Key players like ADT, Honeywell, and Vivint are actively innovating and expanding their offerings, driving competition and fostering market growth. The North American market is currently dominant, benefiting from high levels of technological adoption and disposable income. However, the Asia-Pacific region shows significant potential for future expansion due to rapid urbanization and increasing internet penetration. The market's restraints include concerns about data privacy and security, the cost of initial investment and ongoing subscription fees, and the technical challenges associated with integrating various smart home devices. Nevertheless, the overall market trajectory remains positive, fueled by continuous technological advancements, the emergence of innovative service models, and a growing awareness of the benefits of smart home security.
The increasing affordability of smart home security systems and the growing integration with other smart home technologies like voice assistants and home automation platforms are major contributing factors to the market's expansion. The self-installation segment is gaining traction, offering a cost-effective alternative for tech-savvy consumers. However, the professional installation segment will remain vital for complex setups and ongoing maintenance. Further growth is expected from the development of advanced features such as AI-powered threat detection, proactive security alerts, and remote monitoring capabilities. Government initiatives promoting smart city infrastructure and public safety are also expected to indirectly boost market growth. Companies are increasingly focusing on developing user-friendly interfaces and cloud-based platforms to enhance customer experience and improve system manageability.
Smart Home Security Services Industry Report: A Comprehensive Market Analysis (2019-2033)
This comprehensive report provides an in-depth analysis of the Smart Home Security Services industry, projecting a market size exceeding $XX Million by 2033. The report covers the period from 2019 to 2033, with a base year of 2025 and a forecast period of 2025-2033. This crucial resource is designed for industry professionals, investors, and strategists seeking actionable insights into this rapidly evolving market.
Smart Home Security Services Industry Market Structure & Innovation Trends
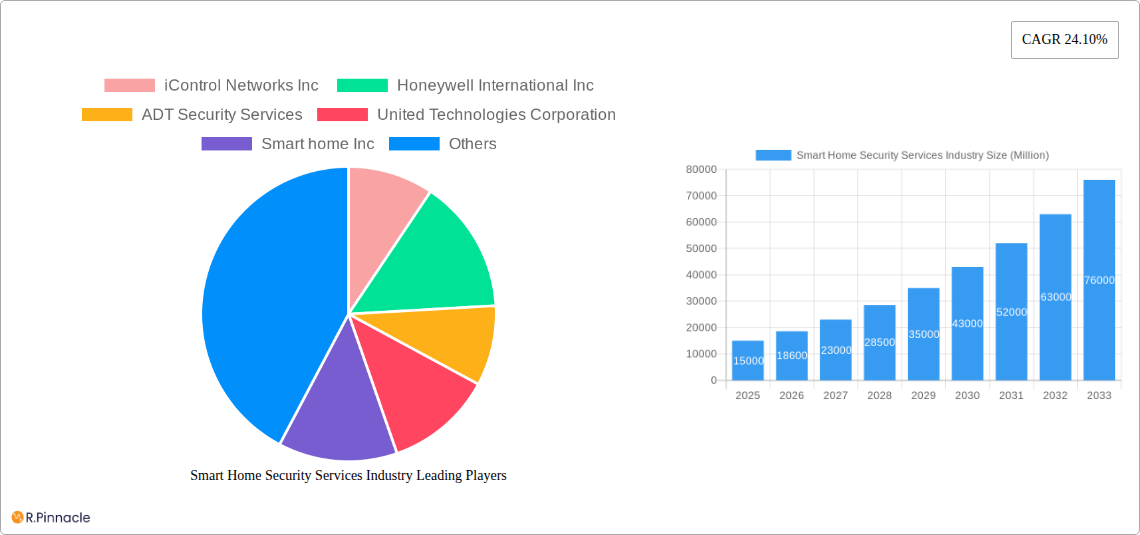
The smart home security services market exhibits moderate concentration, with key players like Honeywell International Inc, ADT Security Services, and Comcast Corporation holding significant market share (estimated at xx%, xx%, and xx% respectively in 2025). However, the market is witnessing increasing competition from smaller, agile companies focused on niche segments and innovative solutions.
- Innovation Drivers: The rise of IoT, AI-powered features (e.g., facial recognition, anomaly detection), and cloud-based platforms are major drivers. Increased consumer demand for seamless integration with other smart home devices fuels innovation.
- Regulatory Frameworks: Government regulations concerning data privacy and security standards significantly influence market dynamics. Compliance costs and data breach liabilities are key concerns.
- Product Substitutes: Traditional security systems and DIY security solutions pose some level of competition.
- End-User Demographics: The target audience is expanding beyond homeowners to include renters and businesses with increasing adoption in multi-family dwellings.
- M&A Activities: The industry has witnessed significant M&A activity in recent years, with deal values totaling over $XX Million between 2019 and 2024. These mergers often aim to consolidate market share, expand product portfolios, and enhance technological capabilities. Examples include (but are not limited to) acquisitions involving companies focused on integrating smart security with broader smart home ecosystems.
Smart Home Security Services Industry Market Dynamics & Trends
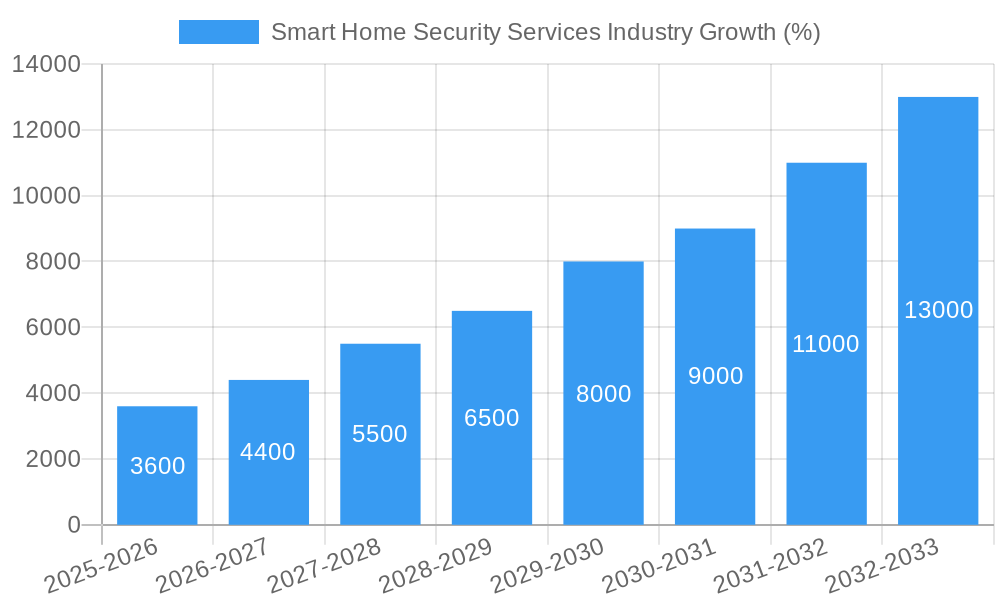
The smart home security services market is experiencing robust growth, driven by escalating consumer concerns about home security, rising disposable incomes, and increasing adoption of smart home technology. The market is expected to exhibit a CAGR of xx% during the forecast period (2025-2033). Technological disruptions, such as the integration of AI and machine learning, are revolutionizing the industry, enhancing the effectiveness and capabilities of security systems. Consumer preferences are shifting towards seamless integration, intuitive interfaces, and advanced features like remote monitoring and automation. Competitive dynamics are characterized by intense rivalry among established players and the emergence of new entrants offering innovative solutions. Market penetration is gradually increasing, with a projected xx% of households equipped with smart home security systems by 2033.
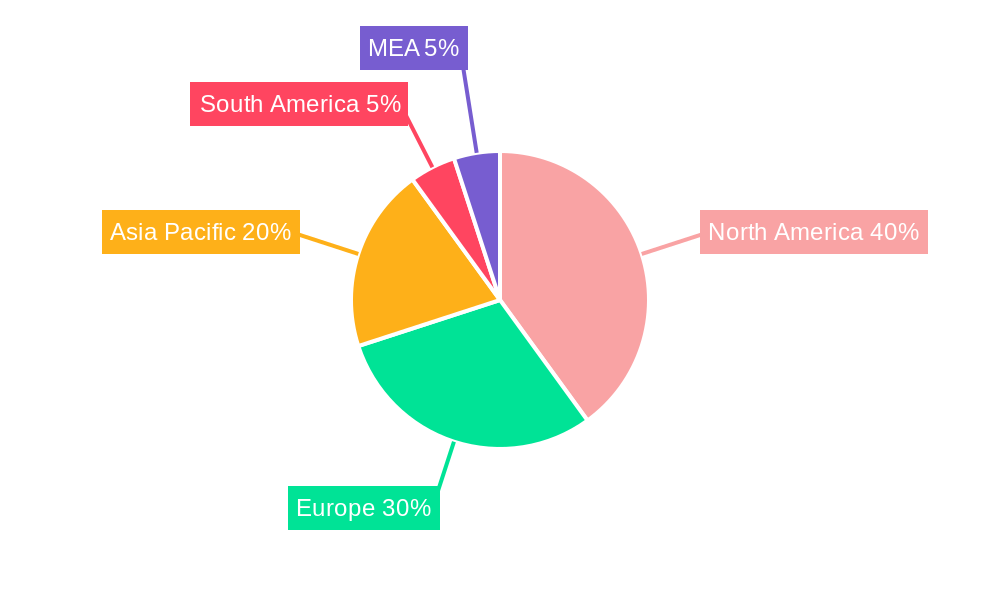
Dominant Regions & Segments in Smart Home Security Services Industry
North America currently holds the largest market share in the smart home security services industry, driven by factors such as high disposable income, early adoption of technology, and robust technological infrastructure.
Key Drivers in North America:
- Strong technological infrastructure and high internet penetration.
- High consumer awareness and demand for smart home security.
- Favorable regulatory environment promoting innovation.
- Significant investments in R&D by established players.
Product Segments: Video surveillance holds the largest share due to its widespread adoption, followed by access control systems. Self-installation is gaining traction due to cost-effectiveness and ease of use, although professional installation retains a larger market share for complex systems.
Detailed Dominance Analysis: North America's dominance stems from its early adoption of smart home technology, a high level of disposable income, and a favorable regulatory environment that encourages innovation. However, other regions such as Europe and Asia-Pacific are demonstrating rapid growth, driven by increasing urbanization, rising concerns about home security, and government initiatives promoting the use of smart technologies.
Smart Home Security Services Industry Product Innovations
Recent product developments emphasize seamless integration with other smart home devices, AI-powered features (e.g., facial recognition, intelligent alerts), and enhanced cloud-based services for remote monitoring and management. The market is witnessing the emergence of DIY solutions along with professional installation services catering to varying consumer needs and preferences. These innovations provide increased convenience, enhanced security, and greater cost-effectiveness for consumers.
Report Scope & Segmentation Analysis
This report segments the smart home security services market by product (video surveillance, access control), and installation type (professional, self-installation).
Video Surveillance: This segment is experiencing significant growth, driven by the increasing demand for high-resolution cameras, advanced analytics, and cloud-based storage solutions.
Access Control: This segment encompasses various technologies, including smart locks, keypads, and biometric systems. Growth in this segment is influenced by the increasing demand for enhanced security and remote access control.
Professional Installation: This segment dominates the market due to its benefits in terms of system complexity and reliability.
Self-Installation: This segment is growing rapidly, driven by the availability of user-friendly solutions and cost-effectiveness.
Each segment exhibits distinct growth trajectories and competitive dynamics, analyzed in detail within the report.
Key Drivers of Smart Home Security Services Industry Growth
Several factors propel growth in this sector. Rising concerns about home security and personal safety are a major driver, fueled by increasing crime rates and awareness of cyber threats. Technological advancements, particularly in AI, IoT, and cloud computing, enhance system capabilities, leading to wider adoption. Government initiatives and favorable regulatory frameworks support market expansion. Finally, increased disposable incomes in developing economies stimulate demand for advanced security solutions.
Challenges in the Smart Home Security Services Industry Sector
The smart home security services industry faces challenges such as high initial investment costs, concerns about data privacy and security breaches, the need for reliable internet connectivity, and competition from traditional security systems. Supply chain disruptions, especially during times of economic instability, can also significantly impact the production and delivery of smart security systems. Furthermore, complex integration with various smart home ecosystems and ensuring interoperability can pose significant technical obstacles.
Emerging Opportunities in Smart Home Security Services Industry
Emerging opportunities include expansion into new markets (particularly developing economies), development of integrated security and automation systems, and integration with other smart home technologies (like voice assistants). The demand for AI-driven features like predictive analytics and anomaly detection is creating opportunities for technological advancements and improved service offerings. Customized security solutions tailored to specific customer needs also present a promising avenue for growth.
Leading Players in the Smart Home Security Services Industry Market
- iControl Networks Inc
- Honeywell International Inc
- ADT Security Services
- United Technologies Corporation
- Smart home Inc
- Comcast Corporation
- Vivint Inc
- Tyco Security Products
- Control4 Corporation
- AT&T Inc
Key Developments in Smart Home Security Services Industry
- June 2020: Swann launched the Swann Wire-Free Security Camera, a DIY solution boosting the self-installation segment.
- September 2020: Hangzhou Hikvision Digital Technology Co. Ltd launched Hik-ProConnect, a cloud-based solution enhancing professional services and system management capabilities.
Future Outlook for Smart Home Security Services Industry Market
The smart home security services market is poised for significant expansion, driven by continuous technological innovations, increasing consumer awareness, and favorable regulatory environments. Strategic partnerships and acquisitions will likely shape the industry landscape, with a focus on expanding product portfolios and integrating security solutions with broader smart home ecosystems. The market will witness greater adoption of AI-powered features and cloud-based services, leading to enhanced security, convenience, and cost-effectiveness for consumers.
Smart Home Security Services Industry Segmentation
-
1. Product
-
1.1. Video Surveillance
- 1.1.1. Security Cameras
- 1.1.2. Monitors
- 1.1.3. Storage Devices
- 1.1.4. Others
-
1.2. Access Control
- 1.2.1. Facial Recognition
- 1.2.2. Fingerprint Recognition
- 1.2.3. Iris Recognition
-
1.1. Video Surveillance
-
2. Installation
- 2.1. Professional Installation
- 2.2. Self-installation
Smart Home Security Services Industry Segmentation By Geography
-
1. North America
- 1.1. United States
- 1.2. Canada
-
2. Europe
- 2.1. United Kingdom
- 2.2. Germany
- 2.3. France
- 2.4. Rest of Europe
-
3. Asia Pacific
- 3.1. China
- 3.2. Japan
- 3.3. India
- 3.4. Rest of Asia Pacific
-
4. Middle East and Africa
- 4.1. Saudi Arabia
- 4.2. United Arab Emirates
- 4.3. Rest of Middle East and Africa
-
5. Latin America
- 5.1. Brazil
- 5.2. Mexico
- 5.3. Rest of Latin America
Smart Home Security Services Industry REPORT HIGHLIGHTS
| Aspects | Details |
|---|---|
| Study Period | 2019-2033 |
| Base Year | 2024 |
| Estimated Year | 2025 |
| Forecast Period | 2025-2033 |
| Historical Period | 2019-2024 |
| Growth Rate | CAGR of 24.10% from 2019-2033 |
| Segmentation |
|
Table of Contents
- 1. Introduction
- 1.1. Research Scope
- 1.2. Market Segmentation
- 1.3. Research Methodology
- 1.4. Definitions and Assumptions
- 2. Executive Summary
- 2.1. Introduction
- 3. Market Dynamics
- 3.1. Introduction
- 3.2. Market Drivers
- 3.2.1. Growing Safety Concerns; Decreasing Costs of Sensors
- 3.3. Market Restrains
- 3.3.1. High Installation Costs
- 3.4. Market Trends
- 3.4.1. Video Surveillance systems are expected to register significant growth in forecasted period
- 4. Market Factor Analysis
- 4.1. Porters Five Forces
- 4.2. Supply/Value Chain
- 4.3. PESTEL analysis
- 4.4. Market Entropy
- 4.5. Patent/Trademark Analysis
- 5. Global Smart Home Security Services Industry Analysis, Insights and Forecast, 2019-2031
- 5.1. Market Analysis, Insights and Forecast - by Product
- 5.1.1. Video Surveillance
- 5.1.1.1. Security Cameras
- 5.1.1.2. Monitors
- 5.1.1.3. Storage Devices
- 5.1.1.4. Others
- 5.1.2. Access Control
- 5.1.2.1. Facial Recognition
- 5.1.2.2. Fingerprint Recognition
- 5.1.2.3. Iris Recognition
- 5.1.1. Video Surveillance
- 5.2. Market Analysis, Insights and Forecast - by Installation
- 5.2.1. Professional Installation
- 5.2.2. Self-installation
- 5.3. Market Analysis, Insights and Forecast - by Region
- 5.3.1. North America
- 5.3.2. Europe
- 5.3.3. Asia Pacific
- 5.3.4. Middle East and Africa
- 5.3.5. Latin America
- 5.1. Market Analysis, Insights and Forecast - by Product
- 6. North America Smart Home Security Services Industry Analysis, Insights and Forecast, 2019-2031
- 6.1. Market Analysis, Insights and Forecast - by Product
- 6.1.1. Video Surveillance
- 6.1.1.1. Security Cameras
- 6.1.1.2. Monitors
- 6.1.1.3. Storage Devices
- 6.1.1.4. Others
- 6.1.2. Access Control
- 6.1.2.1. Facial Recognition
- 6.1.2.2. Fingerprint Recognition
- 6.1.2.3. Iris Recognition
- 6.1.1. Video Surveillance
- 6.2. Market Analysis, Insights and Forecast - by Installation
- 6.2.1. Professional Installation
- 6.2.2. Self-installation
- 6.1. Market Analysis, Insights and Forecast - by Product
- 7. Europe Smart Home Security Services Industry Analysis, Insights and Forecast, 2019-2031
- 7.1. Market Analysis, Insights and Forecast - by Product
- 7.1.1. Video Surveillance
- 7.1.1.1. Security Cameras
- 7.1.1.2. Monitors
- 7.1.1.3. Storage Devices
- 7.1.1.4. Others
- 7.1.2. Access Control
- 7.1.2.1. Facial Recognition
- 7.1.2.2. Fingerprint Recognition
- 7.1.2.3. Iris Recognition
- 7.1.1. Video Surveillance
- 7.2. Market Analysis, Insights and Forecast - by Installation
- 7.2.1. Professional Installation
- 7.2.2. Self-installation
- 7.1. Market Analysis, Insights and Forecast - by Product
- 8. Asia Pacific Smart Home Security Services Industry Analysis, Insights and Forecast, 2019-2031
- 8.1. Market Analysis, Insights and Forecast - by Product
- 8.1.1. Video Surveillance
- 8.1.1.1. Security Cameras
- 8.1.1.2. Monitors
- 8.1.1.3. Storage Devices
- 8.1.1.4. Others
- 8.1.2. Access Control
- 8.1.2.1. Facial Recognition
- 8.1.2.2. Fingerprint Recognition
- 8.1.2.3. Iris Recognition
- 8.1.1. Video Surveillance
- 8.2. Market Analysis, Insights and Forecast - by Installation
- 8.2.1. Professional Installation
- 8.2.2. Self-installation
- 8.1. Market Analysis, Insights and Forecast - by Product
- 9. Middle East and Africa Smart Home Security Services Industry Analysis, Insights and Forecast, 2019-2031
- 9.1. Market Analysis, Insights and Forecast - by Product
- 9.1.1. Video Surveillance
- 9.1.1.1. Security Cameras
- 9.1.1.2. Monitors
- 9.1.1.3. Storage Devices
- 9.1.1.4. Others
- 9.1.2. Access Control
- 9.1.2.1. Facial Recognition
- 9.1.2.2. Fingerprint Recognition
- 9.1.2.3. Iris Recognition
- 9.1.1. Video Surveillance
- 9.2. Market Analysis, Insights and Forecast - by Installation
- 9.2.1. Professional Installation
- 9.2.2. Self-installation
- 9.1. Market Analysis, Insights and Forecast - by Product
- 10. Latin America Smart Home Security Services Industry Analysis, Insights and Forecast, 2019-2031
- 10.1. Market Analysis, Insights and Forecast - by Product
- 10.1.1. Video Surveillance
- 10.1.1.1. Security Cameras
- 10.1.1.2. Monitors
- 10.1.1.3. Storage Devices
- 10.1.1.4. Others
- 10.1.2. Access Control
- 10.1.2.1. Facial Recognition
- 10.1.2.2. Fingerprint Recognition
- 10.1.2.3. Iris Recognition
- 10.1.1. Video Surveillance
- 10.2. Market Analysis, Insights and Forecast - by Installation
- 10.2.1. Professional Installation
- 10.2.2. Self-installation
- 10.1. Market Analysis, Insights and Forecast - by Product
- 11. North America Smart Home Security Services Industry Analysis, Insights and Forecast, 2019-2031
- 11.1. Market Analysis, Insights and Forecast - By Country/Sub-region
- 11.1.1. undefined
- 12. Europe Smart Home Security Services Industry Analysis, Insights and Forecast, 2019-2031
- 12.1. Market Analysis, Insights and Forecast - By Country/Sub-region
- 12.1.1. undefined
- 13. Asia Pacific Smart Home Security Services Industry Analysis, Insights and Forecast, 2019-2031
- 13.1. Market Analysis, Insights and Forecast - By Country/Sub-region
- 13.1.1. undefined
- 14. South America Smart Home Security Services Industry Analysis, Insights and Forecast, 2019-2031
- 14.1. Market Analysis, Insights and Forecast - By Country/Sub-region
- 14.1.1. undefined
- 15. North America Smart Home Security Services Industry Analysis, Insights and Forecast, 2019-2031
- 15.1. Market Analysis, Insights and Forecast - By Country/Sub-region
- 15.1.1. undefined
- 16. MEA Smart Home Security Services Industry Analysis, Insights and Forecast, 2019-2031
- 16.1. Market Analysis, Insights and Forecast - By Country/Sub-region
- 16.1.1. undefined
- 17. Competitive Analysis
- 17.1. Global Market Share Analysis 2024
- 17.2. Company Profiles
- 17.2.1 iControl Networks Inc
- 17.2.1.1. Overview
- 17.2.1.2. Products
- 17.2.1.3. SWOT Analysis
- 17.2.1.4. Recent Developments
- 17.2.1.5. Financials (Based on Availability)
- 17.2.2 Honeywell International Inc
- 17.2.2.1. Overview
- 17.2.2.2. Products
- 17.2.2.3. SWOT Analysis
- 17.2.2.4. Recent Developments
- 17.2.2.5. Financials (Based on Availability)
- 17.2.3 ADT Security Services
- 17.2.3.1. Overview
- 17.2.3.2. Products
- 17.2.3.3. SWOT Analysis
- 17.2.3.4. Recent Developments
- 17.2.3.5. Financials (Based on Availability)
- 17.2.4 United Technologies Corporation
- 17.2.4.1. Overview
- 17.2.4.2. Products
- 17.2.4.3. SWOT Analysis
- 17.2.4.4. Recent Developments
- 17.2.4.5. Financials (Based on Availability)
- 17.2.5 Smart home Inc
- 17.2.5.1. Overview
- 17.2.5.2. Products
- 17.2.5.3. SWOT Analysis
- 17.2.5.4. Recent Developments
- 17.2.5.5. Financials (Based on Availability)
- 17.2.6 Comcast Corporation
- 17.2.6.1. Overview
- 17.2.6.2. Products
- 17.2.6.3. SWOT Analysis
- 17.2.6.4. Recent Developments
- 17.2.6.5. Financials (Based on Availability)
- 17.2.7 Vivint Inc
- 17.2.7.1. Overview
- 17.2.7.2. Products
- 17.2.7.3. SWOT Analysis
- 17.2.7.4. Recent Developments
- 17.2.7.5. Financials (Based on Availability)
- 17.2.8 Tyco Security Products
- 17.2.8.1. Overview
- 17.2.8.2. Products
- 17.2.8.3. SWOT Analysis
- 17.2.8.4. Recent Developments
- 17.2.8.5. Financials (Based on Availability)
- 17.2.9 Control4 Corporation
- 17.2.9.1. Overview
- 17.2.9.2. Products
- 17.2.9.3. SWOT Analysis
- 17.2.9.4. Recent Developments
- 17.2.9.5. Financials (Based on Availability)
- 17.2.10 AT&T Inc
- 17.2.10.1. Overview
- 17.2.10.2. Products
- 17.2.10.3. SWOT Analysis
- 17.2.10.4. Recent Developments
- 17.2.10.5. Financials (Based on Availability)
- 17.2.1 iControl Networks Inc
List of Figures
- Figure 1: Global Smart Home Security Services Industry Revenue Breakdown (Million, %) by Region 2024 & 2032
- Figure 2: Global Smart Home Security Services Industry Volume Breakdown (K Unit, %) by Region 2024 & 2032
- Figure 3: North America Smart Home Security Services Industry Revenue (Million), by Country 2024 & 2032
- Figure 4: North America Smart Home Security Services Industry Volume (K Unit), by Country 2024 & 2032
- Figure 5: North America Smart Home Security Services Industry Revenue Share (%), by Country 2024 & 2032
- Figure 6: North America Smart Home Security Services Industry Volume Share (%), by Country 2024 & 2032
- Figure 7: Europe Smart Home Security Services Industry Revenue (Million), by Country 2024 & 2032
- Figure 8: Europe Smart Home Security Services Industry Volume (K Unit), by Country 2024 & 2032
- Figure 9: Europe Smart Home Security Services Industry Revenue Share (%), by Country 2024 & 2032
- Figure 10: Europe Smart Home Security Services Industry Volume Share (%), by Country 2024 & 2032
- Figure 11: Asia Pacific Smart Home Security Services Industry Revenue (Million), by Country 2024 & 2032
- Figure 12: Asia Pacific Smart Home Security Services Industry Volume (K Unit), by Country 2024 & 2032
- Figure 13: Asia Pacific Smart Home Security Services Industry Revenue Share (%), by Country 2024 & 2032
- Figure 14: Asia Pacific Smart Home Security Services Industry Volume Share (%), by Country 2024 & 2032
- Figure 15: South America Smart Home Security Services Industry Revenue (Million), by Country 2024 & 2032
- Figure 16: South America Smart Home Security Services Industry Volume (K Unit), by Country 2024 & 2032
- Figure 17: South America Smart Home Security Services Industry Revenue Share (%), by Country 2024 & 2032
- Figure 18: South America Smart Home Security Services Industry Volume Share (%), by Country 2024 & 2032
- Figure 19: North America Smart Home Security Services Industry Revenue (Million), by Country 2024 & 2032
- Figure 20: North America Smart Home Security Services Industry Volume (K Unit), by Country 2024 & 2032
- Figure 21: North America Smart Home Security Services Industry Revenue Share (%), by Country 2024 & 2032
- Figure 22: North America Smart Home Security Services Industry Volume Share (%), by Country 2024 & 2032
- Figure 23: MEA Smart Home Security Services Industry Revenue (Million), by Country 2024 & 2032
- Figure 24: MEA Smart Home Security Services Industry Volume (K Unit), by Country 2024 & 2032
- Figure 25: MEA Smart Home Security Services Industry Revenue Share (%), by Country 2024 & 2032
- Figure 26: MEA Smart Home Security Services Industry Volume Share (%), by Country 2024 & 2032
- Figure 27: North America Smart Home Security Services Industry Revenue (Million), by Product 2024 & 2032
- Figure 28: North America Smart Home Security Services Industry Volume (K Unit), by Product 2024 & 2032
- Figure 29: North America Smart Home Security Services Industry Revenue Share (%), by Product 2024 & 2032
- Figure 30: North America Smart Home Security Services Industry Volume Share (%), by Product 2024 & 2032
- Figure 31: North America Smart Home Security Services Industry Revenue (Million), by Installation 2024 & 2032
- Figure 32: North America Smart Home Security Services Industry Volume (K Unit), by Installation 2024 & 2032
- Figure 33: North America Smart Home Security Services Industry Revenue Share (%), by Installation 2024 & 2032
- Figure 34: North America Smart Home Security Services Industry Volume Share (%), by Installation 2024 & 2032
- Figure 35: North America Smart Home Security Services Industry Revenue (Million), by Country 2024 & 2032
- Figure 36: North America Smart Home Security Services Industry Volume (K Unit), by Country 2024 & 2032
- Figure 37: North America Smart Home Security Services Industry Revenue Share (%), by Country 2024 & 2032
- Figure 38: North America Smart Home Security Services Industry Volume Share (%), by Country 2024 & 2032
- Figure 39: Europe Smart Home Security Services Industry Revenue (Million), by Product 2024 & 2032
- Figure 40: Europe Smart Home Security Services Industry Volume (K Unit), by Product 2024 & 2032
- Figure 41: Europe Smart Home Security Services Industry Revenue Share (%), by Product 2024 & 2032
- Figure 42: Europe Smart Home Security Services Industry Volume Share (%), by Product 2024 & 2032
- Figure 43: Europe Smart Home Security Services Industry Revenue (Million), by Installation 2024 & 2032
- Figure 44: Europe Smart Home Security Services Industry Volume (K Unit), by Installation 2024 & 2032
- Figure 45: Europe Smart Home Security Services Industry Revenue Share (%), by Installation 2024 & 2032
- Figure 46: Europe Smart Home Security Services Industry Volume Share (%), by Installation 2024 & 2032
- Figure 47: Europe Smart Home Security Services Industry Revenue (Million), by Country 2024 & 2032
- Figure 48: Europe Smart Home Security Services Industry Volume (K Unit), by Country 2024 & 2032
- Figure 49: Europe Smart Home Security Services Industry Revenue Share (%), by Country 2024 & 2032
- Figure 50: Europe Smart Home Security Services Industry Volume Share (%), by Country 2024 & 2032
- Figure 51: Asia Pacific Smart Home Security Services Industry Revenue (Million), by Product 2024 & 2032
- Figure 52: Asia Pacific Smart Home Security Services Industry Volume (K Unit), by Product 2024 & 2032
- Figure 53: Asia Pacific Smart Home Security Services Industry Revenue Share (%), by Product 2024 & 2032
- Figure 54: Asia Pacific Smart Home Security Services Industry Volume Share (%), by Product 2024 & 2032
- Figure 55: Asia Pacific Smart Home Security Services Industry Revenue (Million), by Installation 2024 & 2032
- Figure 56: Asia Pacific Smart Home Security Services Industry Volume (K Unit), by Installation 2024 & 2032
- Figure 57: Asia Pacific Smart Home Security Services Industry Revenue Share (%), by Installation 2024 & 2032
- Figure 58: Asia Pacific Smart Home Security Services Industry Volume Share (%), by Installation 2024 & 2032
- Figure 59: Asia Pacific Smart Home Security Services Industry Revenue (Million), by Country 2024 & 2032
- Figure 60: Asia Pacific Smart Home Security Services Industry Volume (K Unit), by Country 2024 & 2032
- Figure 61: Asia Pacific Smart Home Security Services Industry Revenue Share (%), by Country 2024 & 2032
- Figure 62: Asia Pacific Smart Home Security Services Industry Volume Share (%), by Country 2024 & 2032
- Figure 63: Middle East and Africa Smart Home Security Services Industry Revenue (Million), by Product 2024 & 2032
- Figure 64: Middle East and Africa Smart Home Security Services Industry Volume (K Unit), by Product 2024 & 2032
- Figure 65: Middle East and Africa Smart Home Security Services Industry Revenue Share (%), by Product 2024 & 2032
- Figure 66: Middle East and Africa Smart Home Security Services Industry Volume Share (%), by Product 2024 & 2032
- Figure 67: Middle East and Africa Smart Home Security Services Industry Revenue (Million), by Installation 2024 & 2032
- Figure 68: Middle East and Africa Smart Home Security Services Industry Volume (K Unit), by Installation 2024 & 2032
- Figure 69: Middle East and Africa Smart Home Security Services Industry Revenue Share (%), by Installation 2024 & 2032
- Figure 70: Middle East and Africa Smart Home Security Services Industry Volume Share (%), by Installation 2024 & 2032
- Figure 71: Middle East and Africa Smart Home Security Services Industry Revenue (Million), by Country 2024 & 2032
- Figure 72: Middle East and Africa Smart Home Security Services Industry Volume (K Unit), by Country 2024 & 2032
- Figure 73: Middle East and Africa Smart Home Security Services Industry Revenue Share (%), by Country 2024 & 2032
- Figure 74: Middle East and Africa Smart Home Security Services Industry Volume Share (%), by Country 2024 & 2032
- Figure 75: Latin America Smart Home Security Services Industry Revenue (Million), by Product 2024 & 2032
- Figure 76: Latin America Smart Home Security Services Industry Volume (K Unit), by Product 2024 & 2032
- Figure 77: Latin America Smart Home Security Services Industry Revenue Share (%), by Product 2024 & 2032
- Figure 78: Latin America Smart Home Security Services Industry Volume Share (%), by Product 2024 & 2032
- Figure 79: Latin America Smart Home Security Services Industry Revenue (Million), by Installation 2024 & 2032
- Figure 80: Latin America Smart Home Security Services Industry Volume (K Unit), by Installation 2024 & 2032
- Figure 81: Latin America Smart Home Security Services Industry Revenue Share (%), by Installation 2024 & 2032
- Figure 82: Latin America Smart Home Security Services Industry Volume Share (%), by Installation 2024 & 2032
- Figure 83: Latin America Smart Home Security Services Industry Revenue (Million), by Country 2024 & 2032
- Figure 84: Latin America Smart Home Security Services Industry Volume (K Unit), by Country 2024 & 2032
- Figure 85: Latin America Smart Home Security Services Industry Revenue Share (%), by Country 2024 & 2032
- Figure 86: Latin America Smart Home Security Services Industry Volume Share (%), by Country 2024 & 2032
List of Tables
- Table 1: Global Smart Home Security Services Industry Revenue Million Forecast, by Region 2019 & 2032
- Table 2: Global Smart Home Security Services Industry Volume K Unit Forecast, by Region 2019 & 2032
- Table 3: Global Smart Home Security Services Industry Revenue Million Forecast, by Product 2019 & 2032
- Table 4: Global Smart Home Security Services Industry Volume K Unit Forecast, by Product 2019 & 2032
- Table 5: Global Smart Home Security Services Industry Revenue Million Forecast, by Installation 2019 & 2032
- Table 6: Global Smart Home Security Services Industry Volume K Unit Forecast, by Installation 2019 & 2032
- Table 7: Global Smart Home Security Services Industry Revenue Million Forecast, by Region 2019 & 2032
- Table 8: Global Smart Home Security Services Industry Volume K Unit Forecast, by Region 2019 & 2032
- Table 9: Global Smart Home Security Services Industry Revenue Million Forecast, by Country 2019 & 2032
- Table 10: Global Smart Home Security Services Industry Volume K Unit Forecast, by Country 2019 & 2032
- Table 11: Global Smart Home Security Services Industry Revenue Million Forecast, by Country 2019 & 2032
- Table 12: Global Smart Home Security Services Industry Volume K Unit Forecast, by Country 2019 & 2032
- Table 13: Global Smart Home Security Services Industry Revenue Million Forecast, by Country 2019 & 2032
- Table 14: Global Smart Home Security Services Industry Volume K Unit Forecast, by Country 2019 & 2032
- Table 15: Global Smart Home Security Services Industry Revenue Million Forecast, by Country 2019 & 2032
- Table 16: Global Smart Home Security Services Industry Volume K Unit Forecast, by Country 2019 & 2032
- Table 17: Global Smart Home Security Services Industry Revenue Million Forecast, by Country 2019 & 2032
- Table 18: Global Smart Home Security Services Industry Volume K Unit Forecast, by Country 2019 & 2032
- Table 19: Global Smart Home Security Services Industry Revenue Million Forecast, by Country 2019 & 2032
- Table 20: Global Smart Home Security Services Industry Volume K Unit Forecast, by Country 2019 & 2032
- Table 21: Global Smart Home Security Services Industry Revenue Million Forecast, by Product 2019 & 2032
- Table 22: Global Smart Home Security Services Industry Volume K Unit Forecast, by Product 2019 & 2032
- Table 23: Global Smart Home Security Services Industry Revenue Million Forecast, by Installation 2019 & 2032
- Table 24: Global Smart Home Security Services Industry Volume K Unit Forecast, by Installation 2019 & 2032
- Table 25: Global Smart Home Security Services Industry Revenue Million Forecast, by Country 2019 & 2032
- Table 26: Global Smart Home Security Services Industry Volume K Unit Forecast, by Country 2019 & 2032
- Table 27: United States Smart Home Security Services Industry Revenue (Million) Forecast, by Application 2019 & 2032
- Table 28: United States Smart Home Security Services Industry Volume (K Unit) Forecast, by Application 2019 & 2032
- Table 29: Canada Smart Home Security Services Industry Revenue (Million) Forecast, by Application 2019 & 2032
- Table 30: Canada Smart Home Security Services Industry Volume (K Unit) Forecast, by Application 2019 & 2032
- Table 31: Global Smart Home Security Services Industry Revenue Million Forecast, by Product 2019 & 2032
- Table 32: Global Smart Home Security Services Industry Volume K Unit Forecast, by Product 2019 & 2032
- Table 33: Global Smart Home Security Services Industry Revenue Million Forecast, by Installation 2019 & 2032
- Table 34: Global Smart Home Security Services Industry Volume K Unit Forecast, by Installation 2019 & 2032
- Table 35: Global Smart Home Security Services Industry Revenue Million Forecast, by Country 2019 & 2032
- Table 36: Global Smart Home Security Services Industry Volume K Unit Forecast, by Country 2019 & 2032
- Table 37: United Kingdom Smart Home Security Services Industry Revenue (Million) Forecast, by Application 2019 & 2032
- Table 38: United Kingdom Smart Home Security Services Industry Volume (K Unit) Forecast, by Application 2019 & 2032
- Table 39: Germany Smart Home Security Services Industry Revenue (Million) Forecast, by Application 2019 & 2032
- Table 40: Germany Smart Home Security Services Industry Volume (K Unit) Forecast, by Application 2019 & 2032
- Table 41: France Smart Home Security Services Industry Revenue (Million) Forecast, by Application 2019 & 2032
- Table 42: France Smart Home Security Services Industry Volume (K Unit) Forecast, by Application 2019 & 2032
- Table 43: Rest of Europe Smart Home Security Services Industry Revenue (Million) Forecast, by Application 2019 & 2032
- Table 44: Rest of Europe Smart Home Security Services Industry Volume (K Unit) Forecast, by Application 2019 & 2032
- Table 45: Global Smart Home Security Services Industry Revenue Million Forecast, by Product 2019 & 2032
- Table 46: Global Smart Home Security Services Industry Volume K Unit Forecast, by Product 2019 & 2032
- Table 47: Global Smart Home Security Services Industry Revenue Million Forecast, by Installation 2019 & 2032
- Table 48: Global Smart Home Security Services Industry Volume K Unit Forecast, by Installation 2019 & 2032
- Table 49: Global Smart Home Security Services Industry Revenue Million Forecast, by Country 2019 & 2032
- Table 50: Global Smart Home Security Services Industry Volume K Unit Forecast, by Country 2019 & 2032
- Table 51: China Smart Home Security Services Industry Revenue (Million) Forecast, by Application 2019 & 2032
- Table 52: China Smart Home Security Services Industry Volume (K Unit) Forecast, by Application 2019 & 2032
- Table 53: Japan Smart Home Security Services Industry Revenue (Million) Forecast, by Application 2019 & 2032
- Table 54: Japan Smart Home Security Services Industry Volume (K Unit) Forecast, by Application 2019 & 2032
- Table 55: India Smart Home Security Services Industry Revenue (Million) Forecast, by Application 2019 & 2032
- Table 56: India Smart Home Security Services Industry Volume (K Unit) Forecast, by Application 2019 & 2032
- Table 57: Rest of Asia Pacific Smart Home Security Services Industry Revenue (Million) Forecast, by Application 2019 & 2032
- Table 58: Rest of Asia Pacific Smart Home Security Services Industry Volume (K Unit) Forecast, by Application 2019 & 2032
- Table 59: Global Smart Home Security Services Industry Revenue Million Forecast, by Product 2019 & 2032
- Table 60: Global Smart Home Security Services Industry Volume K Unit Forecast, by Product 2019 & 2032
- Table 61: Global Smart Home Security Services Industry Revenue Million Forecast, by Installation 2019 & 2032
- Table 62: Global Smart Home Security Services Industry Volume K Unit Forecast, by Installation 2019 & 2032
- Table 63: Global Smart Home Security Services Industry Revenue Million Forecast, by Country 2019 & 2032
- Table 64: Global Smart Home Security Services Industry Volume K Unit Forecast, by Country 2019 & 2032
- Table 65: Saudi Arabia Smart Home Security Services Industry Revenue (Million) Forecast, by Application 2019 & 2032
- Table 66: Saudi Arabia Smart Home Security Services Industry Volume (K Unit) Forecast, by Application 2019 & 2032
- Table 67: United Arab Emirates Smart Home Security Services Industry Revenue (Million) Forecast, by Application 2019 & 2032
- Table 68: United Arab Emirates Smart Home Security Services Industry Volume (K Unit) Forecast, by Application 2019 & 2032
- Table 69: Rest of Middle East and Africa Smart Home Security Services Industry Revenue (Million) Forecast, by Application 2019 & 2032
- Table 70: Rest of Middle East and Africa Smart Home Security Services Industry Volume (K Unit) Forecast, by Application 2019 & 2032
- Table 71: Global Smart Home Security Services Industry Revenue Million Forecast, by Product 2019 & 2032
- Table 72: Global Smart Home Security Services Industry Volume K Unit Forecast, by Product 2019 & 2032
- Table 73: Global Smart Home Security Services Industry Revenue Million Forecast, by Installation 2019 & 2032
- Table 74: Global Smart Home Security Services Industry Volume K Unit Forecast, by Installation 2019 & 2032
- Table 75: Global Smart Home Security Services Industry Revenue Million Forecast, by Country 2019 & 2032
- Table 76: Global Smart Home Security Services Industry Volume K Unit Forecast, by Country 2019 & 2032
- Table 77: Brazil Smart Home Security Services Industry Revenue (Million) Forecast, by Application 2019 & 2032
- Table 78: Brazil Smart Home Security Services Industry Volume (K Unit) Forecast, by Application 2019 & 2032
- Table 79: Mexico Smart Home Security Services Industry Revenue (Million) Forecast, by Application 2019 & 2032
- Table 80: Mexico Smart Home Security Services Industry Volume (K Unit) Forecast, by Application 2019 & 2032
- Table 81: Rest of Latin America Smart Home Security Services Industry Revenue (Million) Forecast, by Application 2019 & 2032
- Table 82: Rest of Latin America Smart Home Security Services Industry Volume (K Unit) Forecast, by Application 2019 & 2032
Frequently Asked Questions
1. What is the projected Compound Annual Growth Rate (CAGR) of the Smart Home Security Services Industry?
The projected CAGR is approximately 24.10%.
2. Which companies are prominent players in the Smart Home Security Services Industry?
Key companies in the market include iControl Networks Inc , Honeywell International Inc, ADT Security Services, United Technologies Corporation, Smart home Inc, Comcast Corporation, Vivint Inc, Tyco Security Products, Control4 Corporation, AT&T Inc.
3. What are the main segments of the Smart Home Security Services Industry?
The market segments include Product, Installation.
4. Can you provide details about the market size?
The market size is estimated to be USD XX Million as of 2022.
5. What are some drivers contributing to market growth?
Growing Safety Concerns; Decreasing Costs of Sensors.
6. What are the notable trends driving market growth?
Video Surveillance systems are expected to register significant growth in forecasted period.
7. Are there any restraints impacting market growth?
High Installation Costs.
8. Can you provide examples of recent developments in the market?
June 2020: Swann, engaged in providing do-it-yourself security solutions, announced the release of the Swann Wire-Free Security Camera, a new, completely wireless camera that can be set up in seconds and used for monitoring indoors or outdoors in homes. The camera is stocked with modern smart security features, including free face recognition and cloud or local storage.
9. What pricing options are available for accessing the report?
Pricing options include single-user, multi-user, and enterprise licenses priced at USD 4750, USD 5250, and USD 8750 respectively.
10. Is the market size provided in terms of value or volume?
The market size is provided in terms of value, measured in Million and volume, measured in K Unit.
11. Are there any specific market keywords associated with the report?
Yes, the market keyword associated with the report is "Smart Home Security Services Industry," which aids in identifying and referencing the specific market segment covered.
12. How do I determine which pricing option suits my needs best?
The pricing options vary based on user requirements and access needs. Individual users may opt for single-user licenses, while businesses requiring broader access may choose multi-user or enterprise licenses for cost-effective access to the report.
13. Are there any additional resources or data provided in the Smart Home Security Services Industry report?
While the report offers comprehensive insights, it's advisable to review the specific contents or supplementary materials provided to ascertain if additional resources or data are available.
14. How can I stay updated on further developments or reports in the Smart Home Security Services Industry?
To stay informed about further developments, trends, and reports in the Smart Home Security Services Industry, consider subscribing to industry newsletters, following relevant companies and organizations, or regularly checking reputable industry news sources and publications.
Methodology
Step 1 - Identification of Relevant Samples Size from Population Database


Step 2 - Approaches for Defining Global Market Size (Value, Volume* & Price*)

Note*: In applicable scenarios
Step 3 - Data Sources
Primary Research
- Web Analytics
- Survey Reports
- Research Institute
- Latest Research Reports
- Opinion Leaders
Secondary Research
- Annual Reports
- White Paper
- Latest Press Release
- Industry Association
- Paid Database
- Investor Presentations

Step 4 - Data Triangulation
Involves using different sources of information in order to increase the validity of a study
These sources are likely to be stakeholders in a program - participants, other researchers, program staff, other community members, and so on.
Then we put all data in single framework & apply various statistical tools to find out the dynamic on the market.
During the analysis stage, feedback from the stakeholder groups would be compared to determine areas of agreement as well as areas of divergence


